The Positive Similarity of Company Filings and the Cross-Section of Stock Returns
The usage of alternative data is now a main-stream topic in investment management and algorithmic trading. So let’s together explore the textual analysis of 10-K & 10-Q filings and analyze how these datasets could be used as a profitable part of investment portfolios. We invite you to read this short summarization of the research. Full version can be found on the SSRN.
Introduction
A 10-K or a 10-Q are periodically filed reports by publicly-traded companies. Those reports consist of relevant information about financial performance, and rightfully reports receive great interest from investors, analysts but also academics as well.
Nowadays, there is a high and increasing volume of published 10-K & 10-Q reports. There is also a gradual shift to non-numerical information, which means that the reports are consisting of an increasing amount of text-based information that is harder to analyze. This allows management to include a lot of white noise into reports or “manipulate” the choice of the language. Mandatory filings could be written using a speculative language to present the information in a better light, while still being in line with rules. There is a possibility to create a picture of the company that is favourable for the image of the company; however, it does not tell the absolute truth.
This can be overcome by advanced machine learning methods. The sufficient computing power for advanced algorithms offer us a new data-driven view on the increasingly bigger data of 10-K &10-Q reports. Therefore, it is possible to identify the type of the language used, compare the reports with the previous, identify changers/non-changers or the similarity of langue used compared to the earlier reports. One of the most significant results is the work of Cohen et al. (2019). According to this research that is commonly known as “the Lazy prices“, firms that do change reports outperform non-changers.
In this novel research, with the help of the Brain Company, which provided the data of textual analysis of reports, we study the similarity of language. Analyzing preliminary results, the similarity of the reports yields different results based on the type of language used. There are two significant differences across types of language similarities recognized by the Brain Company (all, positive, negative, uncertainty, litigious, constraining and interesting language). The decile sorts of stocks do not have a unified pattern across all types of language. The highest (lowest) decile is not always the most profitable (unprofitable). Moreover, the degree of profitability changes from a kind of language to another. For example, by examining portfolio sorts based on the similarity of uncertainty language, We can confirm the results of Cohen et al. (2019), where the lowest similarity (changers) decile is outperformed by the highest similarity decile (non-changers). However, the results reverse when positive language is considered. For a positive language, the lowest similarity decile outperforms the highest similarity decile by 0.41% monthly (around 5% yearly).
Naturally, the research paper “Lazy prices” is very close to this research, but there are three main differences.
Firstly, as it was previously mentioned, this paper is focused on the similarity of positive language only, motivated by the search for the most profitable strategy.
Secondly, the holding period is shorter (one month compared to three months), and stocks are sorted into deciles based on their most recent 10-K or 10-Q report. Each stock is ranked every month and not only after the new report is released. Stock enters the portfolio based on the most recent report. For contrast, in the “Lazy prices”, stock enters the portfolio in the month after the public release of either 10-K or 10-Q. The approach used in this paper brings two main benefits: simplicity and diversification. Because the most recent reports ensure that the investment universe is larger. Tests have showed that the strategy could be formed with the average similarity based on the past 200 days, holding stocks for another 200 days (which is much longer than three months). Therefore, there is no need to always wait for the newest information if the portfolio can be much more diversified.
Lastly, the investment universe is different. The “Lazy prices” examine the effect on approximately 4000 stocks (based on the count of reports, backtesting length and quarterly period), which has to include smaller capitalization stocks and possible liquidity issues. We study the effect on the stocks with large market capitalization since the Brain analyzes company reports for approximately the largest 1000 US stocks. As a result, the investment universe includes mostly large caps with better liquidity and lower slippage costs and spreads.
Trading strategy
Since the aim is to explore the economic significance of the similarity data, the usability is explored through a classical portfolio sorting approach. At the end of the month, stocks are ranked according to their most recent positive similarity scores.
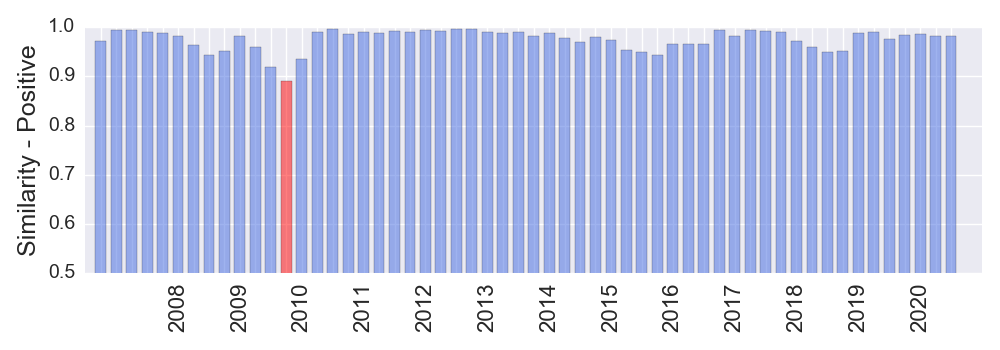
ACADIA is an excellent example of a stock that has a similar positive language in the filings. It is expected that it will have consistently high ranks.
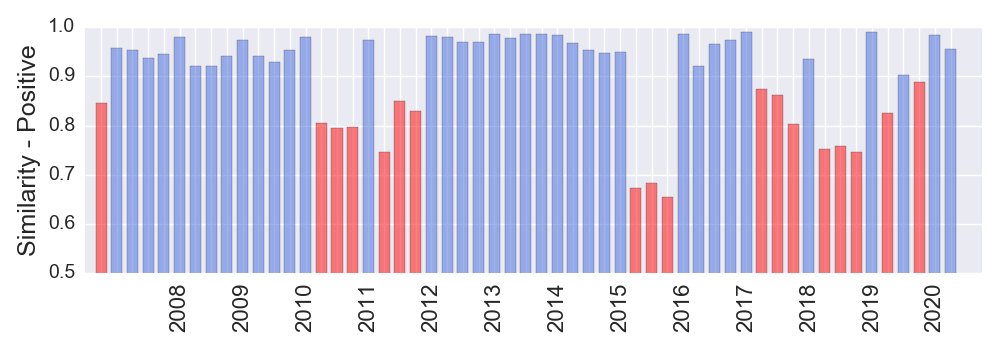
On the other hand, NVIDIA frequently changes the positive language and filings are often dissimilar. It is natural to expect that NVIDIA will frequently have a low rank.
While some firms have similar positive language, some change it frequently. In general, the effect of the positive similarity can be examined by sorting stocks into deciles and examine the performance.
| Decile | 1 | 2 | 3 | 4 | 5 | 6 | 7 | 8 | 9 | 10 |
| Ret | 1.14 | 1.13 | 1.16 | 0.93 | 1.11 | 0.97 | 1.03 | 0.82 | 0.81 | 0.73 |
| Sd | 5.60 | 5.64 | 5.46 | 5.31 | 5.67 | 5.61 | 5.69 | 5.34 | 5.23 | 5.68 |
While the differences are not extreme, they are present, and in general, the return declines with raising decile. Therefore, low positive similarity stocks tend to outperform high similarity stocks. Additionally, while the first three deciles are highly statistically significant, the last three deciles are statistically insignificant on the 5% significance level (in other words, the p-value is higher than 0.05).
One viable strategy could be going long the first or even the first three deciles. Either used as a standalone strategy or in a portfolio as a building block, the investor could profit from the edge that low similarity stocks have over high similar. Furthermore, the positive similarity score can be utilized in a typical anomaly-based long-short strategy and compared to the common equity risk factors.
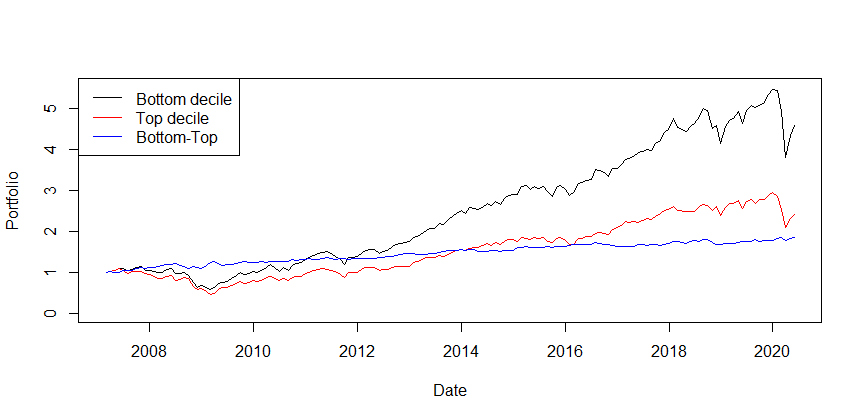
A dollar invested in the bottom decile 28.2.2007 would result in 4.58 USD on 29.5.2020. For top decile, it would be 2.40 USD and 1.84 USD for bottom minus top portfolio. The bottom-top portfolio seems to be flat, but it is, in fact, very consistent and non-risky, yet not that profitable.
| Return | Volatility | Risk-adjusted return | Max Drawdown | |
| Bottom | 14.58% | 19.40% | 0.75 | -49.50% |
| Top | 9.11% | 19.70% | 0.46 | -58.81% |
| Bottom-Top | 5.47% | 6.48% | 0.84 | -10.43% |
Short conclusion
According to the results, different types of language have distinct implications for the subsequent stock returns. Preliminary results have revealed that the similarity of positive language provided by the Brain Company can be a base of the most economically significant strategy among all languages considered. Such a strategy is significantly profitable as a long-only: the investor goes long the lowest similarity stocks. The difference of returns between the lowest similarity stocks and the highest similarity stocks is around 5% (yearly, with Sharpe ratio 0.84). Therefore the long-short portfolio may not seem to be as profitable compared to the long-only. However, it has significant risk-adjusted return and very consistent performance and can be very attractive for risk-averse investors. Moreover, the results are based on stocks with large market capitalization since the Brain analyzes company reports for approximately the largest 1000 US stocks, which ensures better liquidity and lower slippage costs and spreads.
Results also suggest that the low positive similarity effect is a distinct anomaly in the financial markets. Asset pricing models cannot wholly explain the performance of the strategy. Additionally, the change of sentiment extracted from filings also cannot explain the positive similarity effect.
Author:
Matus Padysak, Senior Quant Analyst, Quantpedia
Are you looking for strategies applicable in bear markets? Check Quantpedia’s Bear Market Strategies
Are you looking for more strategies to read about? Sign up for our newsletter or visit our Blog or Screener.
Do you want to learn more about Quantpedia Premium service? Check how Quantpedia works, our mission and Premium pricing offer.
Do you want to learn more about Quantpedia Pro service? Check its description, watch videos, review reporting capabilities and visit our pricing offer.
Do you want algorithmic access to the full Quantpedia database via the API? Subscribe to Quantpedia Pro, ask for an API key, and explore the in/out-of-sample statistics, source academic papers, and code snippets — ideal for quantitative research, systematic trading workflows, and AI model training.
Are you looking for historical data or backtesting platforms? Check our list of Algo Trading Discounts.
Or follow us on:
Facebook Group, Facebook Page, Telegram, Twitter, Linkedin, Medium or Youtube
Share onLinkedInTwitterFacebookRefer to a friend


