The Role of Interest Rates in Factor Discovery
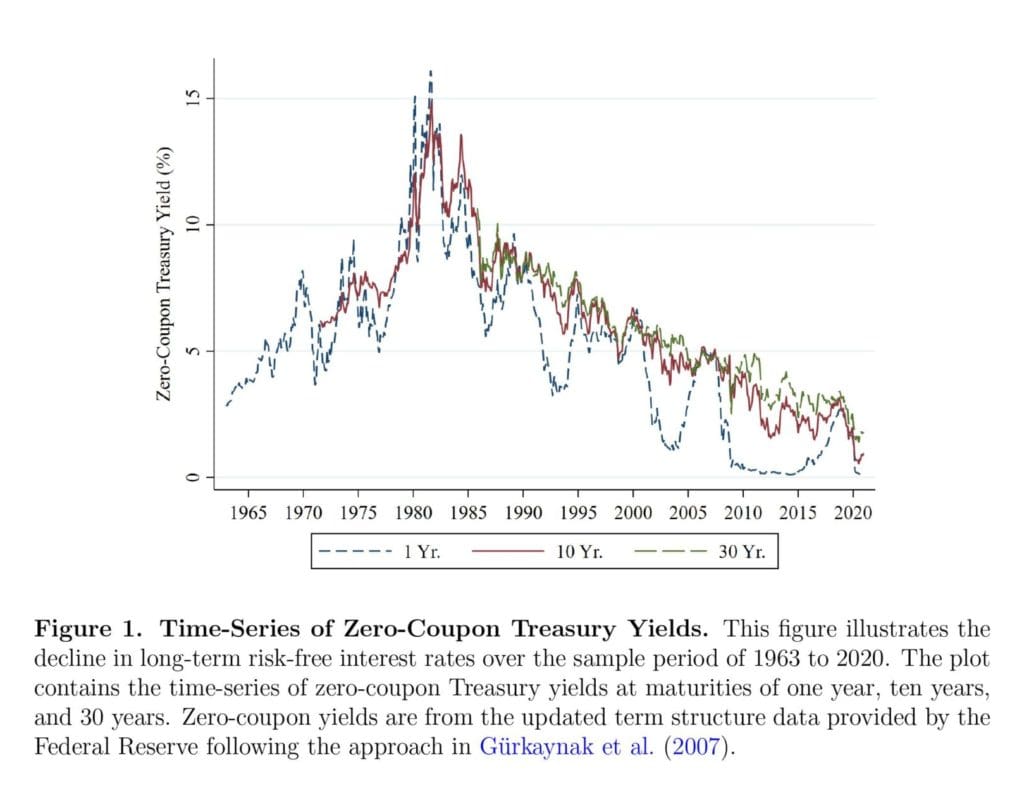
Over the past several decades, economists and quantitative scientists found a very large number of asset pricing anomalies and published numerous research papers about their findings, and this is known in the financial jargon as “factor zoo.” However, one strong underlying force might drive the performance of many of those anomalies. What’s that force? The level and trend in the interest rates, as in almost all parts of the developed world, there was a long-term steady decline in rates and inflation for nearly 40 years. We use the past tense as it seems that the situation changed at the beginning of this year…
Van Binsbergen, Jules H. and Ma, Liang and Schwert, Michael (Sep 2022) touched on this subject and made a careful examination of both past factor research and found that a significant part of published papers and developed models are sometimes unknowingly exposed to fitting to low or even zero interest rates. They sorted 153 anomalies and tested them on sensitivity to interest rate change. Out of them, 63 are robust anomalies, 14 are false positives, 7 are false negatives, and 69 are non-robust anomalies.
Their results can be taken as a warning that the anomalous return patterns that are driven by the secular decline in interest rates over the previous 40 years don’t have to repeat themselves in case there is a secular increase in the interest rates in the future.
Just a side note here – we totally agree that inflation and the level of interest rates have an impact on the performance trading strategies. This finding is in line with the article we published a few months ago (What’s the Best Factor for High Inflation Periods? – Part I and Part II). And that’s also a reason why Quantpedia Pro users can investigate trading strategies and/or model portfolios in various market regimes by using Inflation/Commodity Phases or Fixed Income Phases Analysis.
Authors: Jules H. van Binsbergen, Liang Ma, and Michael Schwert
Title: The Factor Multiverse: The Role of Interest Rates in Factor Discovery
Link: https://papers.ssrn.com/sol3/papers.cfm?abstract_id=4231626
Abstract:
We study the importance of the decline in interest rates in the discovery of asset pricing anomalies. We investigate 153 discovered anomalies as well as 1,395 potential undiscovered anomalies and find that absent the decline in interest rates, the asset pricing literature would likely entertain a different set of anomalies today. As the decline in interest rates is not continuing, a reevaluation of relevant anomalies going forward is warranted. To this end, we use a duration-based interest rate adjustment procedure to classify anomalies into false positives, false negatives, and those robust to the effect of interest rates. Our analysis highlights the sensitivity of the factor discovery process to this specific observed economic time period.
As always we present several interesting figures:
Notable quotations from the academic research paper:
“We find that adjusting for interest rate changes has an important effect on a substantial fraction of both discovered and undiscovered anomalies. First, we evaluate the 153 discovered anomalies over the sample presented in the original papers that discovered them. We find that 63 of them are robust with t-statistics higher than 1.96 in absolute value with or without the adjustment for interest rate changes. In contrast, 21 of them can be classified as false positives (raw original t-statistic higher than 1.96 and adjusted t-statistic lower than 1.96) or false negatives (raw t-statistic lower than 1.96 and adjusted t-statistic higher than 1.96).2 Defining false positives or negatives as false discoveries and robust anomalies as true discoveries, we find the false-to-true ratio (i.e., the ratio between false and true discoveries) is 33%.
We merge the data set of 153 anomaly variables with the stock sample consisting of all common stocks traded on NYSE, Amex, and NASDAQ. Stock return data are from CRSP, and we adjust delisting returns following Shumway and Warther (1999). We use NYSE breakpoints for portfolio sorts to mitigate the influence of microcap stocks. We form value-weighted portfolios and rebalance portfolios monthly. For 151 continuous anomaly variables, we sort stocks into deciles and form long and short portfolios using the top and bottom deciles. For two discrete anomaly variables (f_score and ni_inc8q), we sort stocks into terciles and form long and short portfolios using the top and bottom terciles.
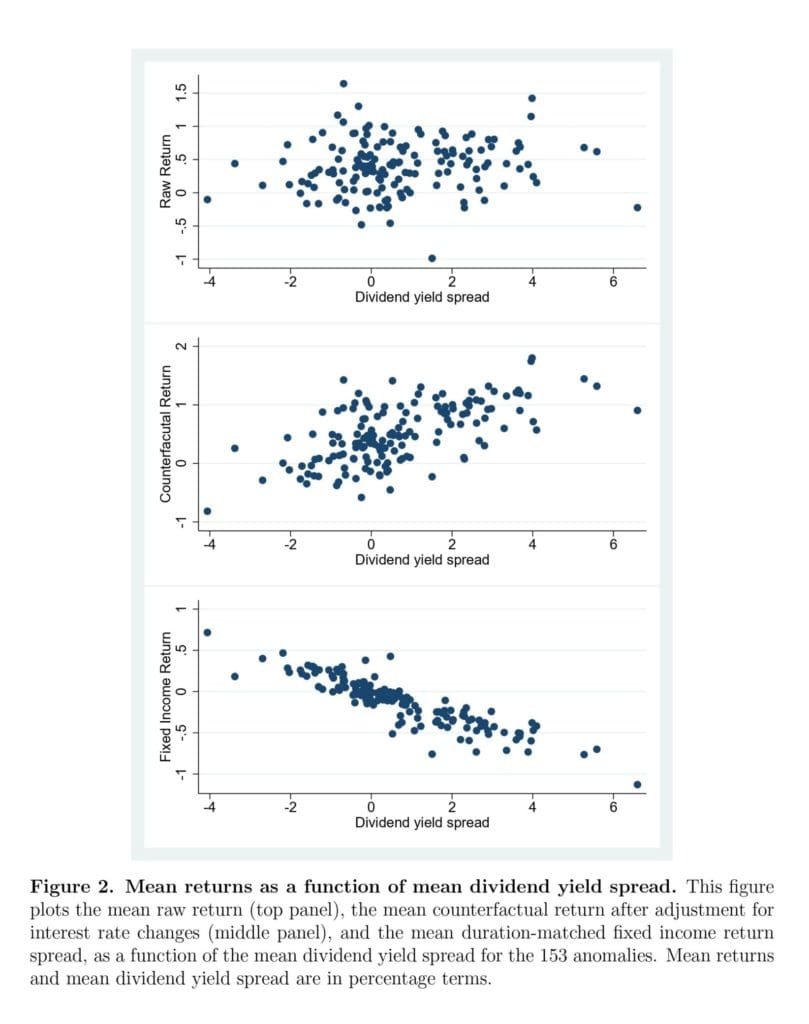
An anomaly strategy involves buying stocks in the long leg and shorting stocks in the short leg. To the extent that stocks in the long and short legs have different durations, the secular interest rate decline observed in the past decades itself can lead to a return spread between the two portfolios. To correct for this effect of interest rate decline, we construct counterfactual fixed income (government bond) portfolios that match the duration for the long and short portfolios, respectively. The duration matching is performed on a dividend-strip-by-dividend- strip basis following Binsbergen (2021) and Binsbergen and Schwert (2022). We then take the difference in returns between these two fixed income portfolios and refer to it as the duration-matched fixed income return spread, denoted by rfit+1.
Figure 2 shows the scatter plots of the mean raw return (Panel A), the mean counter-factual return (Panel B), and the duration-matched fixed income return spread (Panel C) as a function of the mean dividend yield spread for the 153 anomalies. It is evident that adjusting for the interest rate decline has a significant effect on long-short return spreads for a large number of anomalies. Panel C shows that the duration-matched counterfactual returns decline with the dividend yield spread, or equivalently increase with the duration spread between long and short portfolios. This is consistent with the results in Table 2 that long-maturity bonds outperform short-maturity bonds in our sample period.
The top panel of Figure 3 shows the scatter plot of the raw and adjusted t-statistics for false positives, false negatives, robust anomalies, and non-robust anomalies. The vertical and horizontal dashed lines represent t − statistic = 1.96. They divide the graph into four quadrants, where the first quadrant corresponds to robust anomalies, the second quadrant corresponds to false negatives, the third quadrant corresponds to non-robust anomalies, and the fourth quadrant corresponds to false positives. To show false positives and false negatives more clearly, the bottom panel of Figure 3 shows the same scatter plot but only for these two groups of anomalies.
Table 4 lists the individual members of the four groups of anomalies. From Panel A of Table 4 and the bottom panel of Figure 3, it is interesting that several prominent anomalies belong to the group of false positives and negatives. They include the gross profitability premium gp_at (Novy-Marx (2013)), return on assets niq_at (Balakrishnan et al. (2010)), the performance-based mispricing mispricing_perf (Stambaugh and Yuan (2017)), quality- minus-junk qmj (Asness et al. (2019)), short-term reversal ret_1_0 (Jegadeesh (1990)), max daily return rmax1_21d (Bali et al. (2011)), and return volatility rvol_21d (Ang et al. (2006)).”
Are you looking for more strategies to read about? Sign up for our newsletter or visit our Blog or Screener.
Do you want to learn more about Quantpedia Premium service? Check how Quantpedia works, our mission and Premium pricing offer.
Do you want to learn more about Quantpedia Pro service? Check its description, watch videos, review reporting capabilities and visit our pricing offer.
Do you want algorithmic access to the full Quantpedia database via the API? Subscribe to Quantpedia Pro, ask for an API key, and explore the in/out-of-sample statistics, source academic papers, and code snippets — ideal for quantitative research, systematic trading workflows, and AI model training.
Are you looking for historical data or backtesting platforms? Check our list of Algo Trading Discounts.
Or follow us on:
Facebook Group, Facebook Page, Telegram, Twitter, Linkedin, Medium or Youtube
Share onLinkedInTwitterFacebookRefer to a friend


