VIX-Yield Curve Cycles May Predict Recessions
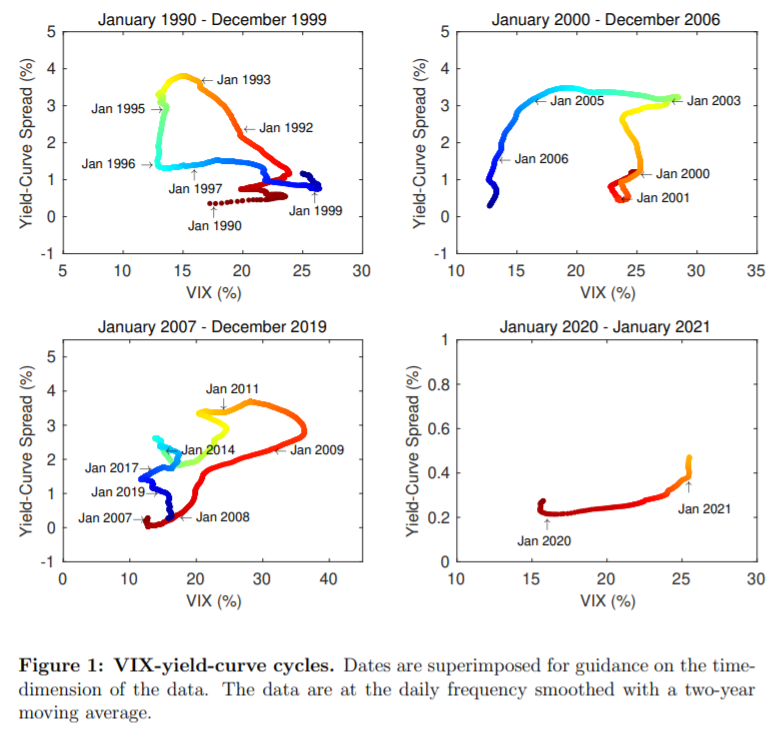
Equities provide significant long-term returns, but the growth certainly is not constant or even stable. Anyway, this holds for almost every financial asset. Bear markets alternate bull markets, and expansion periods rotate with recession periods. Since recessions and bear markets come hand in hand for several asset classes, recession predictions have always been the foremost concern. The yield curve slope, defined as the difference between long and short-term rates, is the leading indicator backed by numerous research papers. Hansen (2021) builds on this theorem, but the author improves the recession prediction by her empirical observation that the VIX index (index of implied equity volatility or fear index) and the slope co-move in counterclockwise cycles, which align with business cycles.
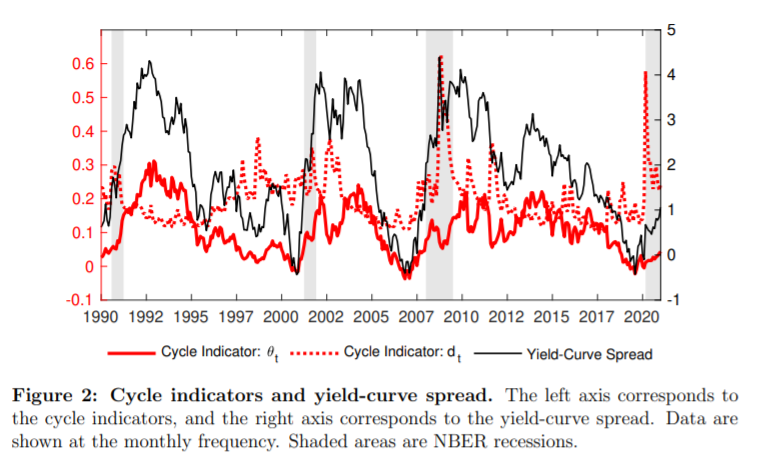
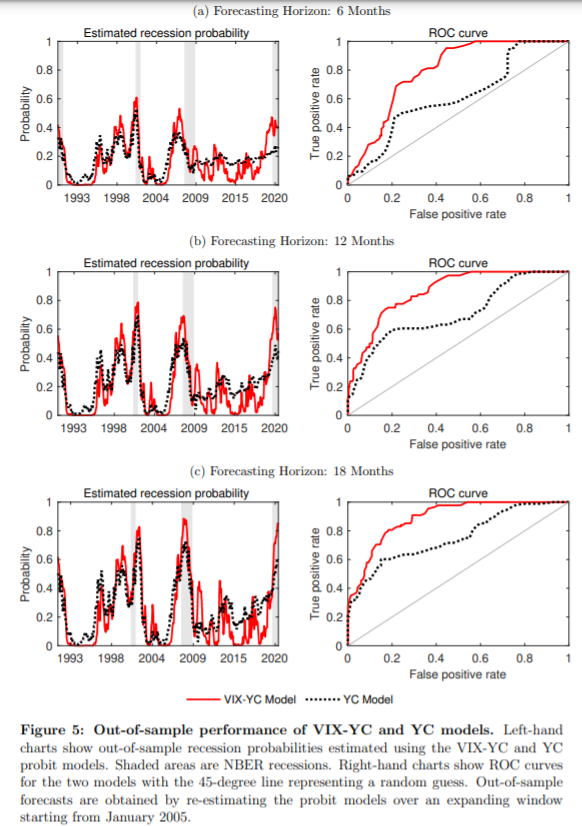
Recessions are connected with a flat (or even inverted) yield curve and high levels of the VIX index. Therefore, the VIX-yield-curve cycle is able to capture the interaction between the monetary policy (yield curve) and the information from financial markets (implied volatility). The theory and empirical observations are used to construct an indicator of the economy’s location by calculating the angle in a polar coordinate system of VIX and slope. Next, the predictor is used in a probit model to estimate the probability of recession in the subsequent 6, 12, or 18 months. The results are promising; the indicator outperforms other widely-recognized recession predictors. Moreover, according to the author, the results hold both in- or out-of-sample and in static or dynamic probit models.
| Do you look for more research related to Crisis Hedge strategies? See Quantpedia Solutions for Bear Markets. |
Authors: Anne Lundgaard Hansen
Title: Predicting Recessions Using VIX-Yield-Curve Cycles
Link: https://papers.ssrn.com/sol3/papers.cfm?abstract_id=3943982
Abstract:
The VIX index and the spread between long- and short-term Treasury bond yields co-move in counterclockwise cycles that align with the business cycle. Based on this empirical fact, I predict U.S. recessions using an indicator of the economy’s location on the VIX-yield-curve cycle. The proposed indicator significantly outperforms the yield-curve spread in predicting U.S. recessions from 1990–2021 both in- and out- of-sample using both static and dynamic probit models. VIX-yield-curve cycles also contain predictive power above and beyond other leading economic indicators.
As always we present several interesting figures:
Notable quotations from the academic research paper:
“This paper proposes a new predictor of U.S. recessions based on the interaction between implied equity volatility and the yield curve. As well-known, the spread between longand short-term bond yields is useful for forecasting recessions (Estrella and Hardouvelis, 1991, Estrella and Mishkin, 1998, Harvey, 1988). Indeed, the yield curve has inverted with long-term rates below short-term rates preceding every recession since 1971.
I am motivated by the empirical observation that the VIX index and the slope of the yield curve co-move through counterclockwise cycles that are aligned with the business cycle. Recessionary periods are characterized by a combination of high levels of the VIX index and a flat yield curve. This relationship is robust and has repeated itself through all business cycles for which VIX index data are available. In broad terms, VIX-yield-curve cycles capture the interplay between financial markets and the stance of monetary policy.
The paper begins by constructing an indicator of the economy’s location on the VIX-yield-curve cycle using the angle in a polar coordinate system of VIX index and yield-curve spread observations. This cycle indicator is then used as a predictor in a probit model for the probability of recession within respectively 6, 12, and 18 months. I evaluate the performance of this model relative to a probit model using the yield-curve spread alone. The models are compared both based on measures of fit and their ability to correctly classify periods of recession. The results unambiguously show that the cycle indicator significantly outperforms the yield-curve spread in predicting recessions at all considered horizons. When including both the cycle indicator and the spread in a multivariate probit model, the performance is not significantly improved over the univariate model with the cycle indicator alone.
Furthermore, the cycle indicator dominates these alternative predictors in univariate probit models. The best-performing model involves a combination of the cycle indicator and LEI. These results hold both in- and out-of-sample using both static and dynamic probit models. There also exists circular patterns in the scatter plots of the yield curve spread and respectively the Economic Policy Index (EPU) from Baker, Bloom, and Davis (2016) and the MOVE index measuring implied volatility in Treasury bond markets. I show that the cycle indicators constructed by replacing the VIX index by respectively the MOVE and EPU indices also contain predictive power for future recessions. The indicator using the MOVE index is not significantly different from the baseline results. In contrast, using the EPU index delivers statistically worse predictive outcomes. These results indicate that the predictive power of the cycle indicator stems from the interaction between monetary policy and financial market volatility rather than the uncertainty around policy.”
Are you looking for more strategies to read about? Sign up for our newsletter or visit our Blog or Screener.
Do you want to learn more about Quantpedia Premium service? Check how Quantpedia works, our mission and Premium pricing offer.
Do you want to learn more about Quantpedia Pro service? Check its description, watch videos, review reporting capabilities and visit our pricing offer.
Do you want algorithmic access to the full Quantpedia database via the API? Subscribe to Quantpedia Pro, ask for an API key, and explore the in/out-of-sample statistics, source academic papers, and code snippets — ideal for quantitative research, systematic trading workflows, and AI model training.
Are you looking for historical data or backtesting platforms? Check our list of Algo Trading Discounts.
Or follow us on:
Facebook Group, Facebook Page, Twitter, Linkedin, Medium or Youtube
Share onLinkedInTwitterFacebookRefer to a friend


