Working with High-Frequency Tick Data – Cleaning the Data
Tick data is the most granular high-frequency data available, and so is the most useful in market microstructure analysis. Unfortunately, tick data is also the most susceptible to data corruption and so must be cleaned and conditioned prior to being used for any type of analysis.
This article, written by Ryan Maxwell, examines how to handle and identify corrupt tick data (for analysts unfamiliar with tick data, please try an intro to tick data first).
Causes of data-corruption?
Tick data is especially vulnerable to data-corruption due to the high-volume of data – a high-volume stock tick data set such for MSFT (Microsoft) can easily amount to 100,000 ticks per day, making error detection very challenging. Typically it is signal interruptions or signal delays that cause either corrupted or out-of-sequence data.
Defining ‘Bad’ Data
Before generating data filters, we first need to designate what constitutes a bad tick. It is a common error to make the test too restrictive and therefore eliminate valid data merely because it is not consistent with the data points close by it (in fact these ticks are often the most useful in trading simulations as they provide information on the market direction or they are trading opportunities themselves).
Thus, there is a need to balance the tradeoff between data completeness and data integrity based on how sensitive the analysis is to bad data.
What tools to use for data checking/cleaning
Unfortunately, there are very few off-the-shelf tools for cleaning time-series data and Excel is not suitable due to its memory requirements (on most systems Excel cannot efficiently work with spreadsheets over 1 million rows which may only be several weeks of tick data). Tools such as OpenRefine (formerly GoogleRefine) are typically more suited to structured data such as customer data.
Custom Python scripts are probably the most flexible and efficient method and are the most commonly used method in machine learning on time-series datasets.
Types of corrupt data and tests
There are numerous types of bad ticks, and each type will require a different test:
Zero or Negative Prices or Volumes
This is the simplest test – ticks with zero or negative prices or volumes are clearly errors and can be immediately discarded.
Simultaneous Observations
Multiple ticks can often be observed for the same timestamp. Since ultra high-frequency models for the modelling tick data typically require a single observation for each timestamp, some form of aggregation needs to be performed. In the case of bid/ask tick data we would use the highest bid and lowest offer (provided the bid is still less than or equal to the offer) and aggregating the volumes for both the bid and the ask price.
Trade data is more problematic as it cannot be easily aggregated. We would normally favour aggregating the volumes and then using a single volume-weighted price.
Bid/Ask Bounce
This is the phenomena of price appearing to ‘bounce’ around when in fact all that is happening is the bid/ask quote remaining the same and traders selling at the bid and buying at the offer giving the impression of price movement on the trade tick data.
The bid/ask bounce is the major reason why many analysts only use the bid/ask tick sequence and ignore the trade tick data. However, if using the trade tick data is essential, one method of eliminating ‘bounces’ is to only accept trade ticks which move the price by more than the bid/ask spread from the prior tick (this is a major reason why it is necessary to have both bid/ask tick as well as trade tick data).
| Do you want to test these ideas yourself? We offer our readers Historical Trading Data Discounts. |
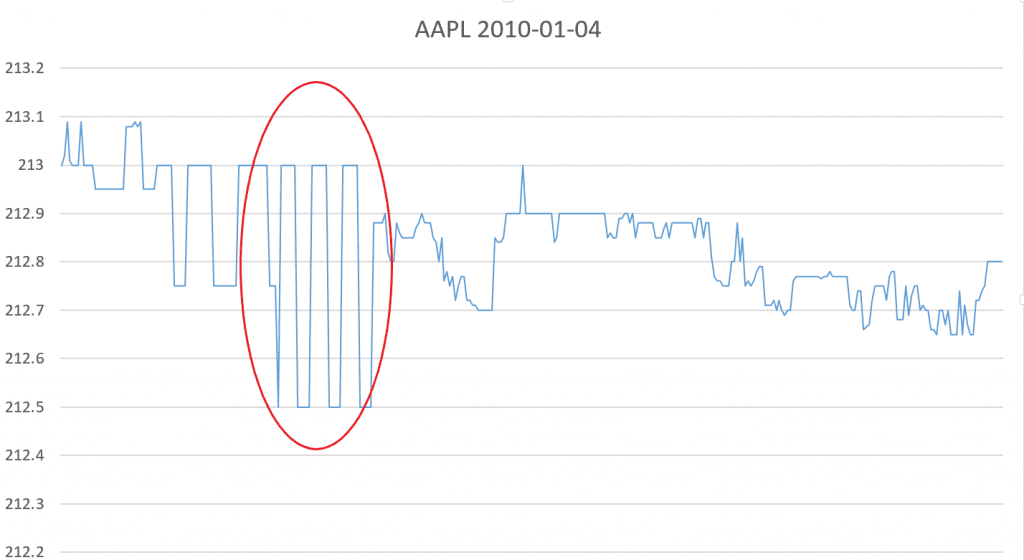
In the above chart of Apple’s tick movements for Jan 4 2010 the bid-ask bounce can be seen in the highlighted red area. During the period of the bid-ask bounce the price appears to move up and down as the bid and ask quotes are executed against; however, this pattern can clearly be identified by repeated prices with no trend.
Low volume ticks
Whilst low volume ticks are not necessarily an error, they contain very little information and are often considered noise and removed.
Gaps
System outages and network interruptions can result in periods where ticks are not recorded. Whilst missing information cannot be replaced if it was never recorded, analysts may still want to highlight periods where there are likely gaps in the record since this may give artificial signals such as sudden price or volume movements when in reality the movement has been more gradual.
One feature of tick data is that the data typically has time-clusters, where there are large periods of infrequent trading and then shorter periods of intense trading and large numbers of ticks being generated. Given this uneven distribution of ticks, it is not trivial to test for gaps; however, one potential method is to generate a distribution of gap lengths and flag gaps that are outside three standard deviations from the mean (unlike returns, gaps are relatively normally distributed).
Outliers
Removing erroneous outliers is the most challenging part of the cleaning process and the one requiring the most judgment. Inexperienced analysts will often set the bad data threshold too low and exclude any data appearing irregular and remove valid data which would be crucial in understanding the market structure. There are several approaches to removing outliers, the one which we favour is that outlined by Brownlees and Gallo in their 2006 paper, which is to create rolling numerous confidence intervals during each trading day to assess the likelihood of a tick being an error by reference to ticks closest to it. The procedure takes some testing as the analyst must make an assessment of how many ticks are likely to be errors (in general we would suggest that less than 2% of all ticks are errors).
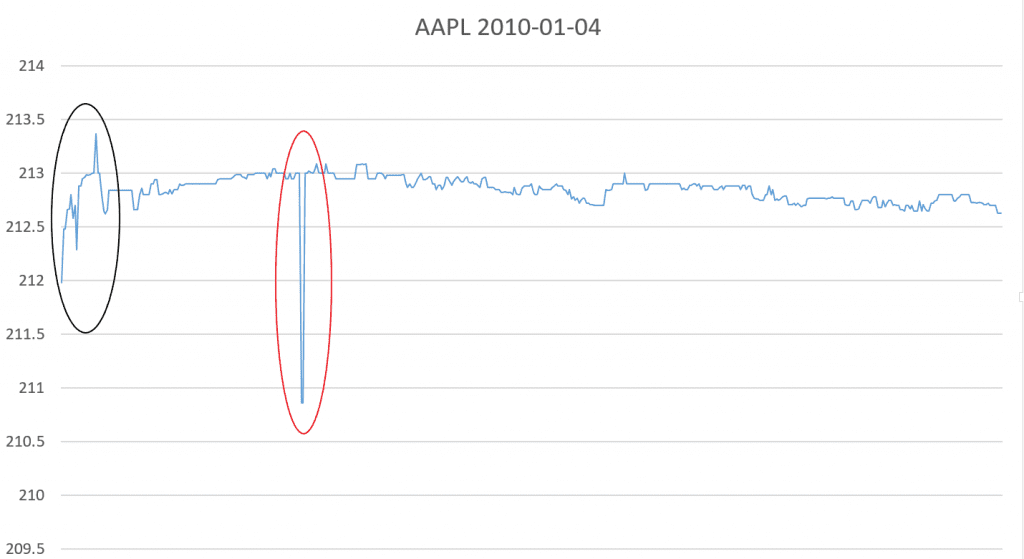
In the above chart of Apple’s tick movements for in Jan 2010, an outlier is highlighted in red versus non-outliers in black. The primary difference is the is volatility versus the nearby ticks – the non-outliers occur during a period of high volatility whereas the outlier is during a period of low volatility and is clearly not consistent with nearby ticks.
Conclusion
The final result should be a dataset free from obvious errors and omissions. A final test is often to plot the data using a charting tool. It takes experience working with tick data to visually identify a clean dataset, but even inexperienced analysts will be able to identify obvious errors not picked up in the above tests and have an intuitive feel for how a clean dataset should appear.
It is recommended that the cleaned dataset be stored as a separate file for the original data as this may be needed in future since over-cleaning is a problem and the cleaning process may need to be repeated with less stringent criteria.
Once the final cleaned dataset is saved and stored it is ready to be analysed, we will examine the insights from analysing the tick dataset such as forecasting or inferring demand imbalances in the next article.
This article was written by Ryan Maxwell, Research Director at FRD Intraday Data.
Are you looking for more strategies to read about? Sign up for our newsletter or visit our Blog or Screener.
Do you want to learn more about Quantpedia Premium service? Check how Quantpedia works, our mission and Premium pricing offer.
Do you want to learn more about Quantpedia Pro service? Check its description, watch videos, review reporting capabilities and visit our pricing offer.
Do you want algorithmic access to the full Quantpedia database via the API? Subscribe to Quantpedia Pro, ask for an API key, and explore the in/out-of-sample statistics, source academic papers, and code snippets — ideal for quantitative research, systematic trading workflows, and AI model training.
Are you looking for historical data or backtesting platforms? Check our list of Algo Trading Discounts.
Or follow us on:
Facebook Group, Facebook Page, Telegram, Twitter, Linkedin, Medium or Youtube
Share onLinkedInTwitterFacebookRefer to a friend


