A Century Without Data: Reconstructing Emerging Markets Equity History
For U.S. equities, fixed income, and commodities, reconstructing long-term historical datasets is relatively straightforward, and we have already explored these challenges in several previous studies, including 100 Years of Multi-Asset Trend Following, Extending Historical Daily Bond Data to 100 Years, and Extending Historical Daily Commodities Data to 100 Years. Moreover, the broader methodology of reconstructing missing market histories shares many similarities with the techniques discussed in How to Replicate Any Portfolio. Emerging markets, however, represent a particularly interesting opportunity for historical reconstruction, as reliable long-term data is often unavailable for much of the 20th century despite the growing importance of these markets in modern portfolio construction and asset allocation. In this article, we present the framework we developed to extend emerging market histories in a consistent and economically meaningful way, enabling more robust long-term quantitative research and modelling.
1926 – 1989
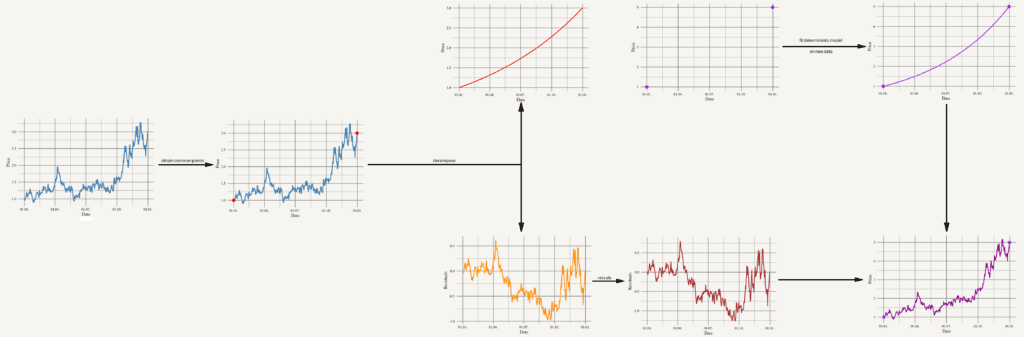
In this period, we will have to rely on historical data that is available only on an annual frequency, as exchanges do not provide daily observations for this time span. This naturally raises the question of how to reconstruct intra-year volatility. From a mathematical perspective, we do not need to go far: a natural framework is to model returns year by year using a geometric Brownian motion. This process consists of a deterministic component, interpretable as continuous compounding, and a stochastic component, which captures volatility.
Starting from a well-observed reference asset, we can decompose its value (price) process into these two parts. The deterministic component can then be reconstructed separately, based on annual observations, for example via exponential interpolation. The stochastic component, on the other hand, can be extracted from the reference series, appropriately rescaled, and subsequently used as the volatility driver for the reconstructed asset.
The scaling itself can be performed, for instance, using the long-term ratio of annualized volatilities of yearly returns, which can be easily estimated for both assets. This procedure ensures that the reconstructed series preserves a realistic volatility structure while remaining consistent with observed annual performance.
The resulting synthetic assets will inevitably exhibit a relatively high degree of correlation. However, this is not necessarily problematic, particularly if the volatility-generating reference is chosen as a U.S. equity index, where volatility is often driven by global shocks and tends to transmit across markets. In this sense, the U.S. market can be interpreted as a natural anchor for global risk dynamics, which justifies its use as the primary source of the stochastic component.
For the deterministic component, the situation is more challenging, as even annual price data for most emerging markets does not exist over the full horizon. The only notable exception is China, where the Shanghai Stock Exchange Project provides a reconstructed USD-denominated index back to 1940. Following the political disruptions beginning in the early 1940s, we can model the gradual destruction of equity value through a compounded negative return process, effectively driving prices toward zero by 1949, where we impose a terminal value of zero. However, one country is clearly not sufficient to represent the entire emerging markets universe, and therefore a broader construction is required.
Since China is essentially the only case with a partially observed index-level history, we need to proceed in a more indirect and creative way. For developed markets, particularly the United States, we do have long-run information on valuation ratios such as the price-to-earnings (P/E) multiple. We assume that the relative P/E ratio between the U.S. and emerging markets is, in the long run, approximately stable. This allows us to infer a long-term P/E level for individual emerging market countries by anchoring them to the U.S. valuation level and applying historical average spreads.
Once we obtain a time series of implied P/E ratios for each country, we still face the problem that P/E alone is not a price. To recover a price index, we need a proxy for earnings. For this purpose, we use publicly available historical export data as a proxy for the productive capacity and external revenue generation of each economy (1926 – 1960, 1960 – 1989). Combining these elements, we obtain a synthetic price series for each country that is internally consistent with both valuation dynamics and macroeconomic fundamentals.
Finally, since our goal is not a set of isolated country series but a single emerging markets representation, we construct a simplified composite portfolio from the subset of countries for which the reconstruction is sufficiently stable and data coverage is adequate. In our case, this includes Argentina, Brazil, Chile, India, South Africa, and China.
1989 – 1997
As we move into a later period, the quality of available data improves significantly. In particular, the Fama–French library provides a monthly time series for an emerging markets portfolio, which allows for a more structured calibration of the reconstruction.
In this setting, we can apply the same decomposition approach as before. First, the U.S. equity index is split into its deterministic component and a residual stochastic component. The deterministic part captures the smooth long-term growth path, while the residual represents the volatility dynamics around this trend. We then rescale the stochastic component and transfer it to the emerging markets series, ensuring that the volatility structure remains consistent with the chosen reference market.
The key difference in this period is the higher frequency of observations. Monthly data substantially increases the information content of the deterministic fit, making the estimated trend more stable and economically plausible.
1997 and forward
In the most recent period, the reconstruction becomes considerably more straightforward. Daily data for emerging markets are available through MSCI Emerging Markets indices, which only require appropriate scaling to ensure continuity with the previously constructed series.
From 2003 onwards, we can further refine the representation using the iShares MSCI Emerging Markets ETF, which in our view provides the most suitable and liquid proxy for the emerging markets asset class in the modern era. This final segment thus serves as the empirical anchor of the entire reconstruction, ensuring consistency with observed market prices while maintaining continuity with the earlier synthetic and lower-frequency components.
Final curve
Once we ensure that all segments are properly aligned at their respective transition points, the result is a continuous price path covering the entire history back to July 1926.
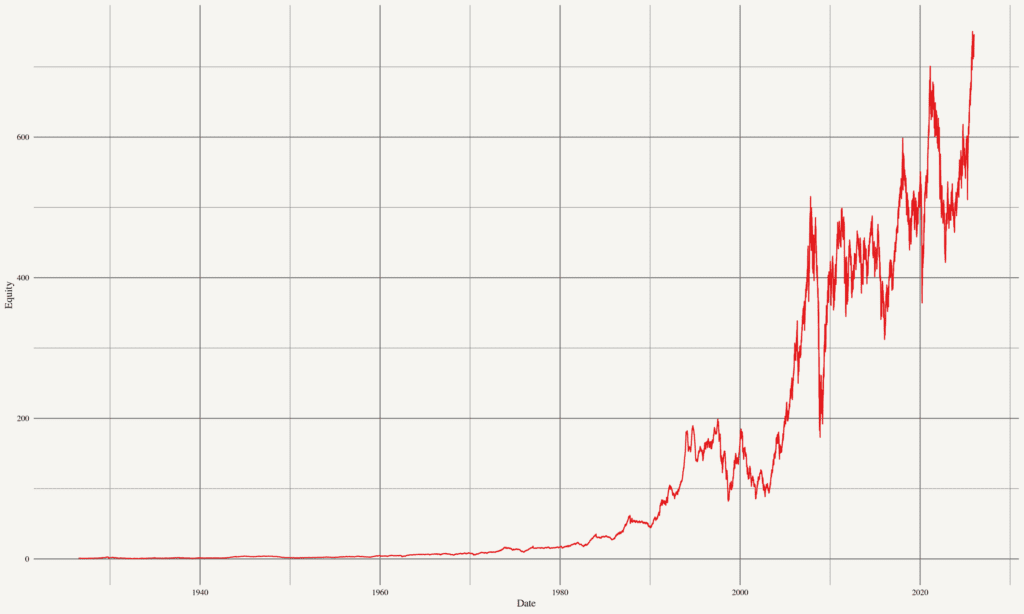

Our reconstruction provides a practical framework for extending emerging market equity history far beyond the period covered by conventional index data. By combining observed market data, valuation anchors, macroeconomic proxies, and a volatility structure derived from a well-documented reference market, the methodology produces a continuous and economically interpretable emerging markets return series back to July 1926. The resulting curve is not meant to replicate every country-specific historical episode with perfect precision; rather, its added value lies in creating a robust long-term proxy for the emerging markets asset class where no reliable daily market history exists. We use this reconstructed series in Quantpedia’s 100 Years Portfolio Analysis (and other similar reports) as the emerging markets input, allowing investors to study long-horizon portfolio behavior, stress periods, drawdowns, diversification benefits, and multi-asset allocation decisions under a much richer historical sample. Beyond our own reports, the same approach can support asset allocation research, strategic portfolio design, risk modelling, regime analysis, and historical simulations where emerging markets exposure is required but standard datasets are too short (or hard to obtain) to provide meaningful long-term evidence.
Author: David Belobrad, Junior Quant Analyst, Quantpedia
Are you looking for more strategies to read about? Sign up for our newsletter or visit our Blog or Screener.
Do you want to learn more about Quantpedia Premium service? Check how Quantpedia works, our mission and Premium pricing offer.
Do you want to learn more about Quantpedia Pro service? Check its description, watch videos, review reporting capabilities and visit our pricing offer.
Do you want algorithmic access to the full Quantpedia database via the API? Subscribe to Quantpedia Pro, ask for an API key, and explore the in/out-of-sample statistics, source academic papers, and code snippets — ideal for quantitative research, systematic trading workflows, and AI model training.
Are you looking for historical data or backtesting platforms? Check our list of Algo Trading Discounts.
Or follow us on:
Facebook Group, Facebook Page, Telegram, Twitter, Linkedin, Medium or Youtube
Share onLinkedInTwitterFacebookRefer to a friend


