From Barrier Crossings to Terminal Distributions: A Skellam-Based Options Pricing Framework for 0-DTE Markets
The explosive growth of hyper-liquid 0-DTE markets has pushed traditional options pricing infrastructure to its breaking point, as continuous Black-Scholes calculus can collapse into an unusable point mass at expiration. Rather than patching a broken formula with hand-fitted tweaks, a new paper suggests dismantling legacy math by replacing continuous geometric Brownian motion with a discrete, order-book-driven structural layer. Instead of smoothing over intraday price action, this model captures the raw physical reality of high-frequency liquidity by deriving a closed-form framework where the implied volatility surface is built directly from actual market microstructure.
The foundational engine under the hood completely throws out return variance, replacing it entirely with barrier-crossing frequency along a dynamic grid anchored to the daily open. Intraday price action is modeled as two directional, independent Poisson count processes tracking up-crossings (N⁺) and down-crossings (N⁻) calibrated to strike-dependent intensities. Because net displacement is calculated as the difference between these discrete counts, the terminal price lands squarely on a Skellam distribution. This mathematical pivot preserves crucial fat tails and probability density at the wings as T → 0, permanently neutralizing the short-tenor pricing failure modes that are present in standard models.
What makes this framework interesting for derivatives desks is its parametric efficiency and backtest results. The entire option smile is generated from a single empirical parameter—the crossing asymmetry ratio (ϕ = N⁺/N⁻)—rolled forward from underlying asset data without ever looking at external options markets or implied vol fitting. In an extensive Calendar Year 2025 backtest using 93,449 SPY minute bars, the Skellam pricer achieved an overall mean error of effectively zero (-$0.02) and a tight mean absolute error of just $1.87 across 655 in-the-money expiries. The structural vol skew emerges organically from directional crossing imbalances, completely bypassing sometimes the messy, hand-fitted calibration of the past.
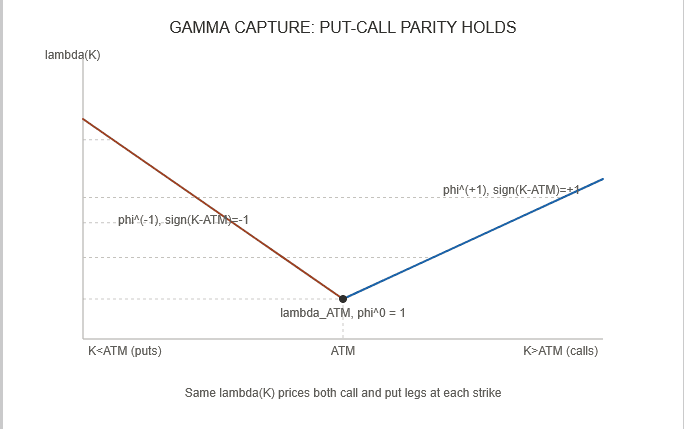
Ultimately, this framework shows that the options grid is the real-world validation of underlying market microstructure, demonstrating that the volatility smile is just a natural geometric projection of directional path asymmetry. Because the exact same intensity parameter prices both call and put legs at each individual strike, the model ensures that ensemble methods of tracking order book imbalances seamlessly preserve put-call parity without synthetic distortions. Deployed live on platforms like TradingView and NinjaTrader, the model can deliver analytical leverage for intraday volatility arbitrage.
Authors: Louis Pellathy
Title: From Barrier Crossings to Terminal Distributions: A Skellam-Based Options Pricing Framework for 0-DTE Markets
Link: https://papers.ssrn.com/sol3/papers.cfm?abstract_id=7029658
Abstract:
Prior work established that barrier-crossing frequency is a superior volatility estimator to squared log-returns for 0-DTE index options. This paper extends that framework by replacing the Black-Scholes pricing layer entirely. Rather than feeding a barrier-crossing volatility signal into a lognormal pricing formula, we derive a closed-form pricing model whose terminal distribution is Skellam-the difference of two independent Poisson processes. Each Poisson process represents directional barrier crossings: up-crossings and down-crossings. The resulting pricer generates a full implied volatility surface from a single empirical parameter, the crossing asymmetry ratio φ = N⁺/N⁻, without any options data, implied vol fitting, or smile calibration. A Calendar Year 2025 backtest on SPY 0-DTE options using minute data confirms that the Skellam pricer achieves nearzero mean error across 655 ITM expiries (excluding two black-swan days), with mean absolute error of $1.87. The vol skew emerges structurally from φ. Black-Scholes machinery is entirely replaced by a discrete probability distribution. While academic peer review is useful, options market making is the real-life proof that the Gamma Capture framework works.
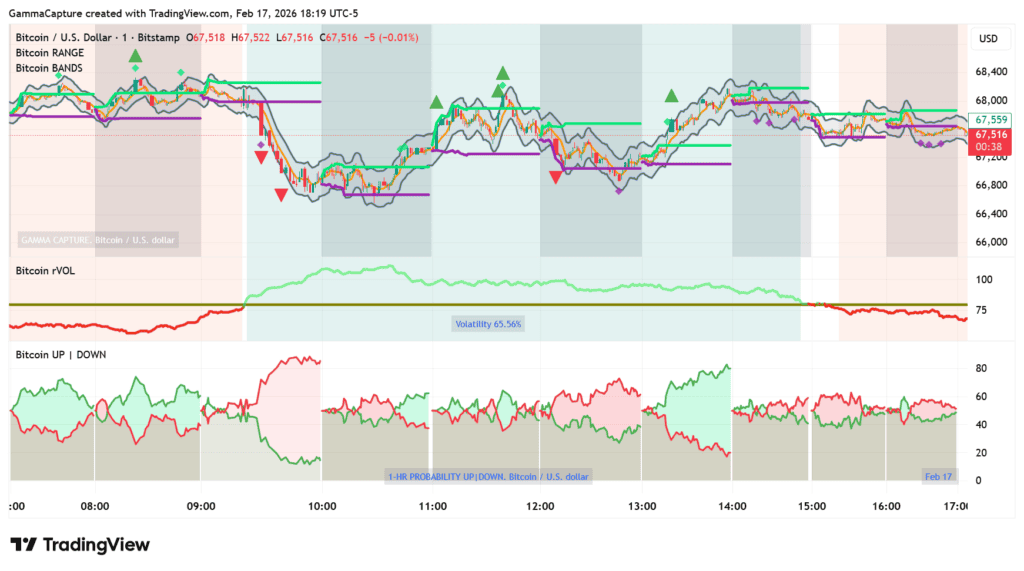
As always, we present several interesting figures and tables:


Notable quotations from the academic research paper:
“The zero-days-to-expiry (0-DTE) options market has grown to dominate index options volume, exceeding $1.2 trillion in daily notional on SPY alone as of May 2025. This growth has exposed a structural deficiency in the dominant pricing framework. Black-Scholes assumes price evolves according to Geometric Brownian Motion (GBM), a continuous diffusion process with lognormally distributed returns. As time-to-expiry approaches zero, the Black-Scholes formula collapses to a point mass at the current price, producing systematically wrong option values precisely when the market is most active.
This paper removes Black-Scholes entirely. The terminal price distribution is not assumed to be lognormal. Instead, it is derived directly from the Poisson crossing process: the terminal net displacement is the difference of two independent Poisson counts, a Skellam distribution. The Skellam distribution has fat tails relative to the Gaussian, retains probability mass at the wings as T → 0, and generates a structural vol skew through the crossing asymmetry ratio φ. The result is a framework grounded in observable microstructure rather than statistical assumptions
[Authors] have presented a complete options pricing framework built on the Poisson barrier-crossing process, with no Black-Scholes machinery retained. The terminal distribution is Skellam. The vol surface is structural. The calibration requires no options data. A 2025 SPY backtest confirms near- zero mean error across 655 ITM expiries.
The framework is currently in production on NinjaTrader and TradingView as the Gamma Capture indicator suite. Institutional applications include intraday vol arb (identifying mispriced wings from the structural surface), execution algo integration, and extension to crypto and energy options where lognormality assumptions are most severely violated.”
Are you looking for more strategies to read about? Sign up for our newsletter or visit our Blog or Screener.
Do you want to learn more about Quantpedia Premium service? Check how Quantpedia works, our mission and Premium pricing offer.
Do you want to learn more about Quantpedia Pro service? Check its description, watch videos, review reporting capabilities and visit our pricing offer.
Do you want algorithmic access to the full Quantpedia database via the API? Subscribe to Quantpedia Pro, ask for an API key, and explore the in/out-of-sample statistics, source academic papers, and code snippets — ideal for quantitative research, systematic trading workflows, and AI model training.
Are you looking for historical data or backtesting platforms? Check our list of Algo Trading Discounts.
Or follow us on:
Facebook Group, Facebook Page, Telegram, Twitter, Linkedin, Medium or Youtube
Share onLinkedInTwitterFacebookRefer to a friend