Bitcoin Runs on a Clock: Why Every Price Indicator Dies and the Halving Clock Doesn’t
For anyone trading or investing in Bitcoin, a familiar indicator can become a dangerous comfort blanket. Josh Molnar’s Bitcoin Runs on a Clock argues that classic cycle signals—such as MVRV, the Mayer Multiple and Pi Cycle Top—have weakened as Bitcoin’s price swings become less extreme. Thresholds calibrated to earlier cycles may consequently stop triggering, leaving investors waiting for a sell signal that never arrives. The practical takeaway is that a strong historical record does not make an indicator’s settings permanent. If the market changes, the dashboard needs to change with it.
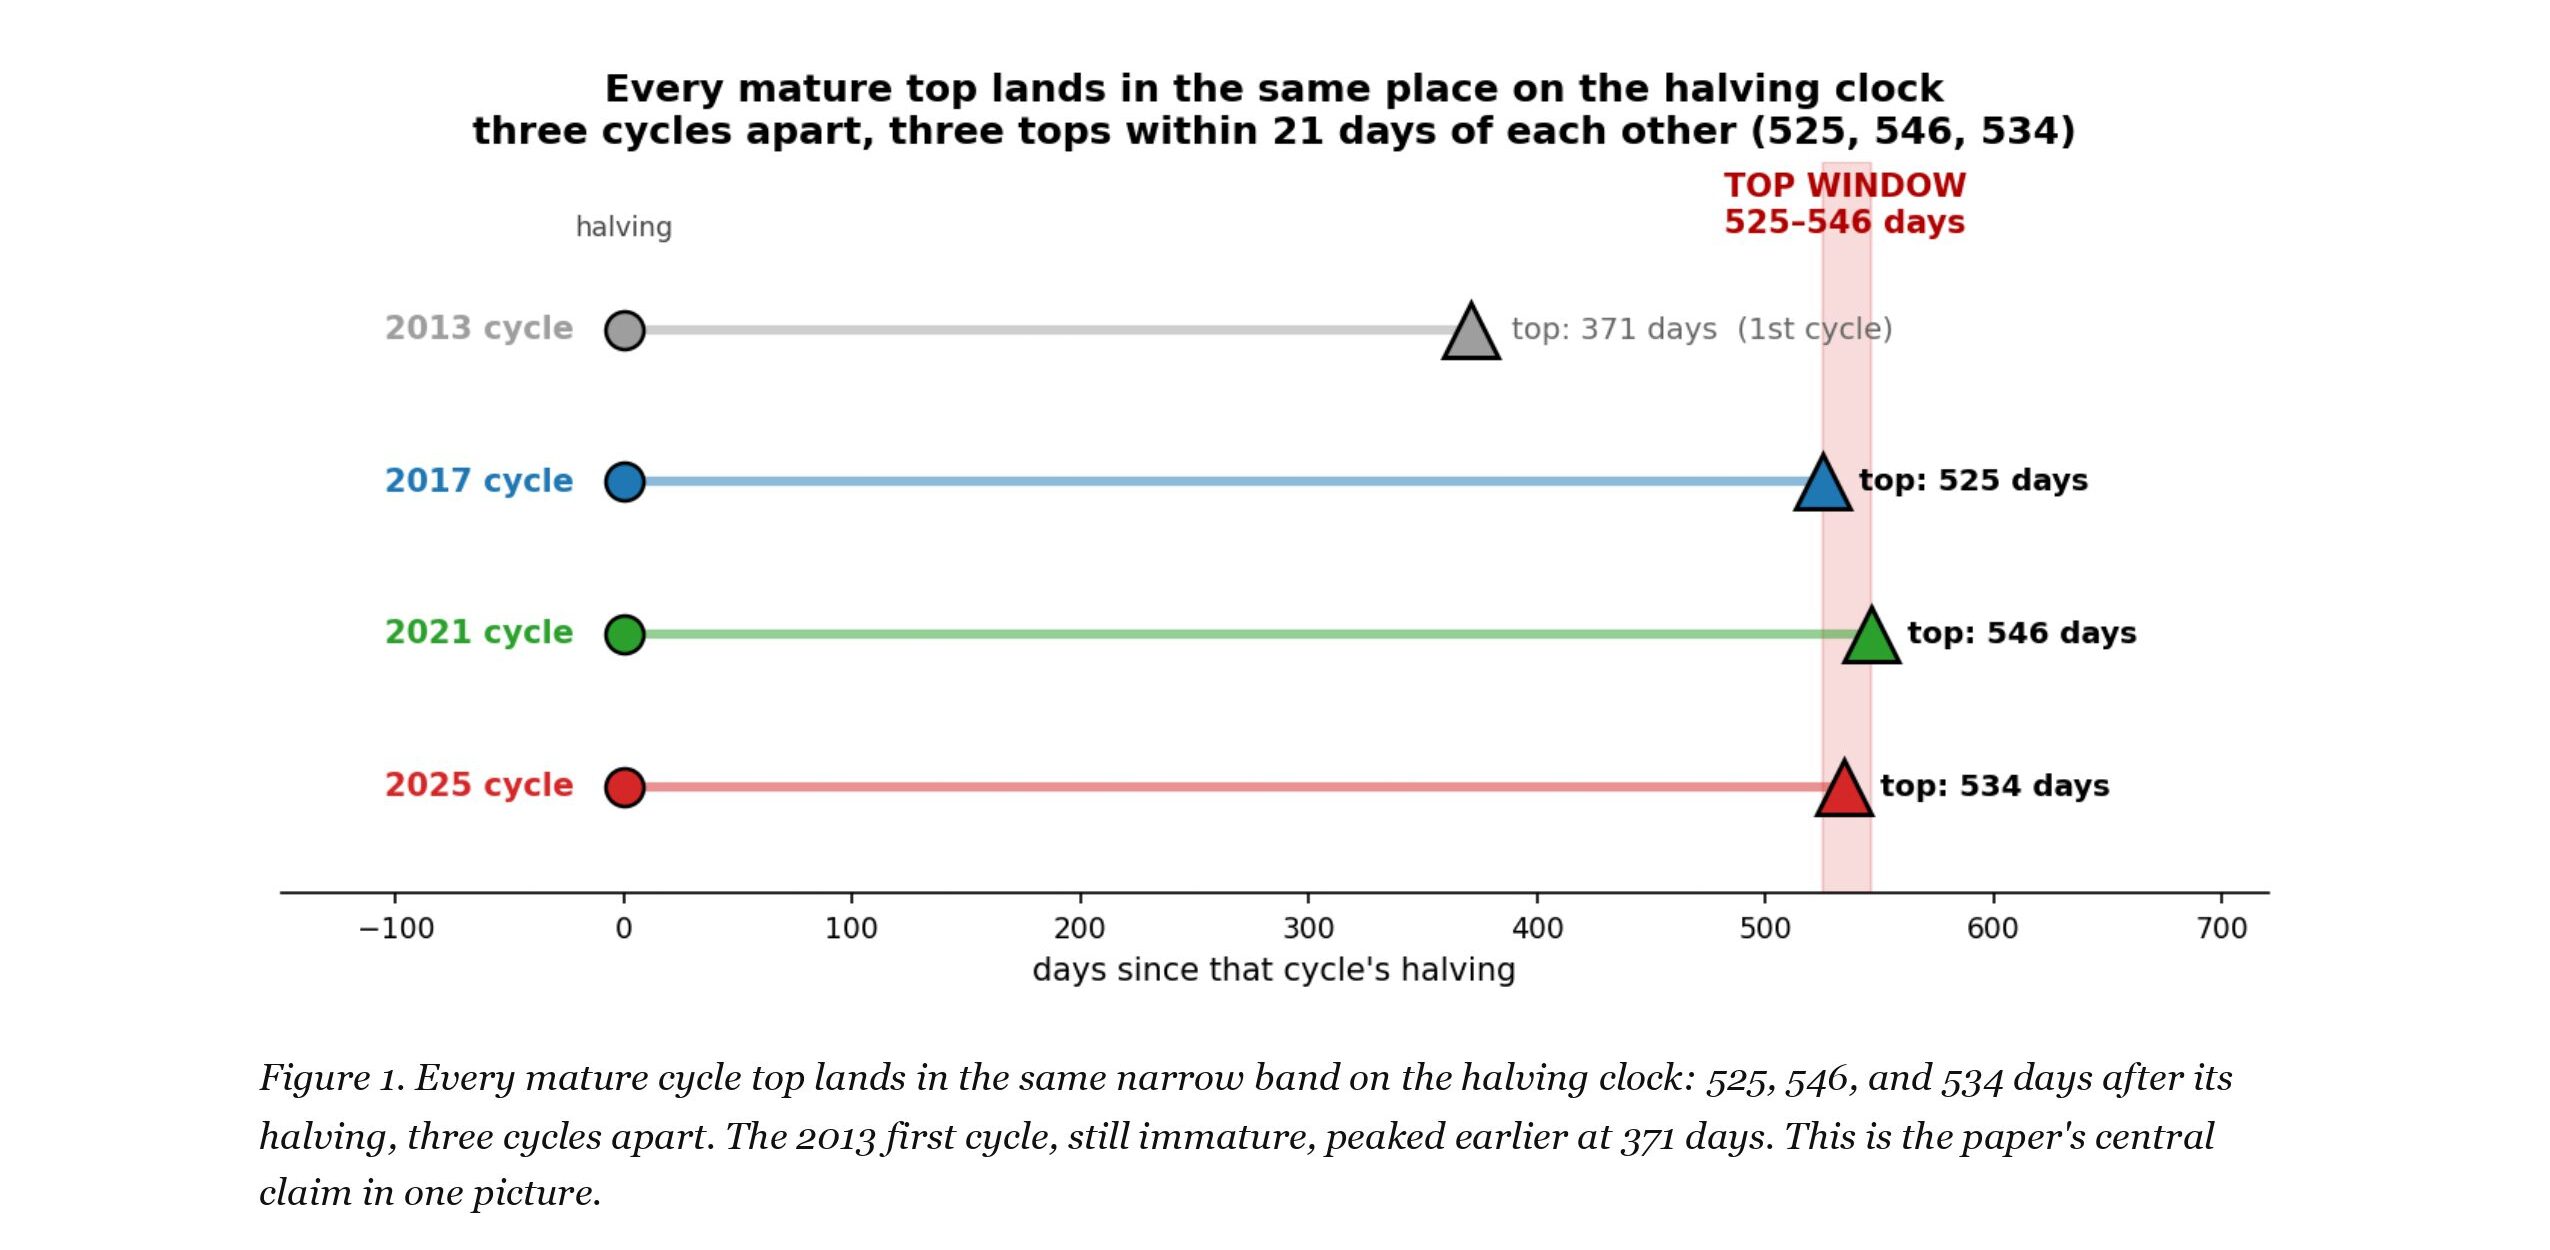
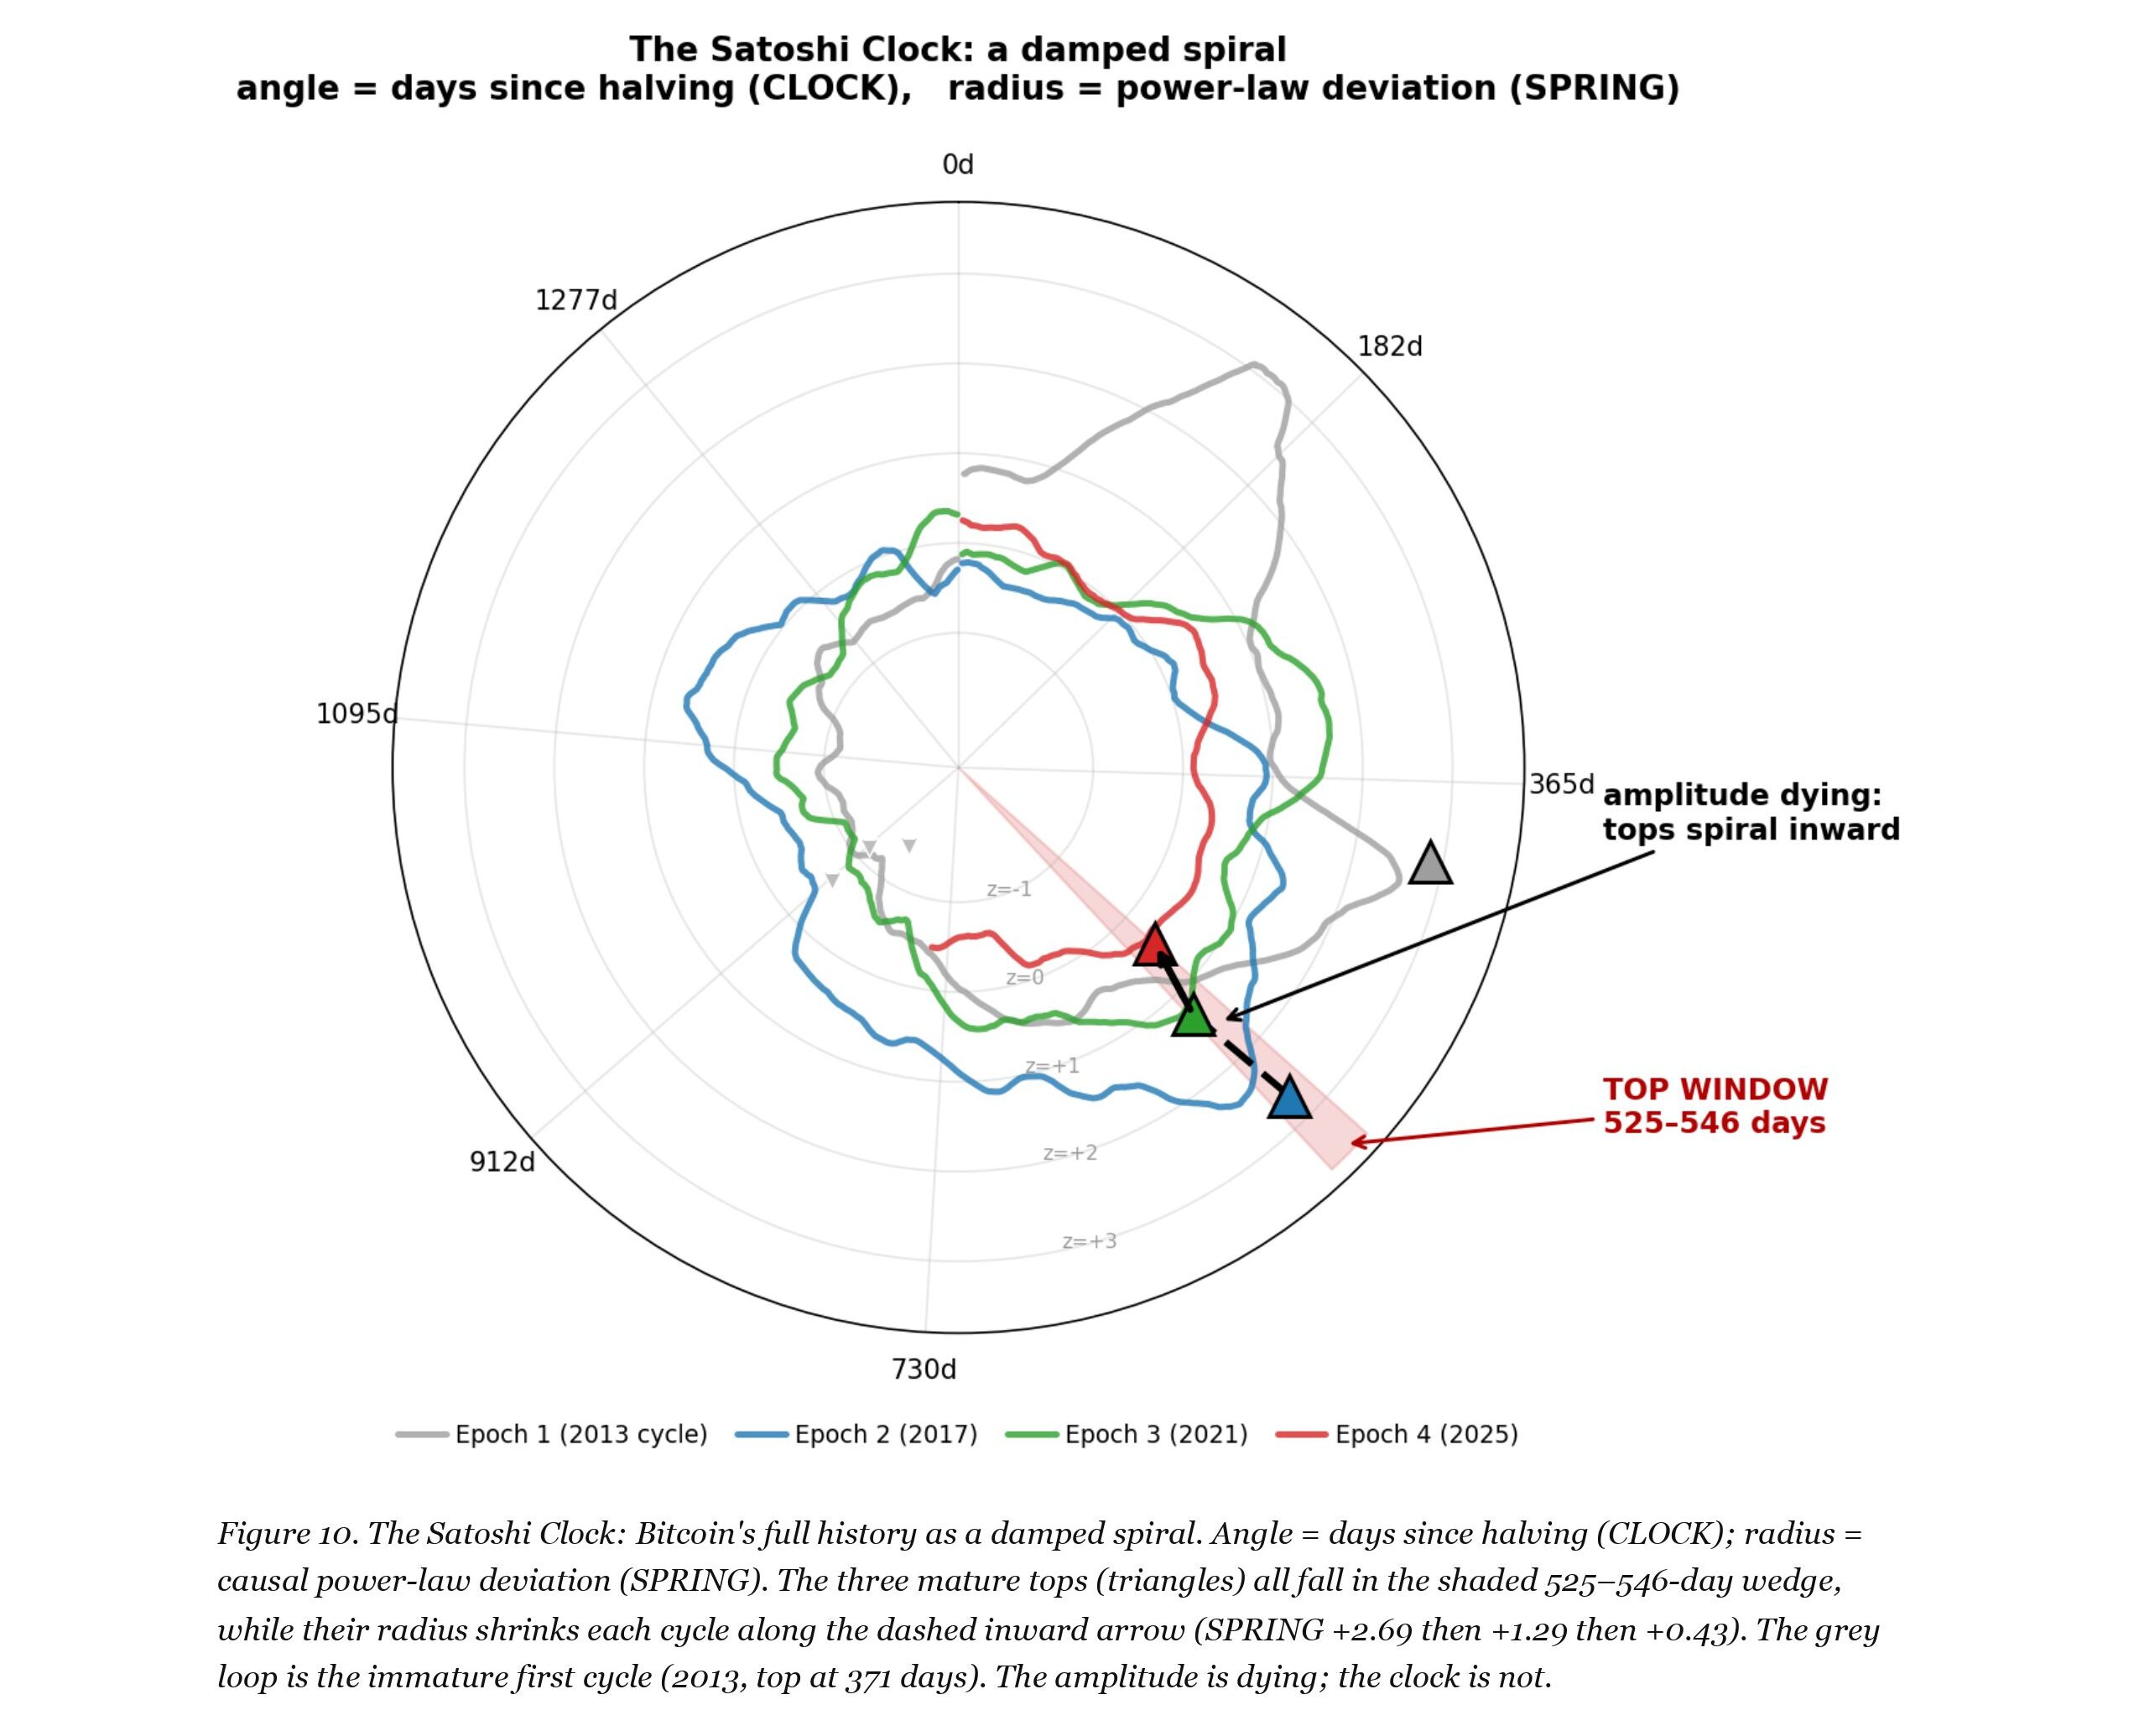
The paper’s alternative is to pay closer attention to time since the halving. It finds that the three mature-cycle tops occurred 525, 546 and 534 days after their respective halvings, despite substantial differences in price performance. From a portfolio perspective, that makes the halving calendar an interesting input into exposure reviews, profit-taking and risk budgets. The author also examines price deviations from a long-term power-law trend, with some encouraging results for drawdown control. The practical implication is to consider cycle timing alongside a measure of how stretched price has become, while keeping position sizing and exit discipline central.
The catch is that three tops are a very small sample, and the paper identifies them retrospectively. Its positive out-of-sample timing result also comes from a single period dominated by a bear market. Those limitations matter more than the headline’s confidence suggests. The paper stakes out prospective tests, including an October 5–November 16, 2026 bottom window and a subsequent top 525–546 days after the next halving. These are hypotheses to track and evaluate. The strongest lesson for practitioners is already useful: regularly challenge trusted indicators, and demand forward evidence before turning an appealing pattern into a trading rule.
Authors: Josh Molnar
Title: Bitcoin Runs on a Clock: Why Every Price Indicator Dies and the Halving Clock Doesn’t
Link: https://papers.ssrn.com/sol3/papers.cfm?abstract_id=6977940
Abstract:
Every widely followed Bitcoin cycle indicator (the Pi Cycle Top, MVRV, the Mayer Multiple, the Puell Multiple, the 200-week moving average) called the market’s tops and bottoms with striking precision for a decade, then degraded in a common sequence: precise, then early, then silent. We show that this is not a series of independent failures but a single structural phenomenon. Using daily data spanning the four halving epochs (2011–2026; the fourth is still in progress), we document three things. First, the per-cycle maxima of the five major top-calling oscillators decline monotonically across all four epochs while their per-cycle minima end the era higher than they began, so any threshold calibrated on past cycles must eventually stop firing. Second, the predictive power of short-horizon price indicators decays toward zero across epochs and in several cases inverts sign. Third, Bitcoin’s time structure remains fixed: the three mature-cycle tops occurred 525, 546, and 534 days after their respective halvings, and the three completed bear-market bottoms 406, 364, and 366 days after their tops.
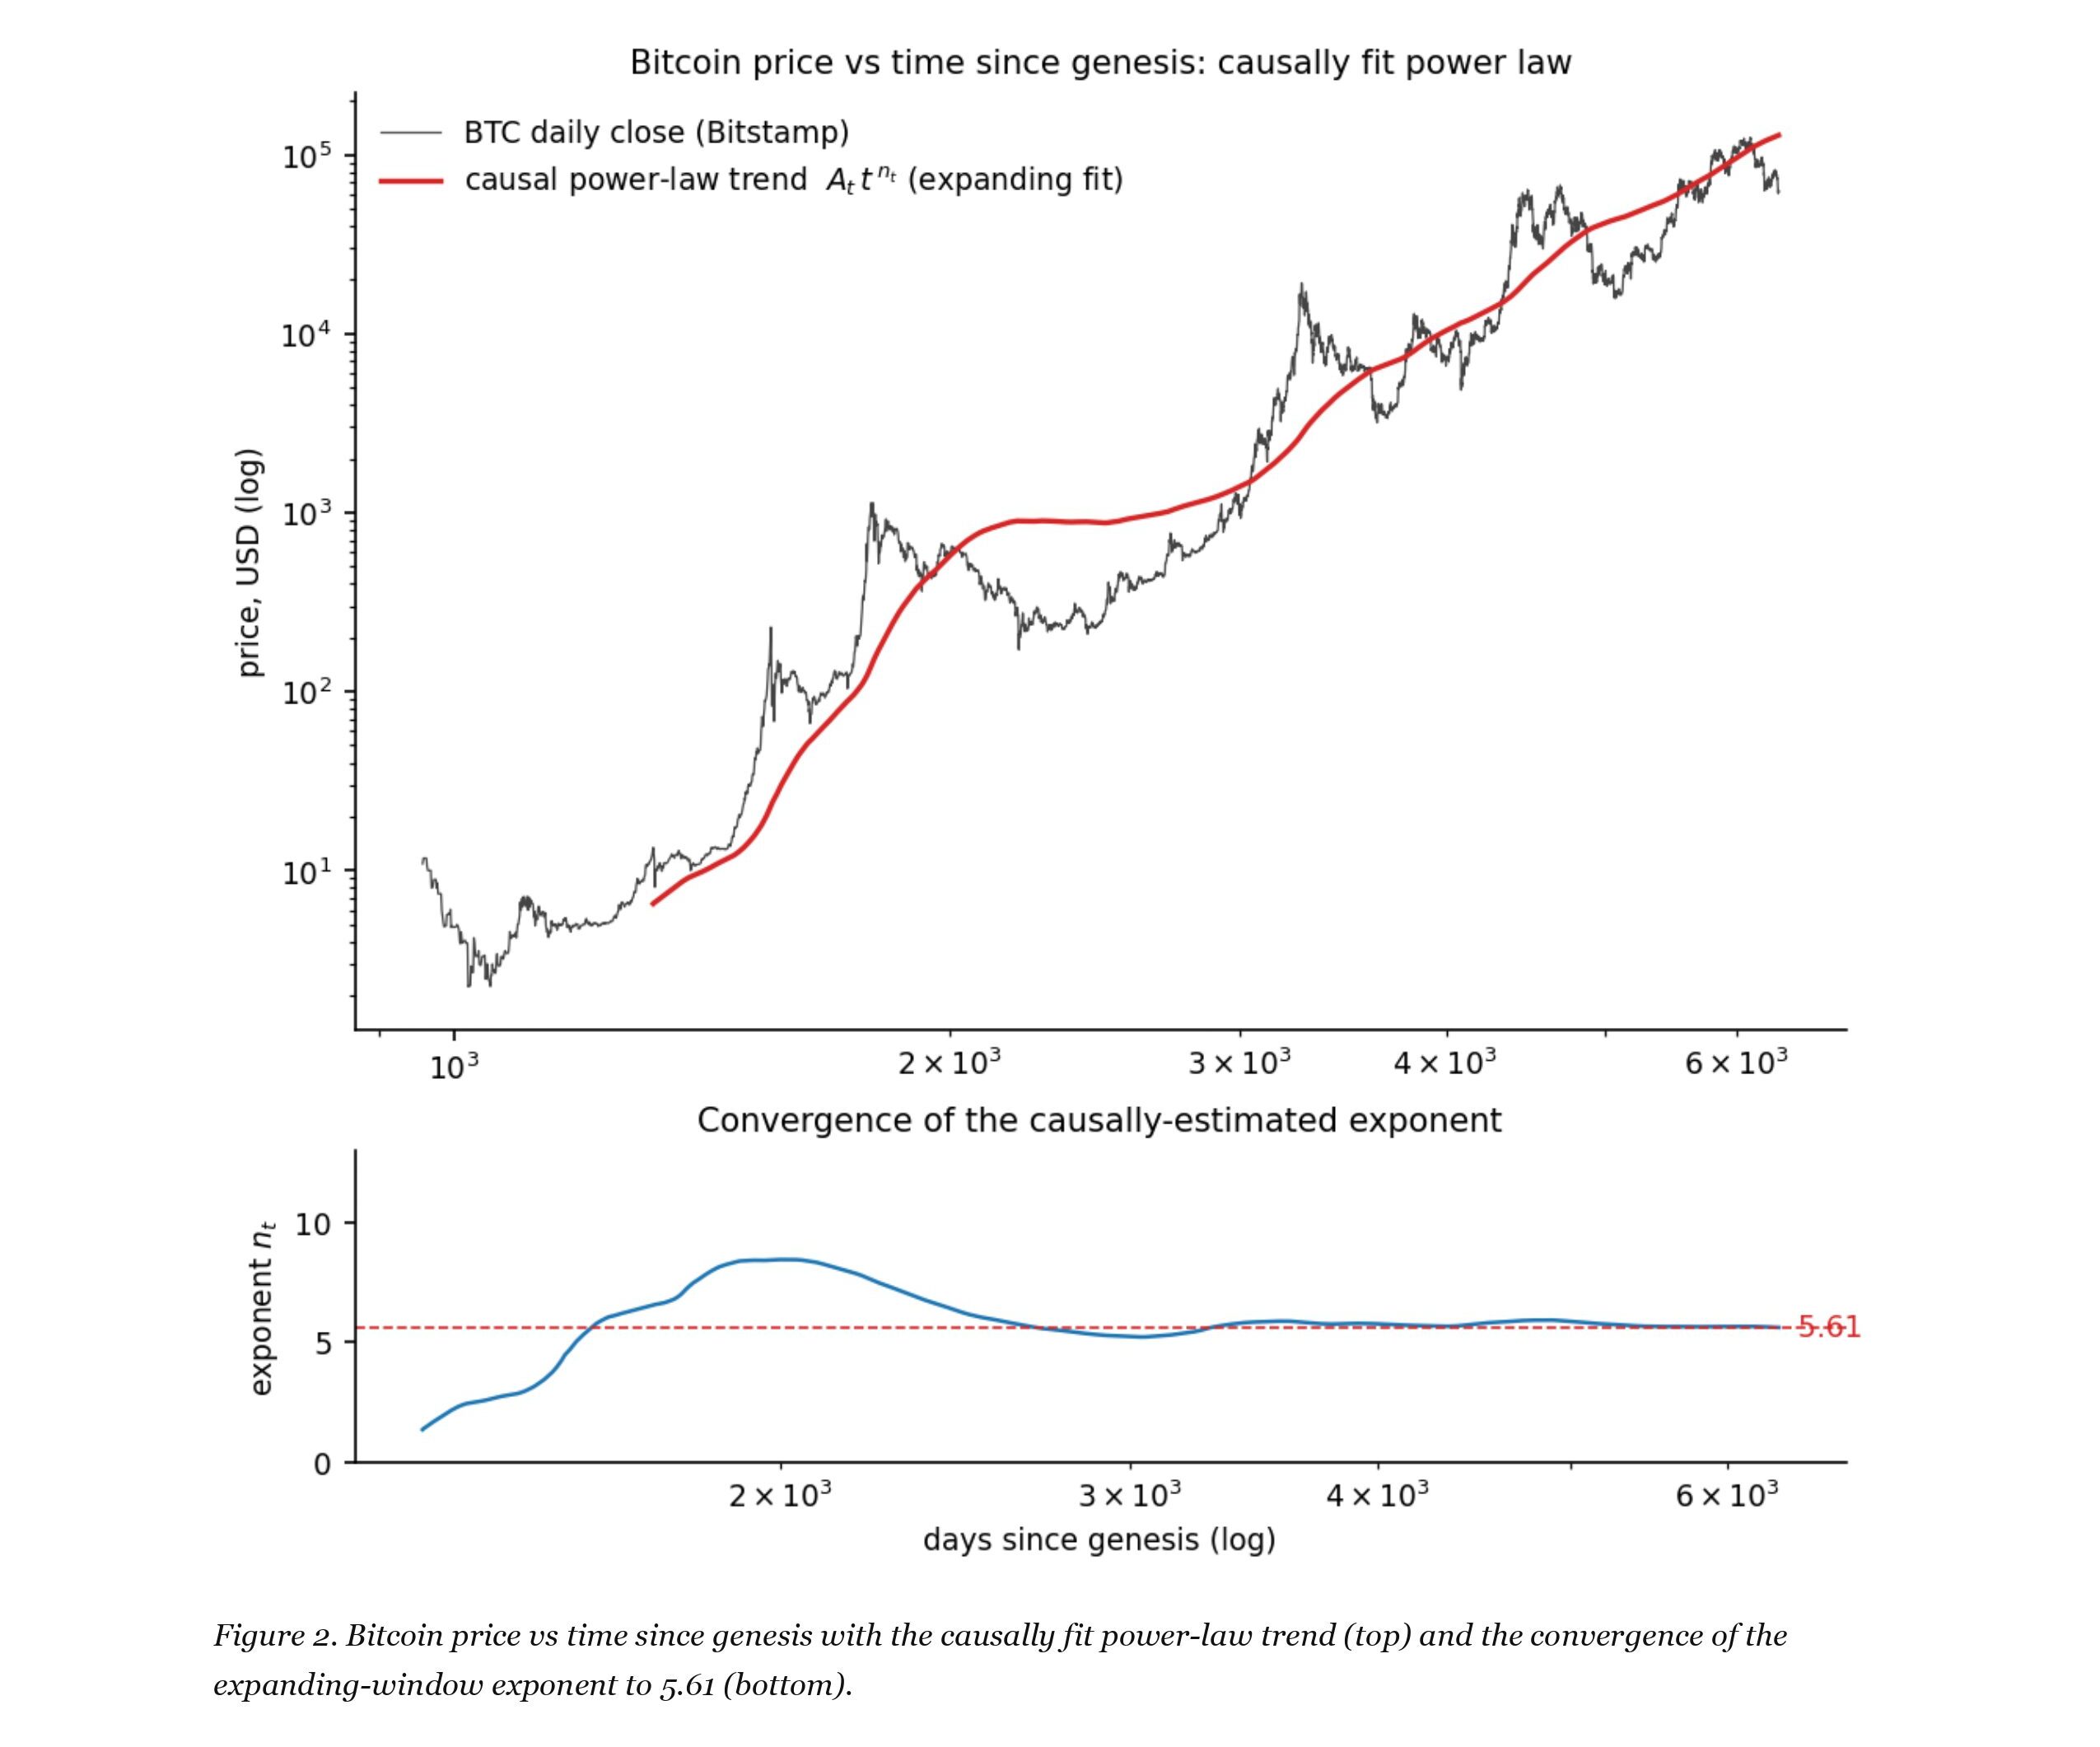
These turns are identified retrospectively by a fixed mechanical rule (an all-time high followed by a ≥45% drawdown), not from a real-time forecasting record. Under uniform timing-free nulls, the joint probability of both clusters ranges from 5×10⁻⁶ to 1×10⁻³ across every window choice and inclusion variant we examine, including the variant least favorable to the claim. A harder empirical null, in which block-bootstrapped Bitcoin return paths are processed by the identical turn rule, never reproduces the top-timing regularity under its deterministic construction (zero of 10,000 paths across five block lengths; a conservative variant that grants the null free selection among candidate tops yields 0.10–0.25%). The same null reveals that the bottom-timing regularity is largely intrinsic to the drawdown process itself, reproduced by 31–43% of null paths: the clock evidence is concentrated in the tops’ halving-phase alignment, and we weight our predictions accordingly. A causally fit power law in time-since-genesis (exponent converging to 5.6) is the only signal in the formal inference battery whose direction is stable across every mature epoch, whose long-horizon relationship replicates on an independent price source and on Ethereum with a different exponent, and whose risk-adjusted timing edge over buy-and-hold improves monotonically across all four cycles, turning positive in the current one (a single-window holdout, suggestive rather than decisive). We deliberately rest none of this on per-epoch significance testing: a dependence-preserving rotation null shows that autocorrelation-robust (HAC) inference over-rejects severely for persistent signals at these sample sizes (empirical size up to 0.33 at nominal 0.05), rendering the apparent two-epoch significance of the power-law cell statistically indistinguishable from chance (empirical p = 0.21). We report this diagnostic in full, because it disqualifies not only our own per-epoch p-values but the entire genre of such claims for persistent indicators in this literature.
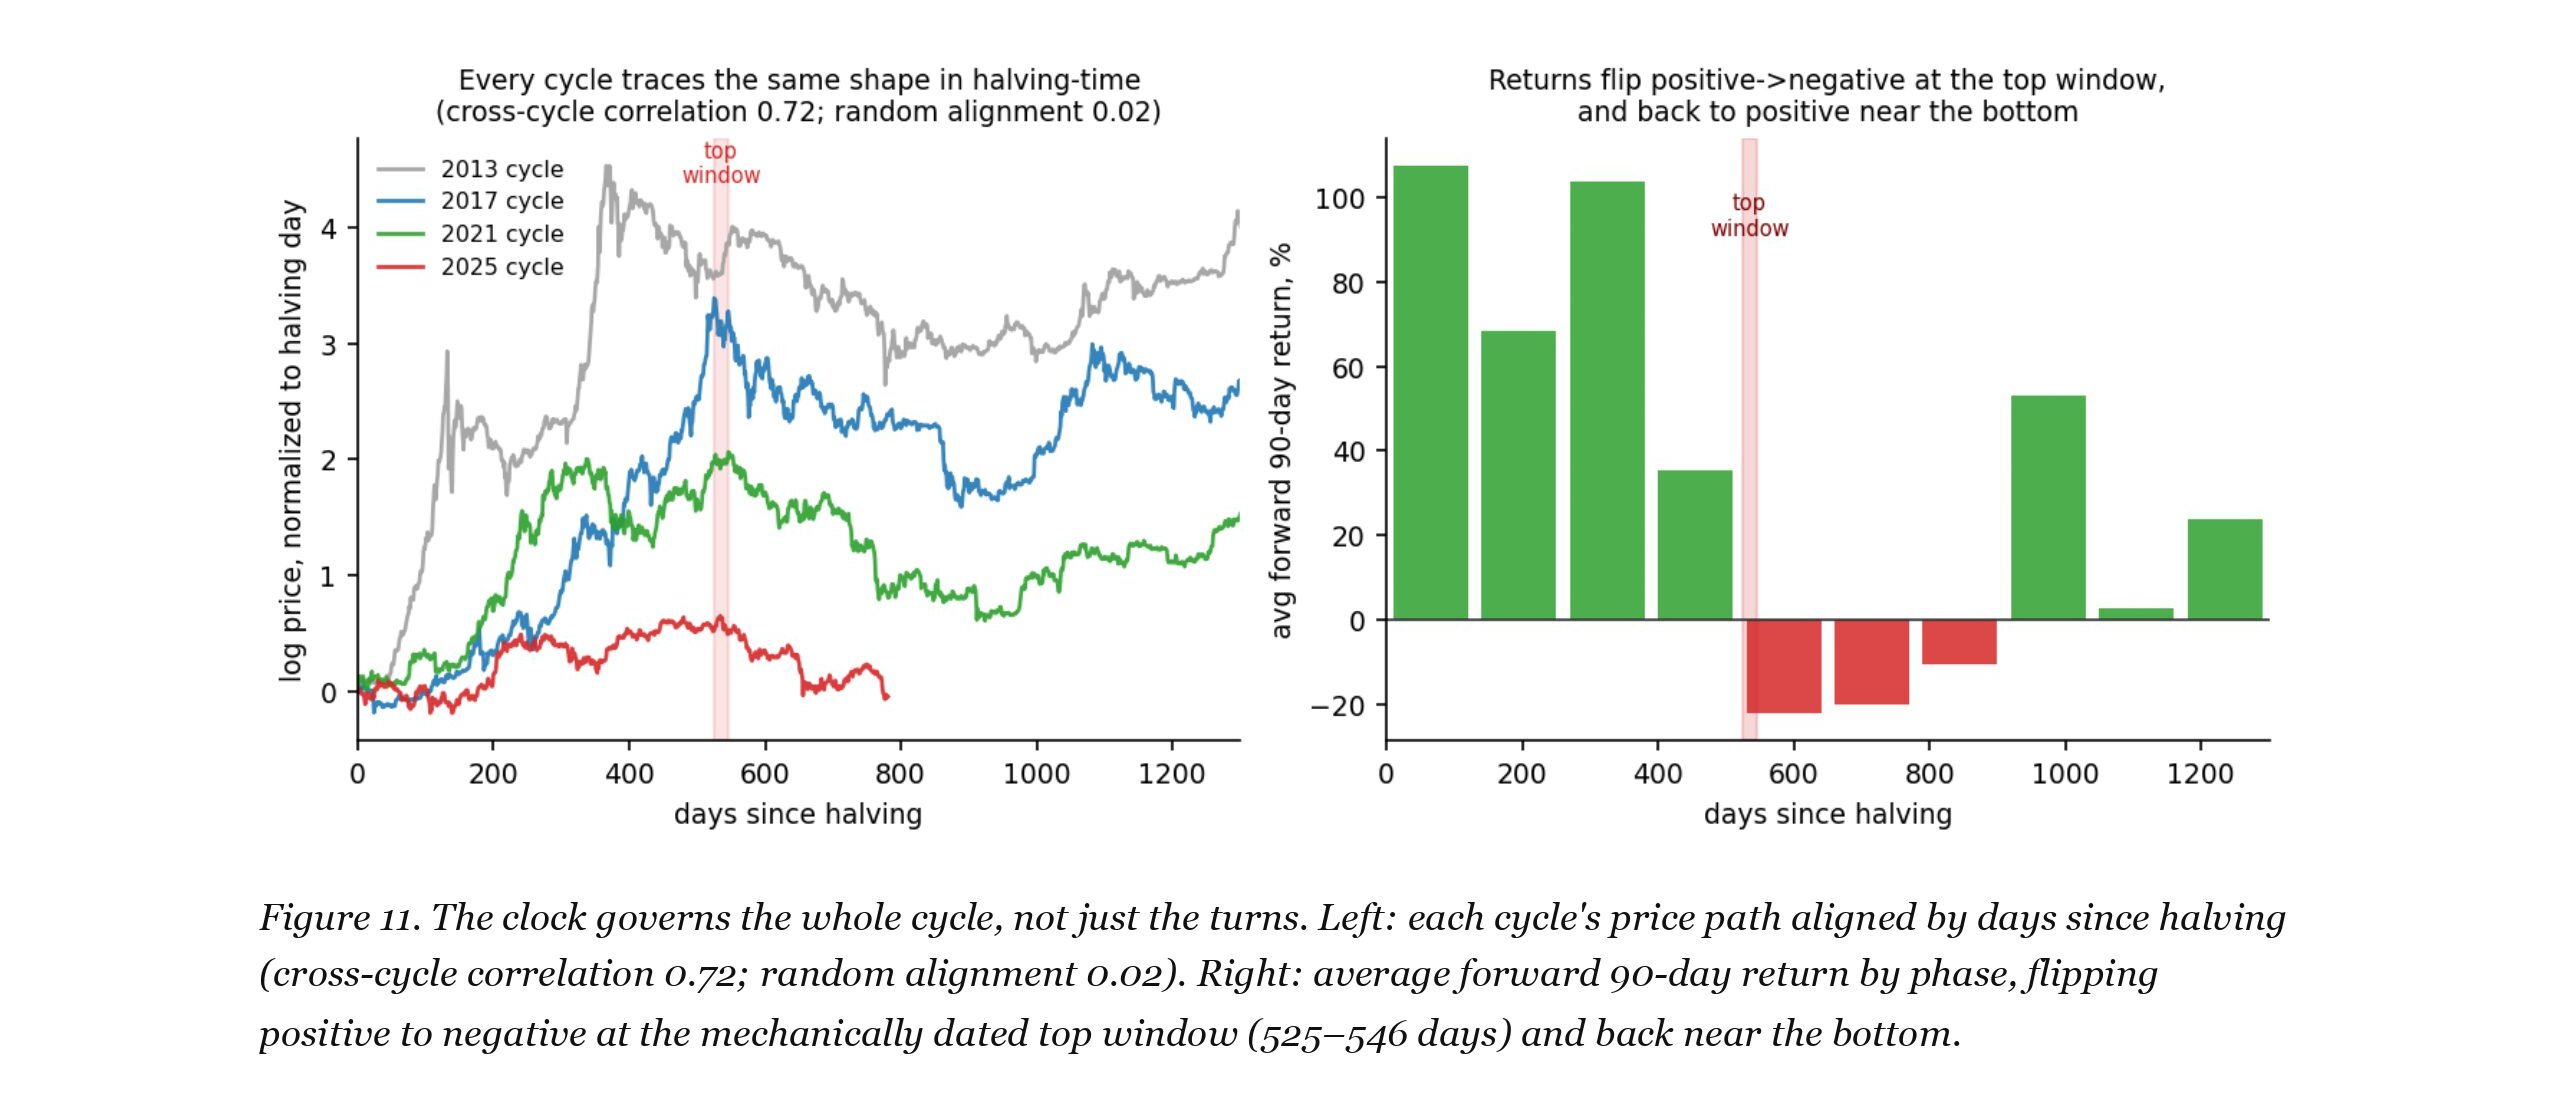
Candidate macro drivers (M2 growth, the yield curve) exhibit the same era-dependent sign instability as the price indicators and are eliminated in a joint horse race; in the 2024–26 episode, liquidity kept expanding while Bitcoin topped on schedule and entered a bear market. The halving clock further outperforms every look-alike four-year cycle we test (the US election cycle, a fixed calendar, and 2,000 random four-year clocks), and the whole boom-bust-recovery path, not just the turns, repeats when cycles are aligned by days since halving. We summarize the asset’s state in two time-anchored coordinates, days since halving and power-law deviation, under which Bitcoin’s history traces a damped spiral: the amplitude is dying, the clock is not. Re-expressing the clock in its native protocol unit, block height rather than calendar days, holds the tops’ null at zero of 10,000 and widens its separation from look-alike clocks, because the halving is an exact 210,000-block period rather than a drifting four-year one; it also recovers partial bottom structure the calendar null misses, though the cycle-shape and volatility overlays do not improve. The framework yields pre-registered, falsifiable predictions: a cycle bottom window of October 5 to November 16, 2026, and a next cycle top window 525 to 546 days after the following halving (provisionally late September to mid-October 2029, pending the halving’s exact date).
As always, we present several interesting figures and tables:
Notable quotations from the academic research paper:
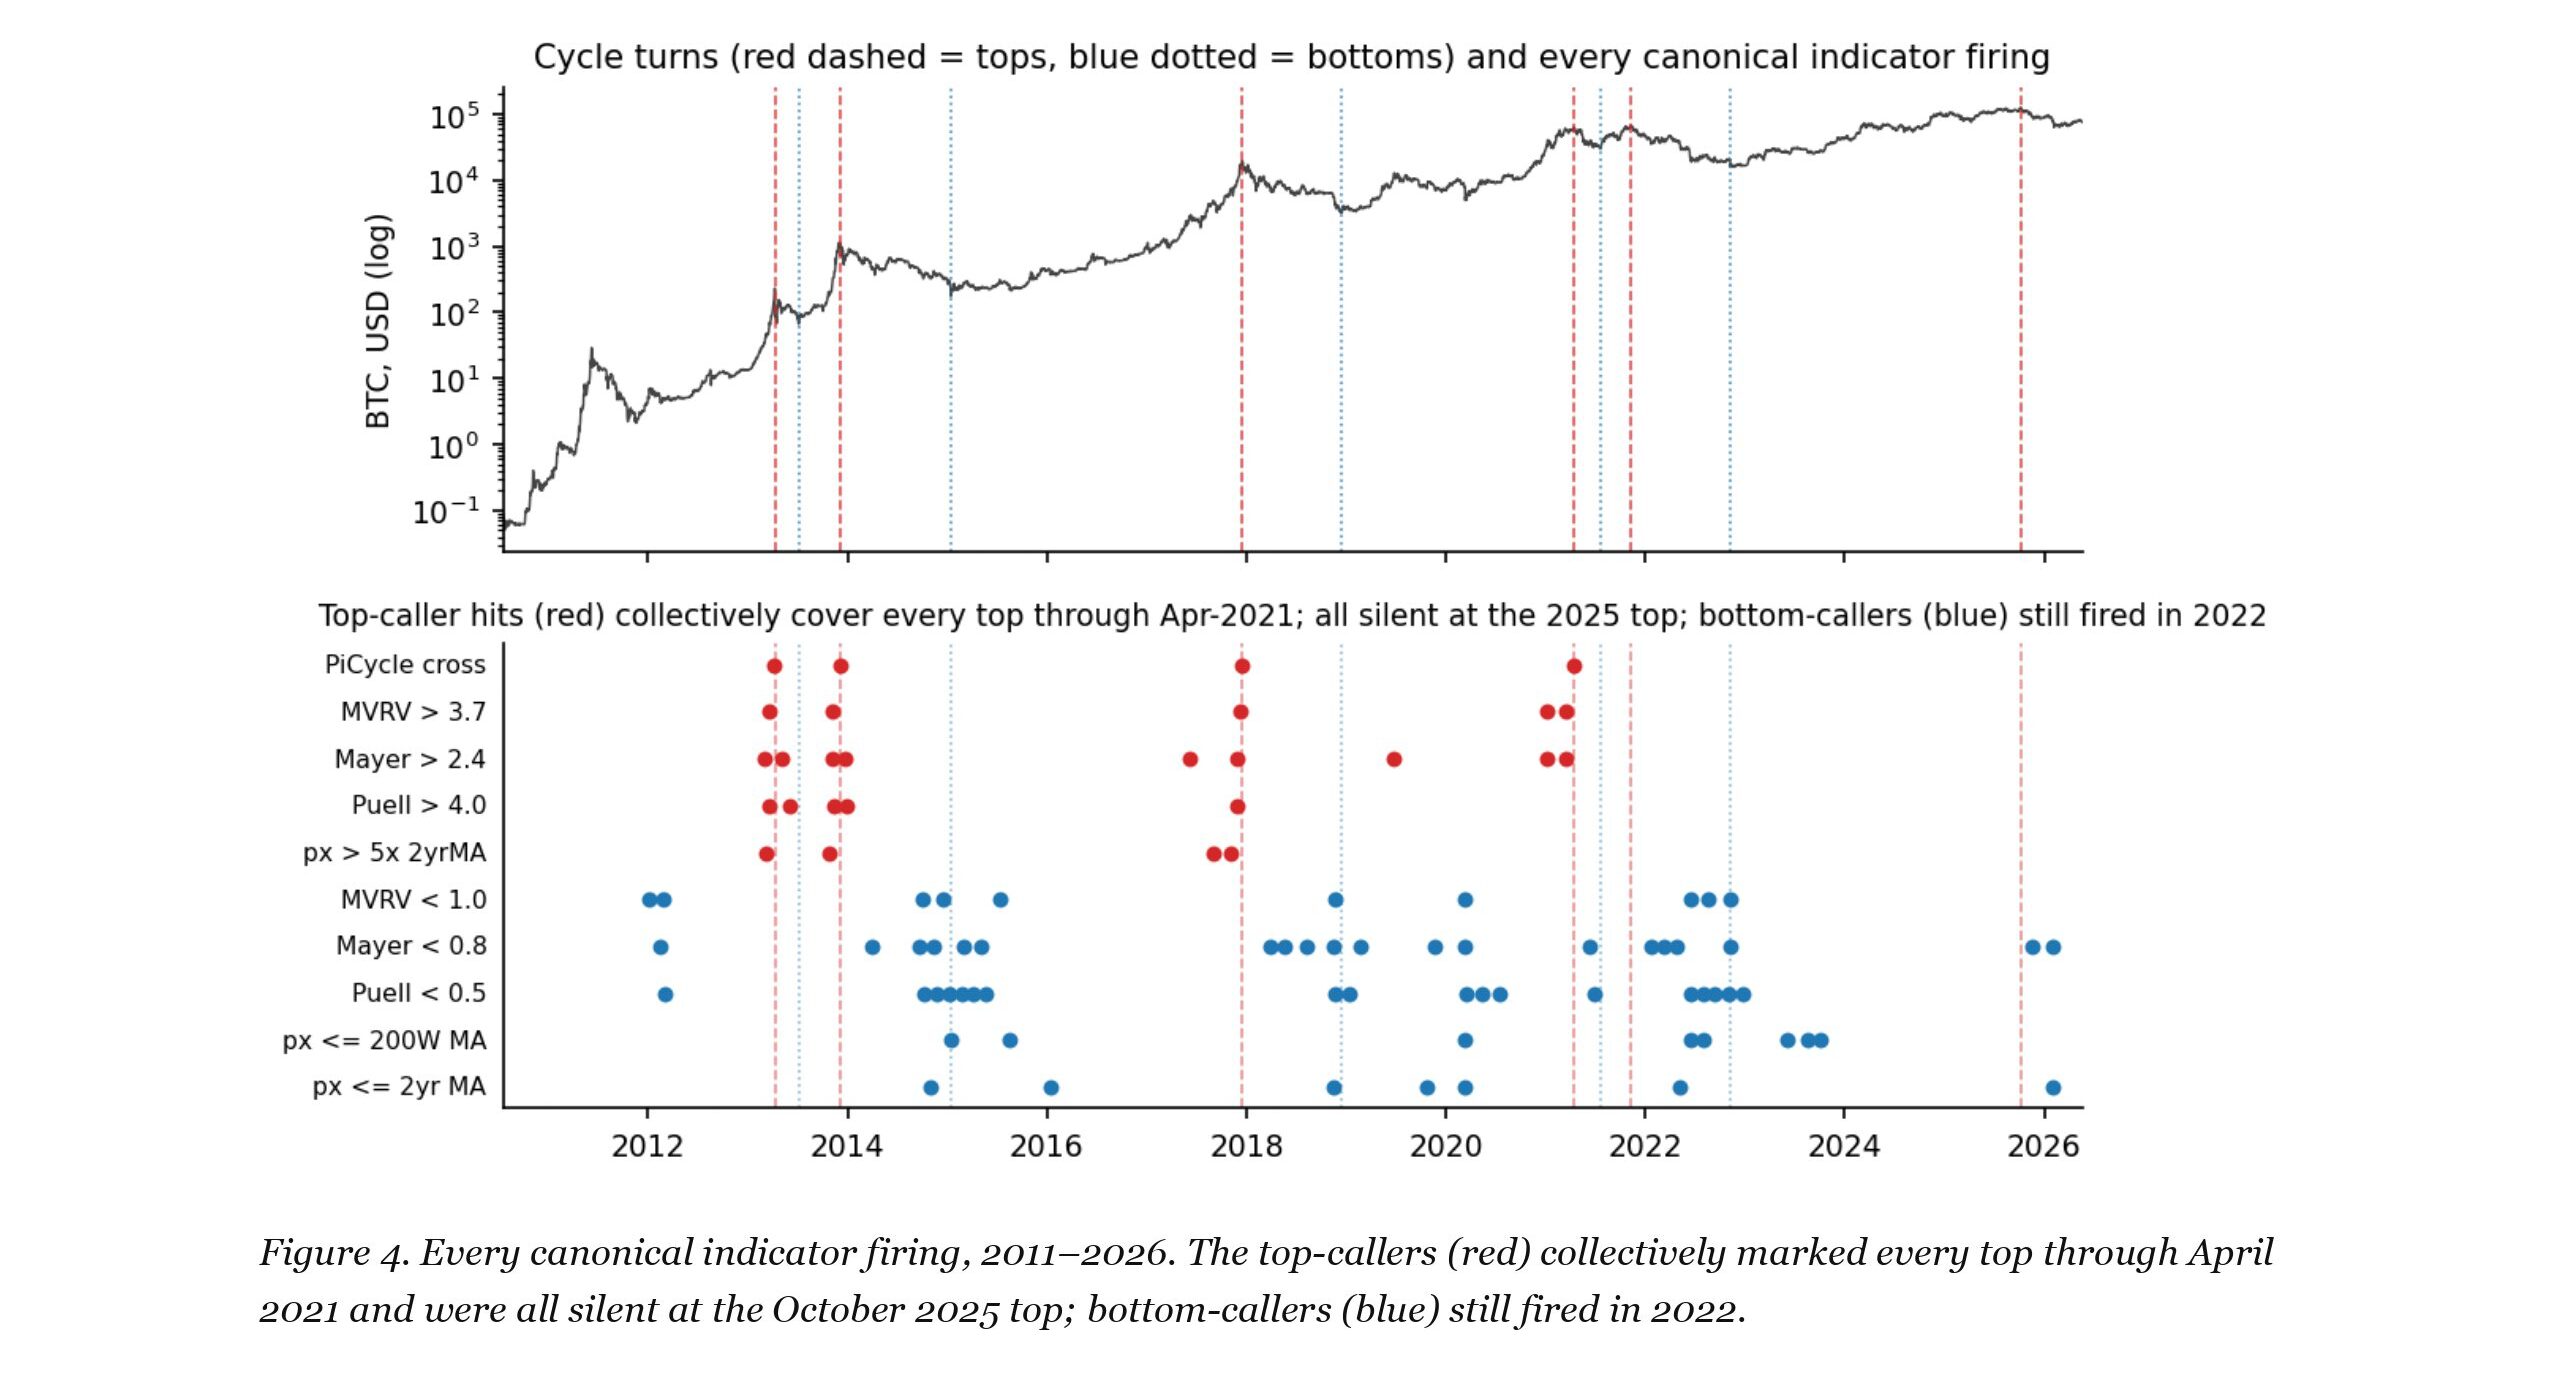
“The question is motivated by an empirical puzzle. Over Bitcoin’s first decade, a family of price-anchored and on-chain indicators earned reputations as infallible cycle-callers. The Pi Cycle Top indicator marked the December 2013 top to within one day, the December 2017 top to the day, and the April 2021 peak to within one day. MVRV above 3.7 and the Mayer Multiple above 2.4 flagged every major top from 2013 through early 2021 within a month; the Puell Multiple above 4.0 flagged every top through 2017. On the other side, MVRV below 1.0 and the Puell Multiple below 0.5 marked the 2015, 2018, and 2022 bottoms within four weeks. These records were earned out of sample, in real time, across multiple cycles. They were not curve-fit artifacts.
Then, at the October 2025 cycle top, the largest in Bitcoin’s history by price, not a single one of them fired. An investor relying on the indicators that had “never missed” received no warning at all. Yet the top itself arrived almost exactly where Bitcoin’s previous two mature cycles would have put it: 534 days after the April 2024 halving, against 525 days in 2017 and 546 days in 2021. Three cycles apart, the mature tops land within 21 days of one another when measured on the halving clock (Figure 1).
We argue that these two facts, the simultaneous silence of every price-anchored indicator and the punctuality of the turn in halving-time, are the same fact viewed from two sides. Together they identify Bitcoin’s market cycle as a damped oscillation on a fixed clock. Each cycle, the oscillation’s amplitude shrinks: we show that the per-cycle maximum of every major oscillator declines monotonically across all four epochs (MVRV cycle peaks of 5.88 → 4.72 → 3.96 → 2.74, for example), while per-cycle minima end the era higher than they began. Range compression mechanically silences any fixed threshold calibrated on earlier cycles. “It never missed before” described a shrinking range, not a reliable indicator. The period, by contrast, does not move: in time-since-halving coordinates, the turns cluster within ±2%.
Every price-anchored description of Bitcoin’s market cycle is dying, in a measured, monotone, mechanistically explicable way: the oscillation’s amplitude compresses every cycle, so thresholds go silent in order of aggressiveness and continuous indicators decay toward noise or invert. The macro alternatives behave no better, flipping sign era to era and failing a joint test against the calendar. What remains is the one structure that was never estimated from price at all, because it was never estimated from anything: a constant written into the protocol at block zero and announced by its author in January 2009 as “the amount cut in half every 4 years.” In the coordinates of that clock, the asset’s history is a damped spiral, with turns at 525–546 days after each halving and 364–406 days after each top, a retrospective regularity whose chance probability ranges from 5×10⁻⁶ to 1×10⁻³ across every timing-free null and construction we tested against it, including a 2025 top that arrived on schedule while every famous indicator was silent and global liquidity argued the other way. The amplitude is dying; the clock is not. Bitcoin, at the end of the day, is code. On the evidence assembled here, it keeps its own time.”
Are you looking for more strategies to read about? Sign up for our newsletter or visit our Blog or Screener.
Do you want to learn more about Quantpedia Premium service? Check how Quantpedia works, our mission and Premium pricing offer.
Do you want to learn more about Quantpedia Pro service? Check its description, watch videos, review reporting capabilities and visit our pricing offer.
Do you want algorithmic access to the full Quantpedia database via the API? Subscribe to Quantpedia Pro, ask for an API key, and explore the in/out-of-sample statistics, source academic papers, and code snippets — ideal for quantitative research, systematic trading workflows, and AI model training.
Are you looking for historical data or backtesting platforms? Check our list of Algo Trading Discounts.
Or follow us on:
Facebook Group, Facebook Page, Telegram, Twitter, Linkedin, Medium or Youtube
Share onLinkedInTwitterFacebookRefer to a friend