Trading the Multi-Asset Drift Around U.S. Elections
We analyze a multi-asset calendar anomaly around U.S. federal elections that is consistent across assets and simple to trade. While our previous study documents a robust pre-election drift, the cross-asset pricing of its D+1 resolution remains unmapped beyond SPY. Using a diversified ETF basket spanning technology, emerging markets, real estate, high-yield credit, gold, oil, and foreign exchange, we show that election day itself is neutral to slightly positive — an equal-weight D0 long earns a modest 1.03% p.a. at a Sharpe of 0.19, which we document as the control arm of the experiment but do not trade — while the following session delivers a systematic sell-off across all seven legs as the political uncertainty premium collapses. An equal-weight short on D+1 yields 1.86% per annum with a Sharpe of 0.31 and a maximum drawdown of -4.16%, achieved over 13 trading days in 26 years. Intermediate Treasuries exhibit the inverse pattern, selling off in the four days before the vote and rallying from D0 to D+2, with a Sharpe of 0.48.
1. Introduction
U.S. federal elections have fixed dates and re-price fiscal, regulatory, trade, and geopolitical expectations in real time. While the pre-election drift in equities has been documented, the cross-asset dynamics of uncertainty resolution remain underexplored beyond the S&P 500. This paper shows that the premium built before the vote expires the morning after. Risk assets decline together, duration recovers, and a rules-based trade captures the move without forecasting party outcomes. We label this the post-election volatility vacuum.
2. Theoretical Background and Literature Review
The trade rests on two documented facts. Goodell and Vähämaa (2013) establish the build-up: across U.S. presidential cycles from 1992 to 2008, VIX rose with the probability of the eventual winner — political anxiety bought in advance, priced in volatility points rather than votes.
Chan and Marsh (2021) widen the tape: U.S. midterm elections command at least the same asset-pricing premium, with equity premiums averaging 15.41% annualized in post-midterm months against 2.98% elsewhere, and Treasury premiums lower as uncertainty clears. Both studies run on monthly clocks.
3. Motivation and Contribution
Vojtko and Cisár (2020) show U.S. equities drift up about 2.5% in the six days into Election Day, turning $10k into $22.5k over 210 days from 1950-2018. That established calendar alpha can exist despite low frequency. We extend from a single index to a multi-asset universe, and from accumulation to resolution.
4. Data and Methodology
4.1 Data Description: Investment Universe and Sample Construction (XLK Inception Cutoff: 1998-12-16): To ensure a consistent modern ETF era, we impose a hard cutoff at XLK inception on December 16, 1998; no observation before this date enters the sample. Effective sample per asset depends on its own inception:
- XLK – Tech – 1998-12-16 [cutoff]
- SPY – S&P 500 – 1993-01-22 (truncated to XLK start)
- IYR – Real Estate – 2000-06-12
- IEF – 7-10Y Treasuries – 2002-07-22
- EEM – Emerging Markets – 2003-04-07
- GLD – Gold – 2004-11-18
- USO – Oil – 2006-04-10
- HYG – High Yield – 2007-04-04
- UDN – Bear Dollar – 2007-02-20
Spreads XLK-SPY, EEM-SPY, IYR-SPY isolate idiosyncratic election beta. HYG, GLD, USO, UDN used in absolute terms. The full 7-asset basket is only live from 2008-11-04 onward (when HYG/USO/UDN all exist).
4.2 Event Sample: U.S. Federal Elections (2000-2024): We analyze all 13 U.S. federal elections occurring post-XLK inception (1998), covering both presidential and midterm cycles from 2000 to 2024:
- 2000-11-07 – Presidential
- 2002-11-05 – Midterm
- 2004-11-02 – Presidential
- 2006-11-07 – Midterm
- 2008-11-04 – Presidential
- 2010-11-02 – Midterm
- 2012-11-06 – Presidential
- 2014-11-04 – Midterm
- 2016-11-08 – Presidential
- 2018-11-06 – Midterm
- 2020-11-03 – Presidential
- 2022-11-08 – Midterm
- 2024-11-05 – Presidential
13 elections total; 9 with full multi-asset coverage (2008-2024).
4.3 Event Study Methodology: Simple, no look-ahead, no fancy filters. Each election = one observation.
- D-1 = close-to-close D-2 -> D-1.
- D0 = Election Day.
- D+1 = close-to-close D0 -> D+1.
5. Assumptions and Hypotheses Testing and Development
The post-election window exhibits a universal reversal of the political uncertainty premium. Risk assets — XLK-SPY, EEM-SPY, IYR-SPY, HYG, GLD, USO, UDN — post neutral to slightly positive returns on D0 while the premium remains embedded (the long-side mirror compounds to ~1% p.a. with a Sharpe under 0.2: a positive carry, not a trade), and negative returns on D+1 as the premium collapses. Intermediate Treasuries (IEF) post the inverse rotation: negative D-4 to D-1 as term premia expand, positive D0 to D+2 as term premia normalize.
Investors pay a steep premium for political flood insurance into the vote, then shred the policy at the opening bell on D+1. You don’t predict who wins; you just cash in on the expiring policy. No partisan bet — just premium decay on a statutory calendar.
6. Empirical Results and Portfolio Performances
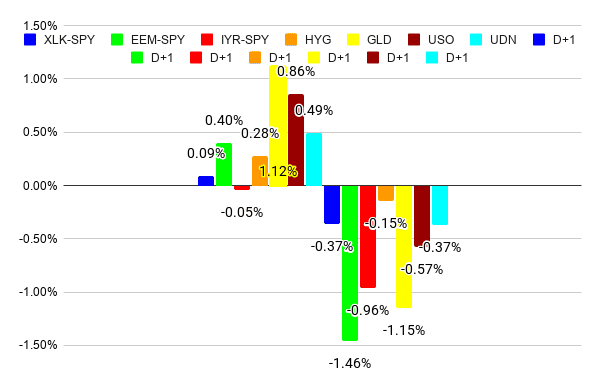
6.1 Main Result — D0 versus D+1 Reversal: Figure 1 shows the return distribution on D0 versus D+1 for the multi-asset basket. D0 clusters near zero with a modest positive bias, while D+1 shifts left across all legs, indicating broad premium liquidation once results are known. The pattern is consistent across assets and cycles and is not driven by outliers.
D0 neutral, D+1 negative — premium expiry across the board.
6.2 Robustness Checks — Individual Legs and Combined Portfolios: Figure 2 shows cumulative performance from shorting each asset individually on D+1. All seven legs contribute positively, with outliers in emerging markets and real estate spreads, along with gold, driving the result.
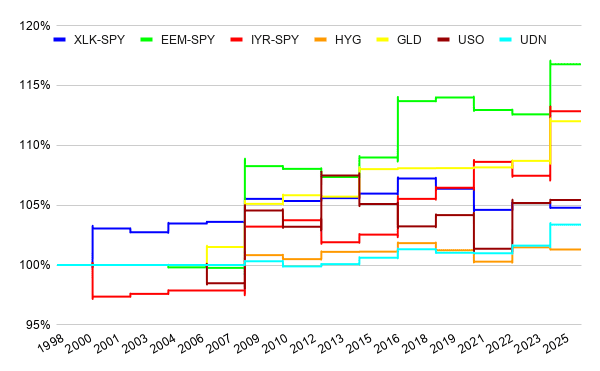
Flipping the trade — long the same basket on D0 for one session — prints 1.03% p.a., Sharpe 0.19, MaxDD −5.83%: crisis hedges (GLD, USO, UDN) carry all the drift, equity spreads hover at zero, and November 2008 delivers most of the curve’s equity in a single day (Figure 3, Table 1). Real but thin, t ≈ 1.1. Interesting, but we will not pursue it further.
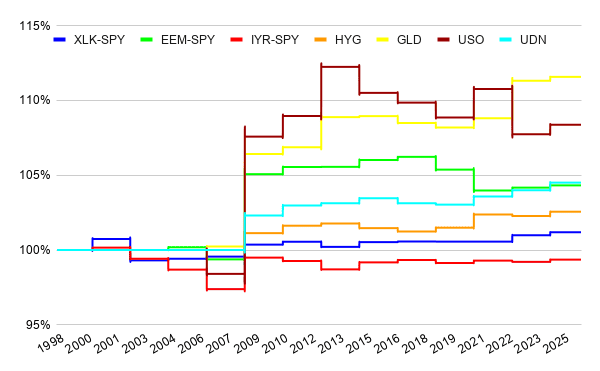
Crisis hedges (GLD, USO, UDN) show a modest positive D0 drift; equity spreads are flat; IYR-SPY slightly negative.
Seven legs, nine cycles, one driver: resolution.
Figure 4 combines the legs into an equal-weight D+1 short. Performance is concentrated in high-uncertainty cycles such as 2008, 2016, and 2024.
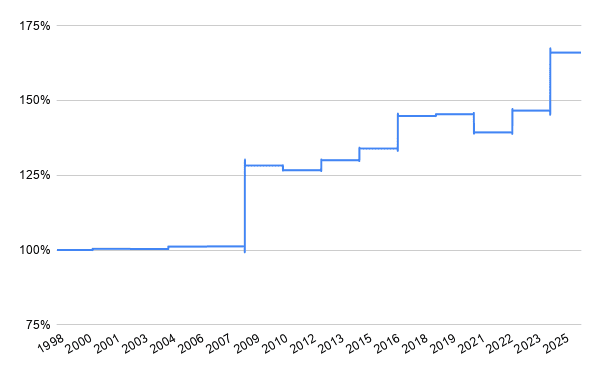
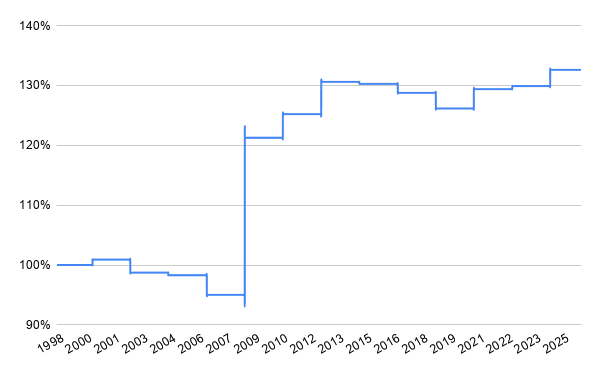
Figure 5 confirms evidence that November 2008 accounts for most cumulative equity in a single session. The thinness is the finding. Long D0 earns a participation trophy—a 1.03% carry for taking uncompensated tail risk. The real check comes from selling the post-ballot hangover on D+1. A long with teeth would mean both sides harvest the same slow premium; what we see is an option expiring at the close: carry while uncertainty is live, give-back once it resolves. Holding D0 risk is picking up pennies in front of a steamroller. The D+1 short owns the casino; the D0 long just vacuums the carpet.
Table 1. Risk/Return Summary for the Multi-Asset Election Strategies, 2008-2024
| Strategy | Performance * | Volatility * | Sharpe ** | MaxDD | Calmar *** |
|---|---|---|---|---|---|
| D+1 short (EW) | 1.86% | 6.08% | 0.31 | -4.16% | 0.45 |
| D0 long (EW) | 1.03% | 5.48% | 0.19 | -5.83% | 0.18 |
* p.a. ** 0% risk-free *** Perf/MaxDD
No leg freeloads: per-trade D+1 shorts run from +0.13% in tech to +1.81% in EM. The basket isn’t carried; it’s broad; the equal-weight basket compounds to 1.86% p.a., 0.31 Sharpe and only –4.16% max DD across nine full-coverage cycles.
7. Discussion and Economic Interpretation: Fixed Income Duration Rotation — IEF Case Study
7.1 Event Window — IEF D-5 to D+5: Intermediate-term Treasuries show the inverse pattern. Figure 6 shows IEF from D-5 to D+5, with negative returns before the vote as duration is de-risked and term premia expand, and positive returns from D0 through D+2 as rate expectations stabilize.
Pre-election de-risk, post-election re-risk — the mirror image.
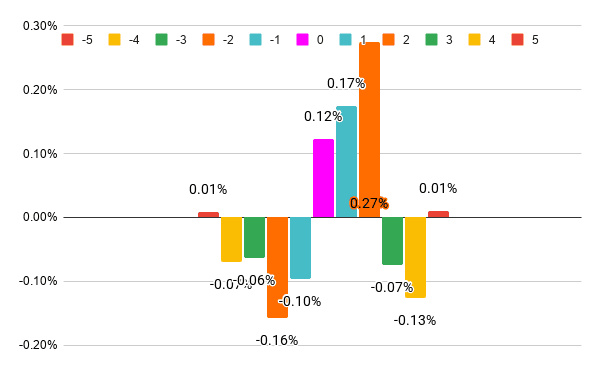
7.2 Portfolio Performance — IEF Rotation: We short IEF from D-4 to D-1 and go long from D0 to D+2. Figure 7 shows both legs appreciate steadily, confirming the rotation is not one-sided. Figure 8 shows the combined result.
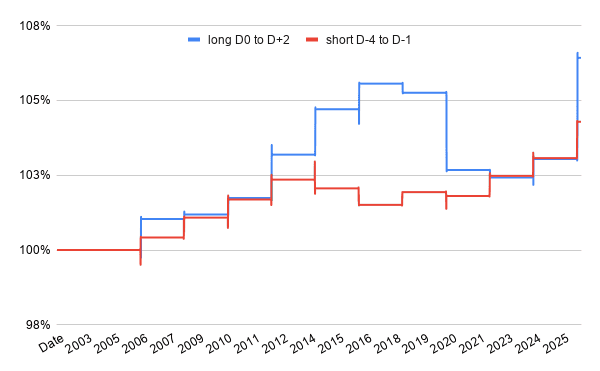
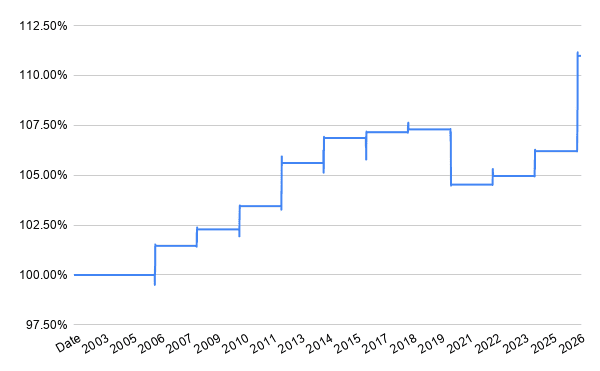
Table 2. Risk/Return Summary for the IEF Duration Rotation Strategy, 2002-2024
| Performance * | Volatility * | Sharpe ** | MaxDD | Calmar *** |
|---|---|---|---|---|
| 0.43% | 0.91% | 0.48 | -2.87% | 0.15 |
The IEF rotation strategy presented in Table 2 (short D-4/D-1, long D0/D+2) prints 0.43% at 0.48 Sharpe and 0.91% vol, the exact mirror image of the risk-asset vacuum. Duration is sold when term premia expand into the vote and bought when they collapse once the ballots are counted—completing the clean two-sided election overlay.
8. Conclusion
We document two calendar trades that are simple in construction but economically motivated. One: short risk on D+1. It works because the political uncertainty premium collapses once democracy delivers an answer — any answer; the long-D0 mirror image earns only 1.03% p.a. (Sharpe 0.19, Calmar 0.18), a statistically thin carry that confirms the premium is embedded before the close but is too weak to trade — evidence, not alpha. 1.86% p.a. for one day every two years, Sharpe 0.31, MaxDD -4.16%, 9 elections, 7 assets, same direction. Twenty-four hours of risk every two years. One full year of uncorrelated P&L. The other 99.6 % of the time, your capital is at the beach.
Two: rotate IEF duration — short pre, long post. Sharpe 0.48, vol 0.91%, drawdown -2.87%. Lower in absolute return but higher risk-adjusted and complementary to the D+1 risk short. Together they form a compact election overlay: sell the news in risk, buy the dip in duration. In a landscape of crowded premia and complex models, this strategy requires only a statutory calendar and the discipline to wait two years for one session, making it notable for its parsimony. The next scheduled event is November 3, 2026. Set a reminder.
Author: Cyril Dujava, Quant Analyst, Quantpedia
Are you looking for more strategies to read about? Sign up for our newsletter or visit our Blog or Screener.
Do you want to learn more about Quantpedia Premium service? Check how Quantpedia works, our mission and Premium pricing offer.
Do you want to learn more about Quantpedia Pro service? Check its description, watch videos, review reporting capabilities and visit our pricing offer.
Do you want algorithmic access to the full Quantpedia database via the API? Subscribe to Quantpedia Pro, ask for an API key, and explore the in/out-of-sample statistics, source academic papers, and code snippets — ideal for quantitative research, systematic trading workflows, and AI model training.
Are you looking for historical data or backtesting platforms? Check our list of Algo Trading Discounts.
Or follow us on:
Facebook Group, Facebook Page, Telegram, Twitter, Linkedin, Medium or Youtube
References
Goodell, J. W., & Vähämaa, S. (2013). US presidential elections and implied volatility: The role of political uncertainty. Journal of Banking & Finance, 37(3), 1108–1117. https://doi.org/10.1016/j.jbankfin.2012.12.001
Chan, K. F., & Marsh, T. (2021). Asset prices, midterm elections, and political uncertainty. Journal of Financial Economics, 141(1), 276–296. https://doi.org/10.1016/j.jfineco.2021.03.007
Vojtko, R., & Cisár, D. (2020). Pre-election drift in the stock market. SSRN Electronic Journal. https://doi.org/10.2139/ssrn.3531847
Share onLinkedInTwitterFacebookRefer to a friend