Can Weakening Morning Order Flow Predict SPY Reversals?
In a previous article Building and Testing Trend-Following Strategies on One-Minute SPY Data, we investigated whether retail activity indicators derived from one-minute SPY data could be used to construct profitable trend-following strategies. The results suggested that we are able to construct strategies that are often able to achieve superior risk-adjusted performance. In this article, we examine an alternative hypothesis. Instead of assuming that changes in retail activity signal the continuation of an existing trend, we investigate whether persistent declines in order flow may create conditions for a subsequent market reversal. More specifically, we analyze situations in which selected trading activity indicators decrease for several consecutive trading days and evaluate whether such sequences are followed by above-average SPY returns.
The data
The analysis is once again based on Algoseek US Equities Trade and Quote Extended Minute Bar data covering the period from April 1, 2021, to April 15, 2026. The dataset contains intraday observations for each trading minute, allowing the development and evaluation of intraday trend-following strategies. Algoseek US Equities Trade and Quote Extended Minute Bar provides minute-level analytics derived from consolidated trade and quote (TAQ) data, with roughly 90 metrics per bar including OHLCV, trade classification at bid, mid, and ask, spread measures, time-weighted quotes, and estimated retail TRF order flow.
While the underlying dataset remains unchanged, this article focuses on a different group of market microstructure indicators. Instead of analyzing retail participation, we investigate measures describing the balance between buyer-initiated and seller-initiated trading activity, commonly referred to as order flow.
The following indicators are considered as candidates for analysis:
Aggressor Ratio = Trade At Ask / (Trade At Ask + Trade At Bid)
This indicator measures the proportion of buyer-initiated trading activity relative to all aggressively executed trades. Higher values indicate stronger buying pressure.
Normalized Order Flow Imbalance = (Trade At Ask – Trade At Bid) / Volume
This metric quantifies the imbalance between buyer- and seller-initiated volume while normalizing for the total traded volume, making observations directly comparable across trading sessions.
Ask Bid Ratio = Trade At Ask / Trade At Bid
The ratio compares aggressive buying volume with aggressive selling volume. Values greater than one indicate buyer dominance, whereas values below one suggest stronger selling pressure.
Order Flow Imbalance = Trade At Ask – Trade At Bid
Unlike the normalized measure, this indicator represents the absolute difference between buyer- and seller-initiated trading volume and therefore captures the magnitude of net order flow.
Together, these indicators provide complementary views of intraday buying and selling pressure. In the following sections, we investigate whether consecutive declines in these order flow measures contain information about subsequent SPY price reversals and whether they can be used to construct robust end-of-day trading strategies.
The windows
As in the previous article, the proposed trading strategies are defined by two independent components: the signal window, used to generate the trading signal, and the trade window, which determines how long the resulting position is held.
For reversal strategies, we consider three alternative signal windows: 9:30 AM – 10:00 AM (first 30 minutes of trading, in graphs as A), 9:30 AM – 3:00 PM (full trading day without last hour, in graphs as B) and 9:30 AM – 3:30 PM (full trading day without last 30 minutes, in graphs as C).
Unlike the trend-following strategies presented previously, these windows allow us to investigate whether information obtained shortly after the market opens is sufficient for identifying reversal opportunities or whether incorporating a larger portion of the trading session leads to more reliable signals. The opening window is particularly interesting because it captures the market’s immediate reaction to overnight information and often reflects the prevailing sentiment for the trading day. In contrast, the longer windows progressively incorporate additional intraday order flow before the trading signal is evaluated.
The duration for which the position remains open is determined by the trade window. In this study, we focus on two holding periods: 3:59 PM – 9:31 AM (overnight, in graphs as Y3) and 3:59 PM – 3:59 PM on the next trading day (full trading day, in graphs as Y4).
The strategies pool
The proposed strategies are based on the hypothesis that changes in early-session order flow imbalance may contain information about short-term price reversals. For each trading day, the selected indicator is aggregated over a predefined intraday signal window to obtain a single daily value. Rather than comparing this value with its historical average, the proposed reversal strategies monitor its short-term dynamics. A long trading signal is generated whenever the daily indicator exhibits a consecutive decline over given number of trading days (in our case 1, 2 or 3), indicating a gradual weakening of buying pressure or strengthening of selling pressure during the opening session. Otherwise, no position is opened.
Whenever a long signal is generated, the position is entered at the market close (3:59 PM) and held according to the selected trading window. The holding period includes either the overnight session or the entire following trading day. Combining different order flow indicators with alternative signal windows and holding periods results in a family of reversal strategies that differ only in the information used to generate the signal and the duration of the resulting position.
Special window
Several alternative signal windows were evaluated throughout the analysis to determine which part of the trading session contains the most informative order-flow signals. While longer windows incorporate a larger fraction of the trading day, the empirical results consistently indicate that the 9:30 AM–10:00 AM window provides the strongest predictive performance.
A plausible explanation lies in the informational role of the market open. The first minutes of regular trading incorporate overnight news, accumulated retail orders, institutional portfolio adjustments, and other delayed executions that could not be completed outside market hours. Consequently, the opening period often represents the most intensive phase of price discovery during the trading day.
From the perspective of order flow, the opening window provides a direct view of the balance between aggressive buyers and sellers immediately after new information has been absorbed by the market. In contrast, indicators computed over longer horizons also capture intraday liquidity effects, dealer inventory adjustments, lunch-time trading, and closing auction activity, all of which may dilute the predictive information contained in the initial market reaction.
Performance of basic setup
To evaluate whether order flow deterioration contains information about short-term price reversals, we focus on a single representative measure: Order Flow Imbalance (OFI). This indicator is selected as the baseline metric because it directly captures the balance between aggressive buying and selling activity. The other indicators introduced earlier produce broadly similar results, so we omit them from this comparison to keep the analysis concise.
The initial evaluation uses a two-day deterioration signal. A long reversal signal is generated whenever OFI decreases for two consecutive trading days within the selected signal window. The position is entered at the market close (3:59 PM) and evaluated using both holding periods defined previously.
The performance is therefore compared with three reference strategies:
- SPY buy-and-hold benchmark, representing passive market exposure.
- Price-based reversal benchmark, where signals are generated using negative SPY returns over the same two-day period instead of order flow deterioration. Positions are held using the same exit setup as the OFI-based strategy.
- Morning price reversal benchmark, which uses only the return during the opening 30-minute session as the signal source. A negative opening session performance over two consecutive days triggers the same reversal holding periods.
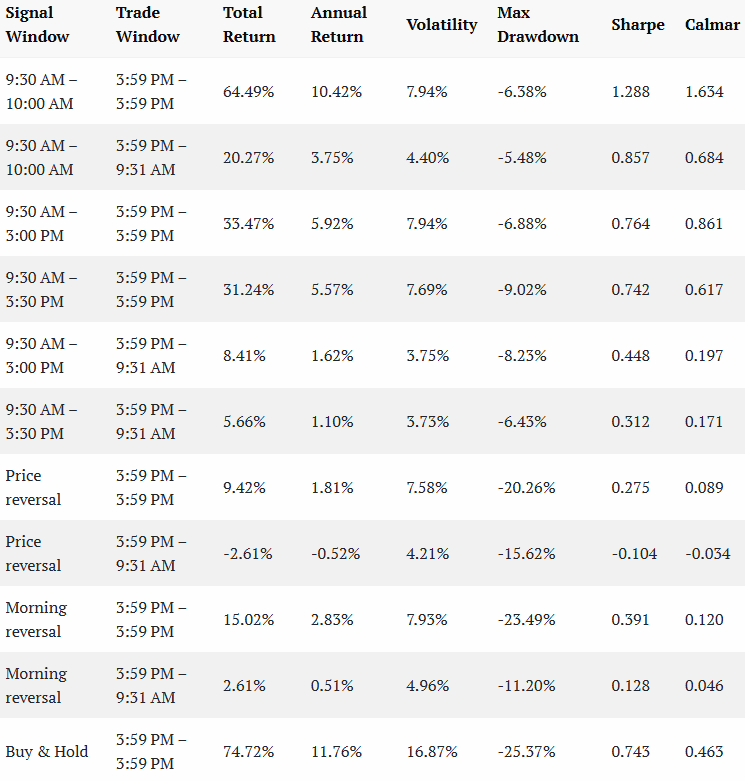

The results indicate that strategies based on the opening 30-minute signal window provide a substantial improvement in risk-adjusted performance compared with all considered benchmarks. This improvement is accompanied by a substantially lower maximum drawdown, suggesting that the advantage is primarily driven by improved downside risk control rather than higher absolute returns alone.
Although the strongest results are concentrated in the opening window, similar improvements can occasionally be observed for longer signal windows. However, the effect becomes less consistent as additional intraday information is incorporated into the signal calculation. This suggests that the predictive information contained in order flow deterioration is most pronounced shortly after market open, when the market is still processing overnight information and adjusting to the initial imbalance between buyers and sellers.
Robustness with respect to consecutive decline periods
To evaluate the robustness of the proposed reversal strategies, we investigated whether the predictive power of order flow deterioration depends on the length of the declining sequence used to generate the trading signal. Specifically, we compared signals based on one, two, and three consecutive days of decline in the selected order flow indicators.
Our results indicate that the reversal effect is not uniformly present across different persistence levels. Signals based on a single-day decline generally do not provide sufficient information to identify subsequent positive SPY returns, suggesting that short-term fluctuations in order flow are likely dominated by market noise rather than systematic reversal patterns. At the opposite extreme, requiring three consecutive days of deterioration also leads to weaker results. Although such sequences represent more persistent selling pressure, they appear to capture situations where negative order flow conditions have already lasted too long and may reflect a more fundamental change in market conditions rather than temporary exhaustion.
In contrast, a two-day consecutive decline provides the most consistent and promising results across the tested indicators and trading windows. This suggests that a moderate level of order flow deterioration may represent a balance between filtering out random daily fluctuations and avoiding signals generated after a prolonged shift in market sentiment.
Other indicators
So far, the analysis has focused exclusively on Order Flow Imbalance as the representative order flow measure. However, as discussed earlier, several alternative indicators can be used to characterize the balance between aggressive buyers and sellers, including Aggressor Ratio, Normalized Order Flow Imbalance, and Ask-Bid Ratio.
To examine whether the observed reversal effect is specific to OFI or represents a more general property of order flow deterioration, we extend the analysis to all previously introduced indicators. For consistency, we apply the same evaluation framework and focus on the best-performing strategy configurations identified for OFI.
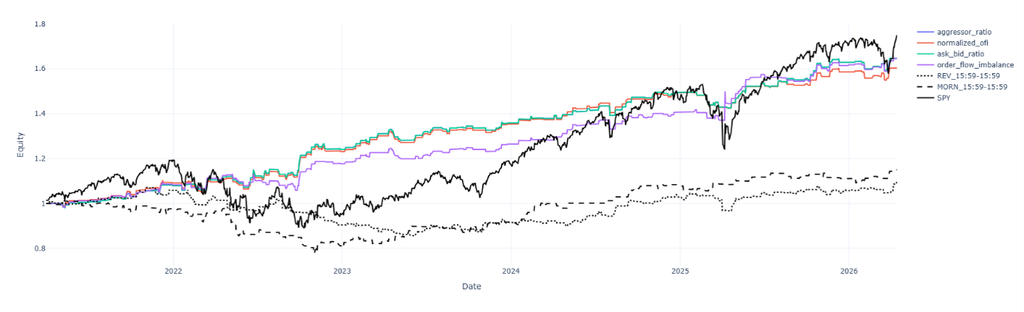

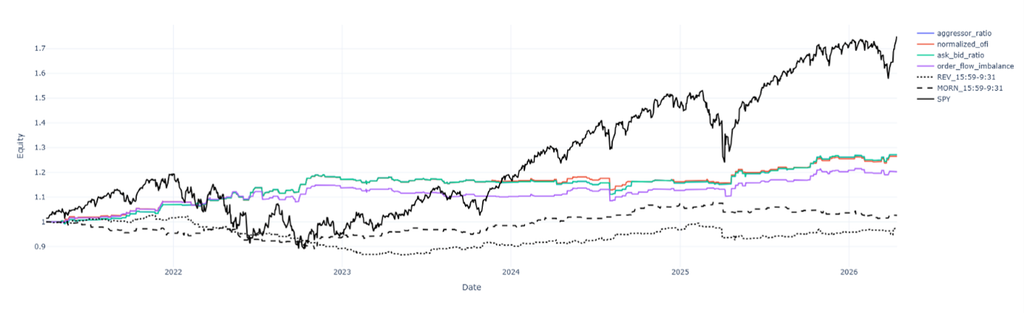
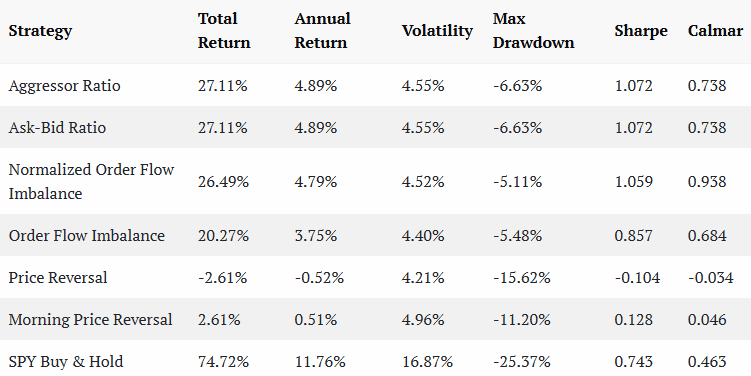
Overall, the results indicate that all examined order flow indicators provide improved risk-adjusted performance compared with the considered price-based reversal benchmarks. Regardless of the specific indicator used, strategies based on persistent order flow deterioration achieve higher Sharpe ratios and substantially lower drawdowns than simple reversal approaches based only on price movements.
Conclusion
This article investigated whether persistent deterioration in intraday order flow conditions can be used to identify short-term reversal opportunities in SPY. Unlike traditional trend-following approaches, which assume that market movements tend to continue, the proposed strategies were based on the hypothesis that prolonged weakening of buying pressure may represent temporary market imbalance followed by subsequent price correction.
Using one-minute SPY data, we evaluated several order flow indicators, including Order Flow Imbalance, Normalized Order Flow Imbalance, Aggressor Ratio, and Ask-Bid Ratio. The results indicate that all examined order flow measures provide improved risk-adjusted performance compared with simple price-based reversal approaches.
The strongest results were obtained when the signal was derived from the first 30 minutes of trading and positions were held until the close of the following trading day. These strategies achieved substantially higher Sharpe ratios and lower drawdowns than the considered reversal benchmarks. An important finding is that the predictive information appears to be concentrated in the opening session. This period represents the phase of the trading day when overnight information is incorporated into prices and when aggressive buying and selling activity is most pronounced. The results suggest that temporary order flow imbalances observed during this period may contain information about subsequent market corrections.
However, it is important to mention that the observed reversal effect is not equally strong across all signal specifications. In particular, the two-day deterioration pattern provides the most promising results in our framework and alternative persistence levels, such as one-day or three-day deterioration sequences produce considerably weaker results, suggesting that the effectiveness of the approach may depend on a relatively narrow definition of the signal.
Still, the main advantage lies in improved risk management, as the reduction in volatility and maximum drawdown leads to superior risk-adjusted performance. This distinction highlights the potential role of order flow-based signals as a tool for improving portfolio efficiency rather than simply generating excess returns.
Authors:
Jakub Demko, Junior Quant Analyst, Quantpedia
David Belobrad, Junior Quant Analyst, Quantpedia
Are you looking for more strategies to read about? Sign up for our newsletter or visit our Blog or Screener.
Do you want to learn more about Quantpedia Premium service? Check how Quantpedia works, our mission and Premium pricing offer.
Do you want to learn more about Quantpedia Pro service? Check its description, watch videos, review reporting capabilities and visit our pricing offer.
Do you want algorithmic access to the full Quantpedia database via the API? Subscribe to Quantpedia Pro, ask for an API key, and explore the in/out-of-sample statistics, source academic papers, and code snippets — ideal for quantitative research, systematic trading workflows, and AI model training.
Are you looking for historical data or backtesting platforms? Check our list of Algo Trading Discounts.
Or follow us on:
Facebook Group, Facebook Page, Telegram, Twitter, Linkedin, Medium or Youtube
Share onLinkedInTwitterFacebookRefer to a friend