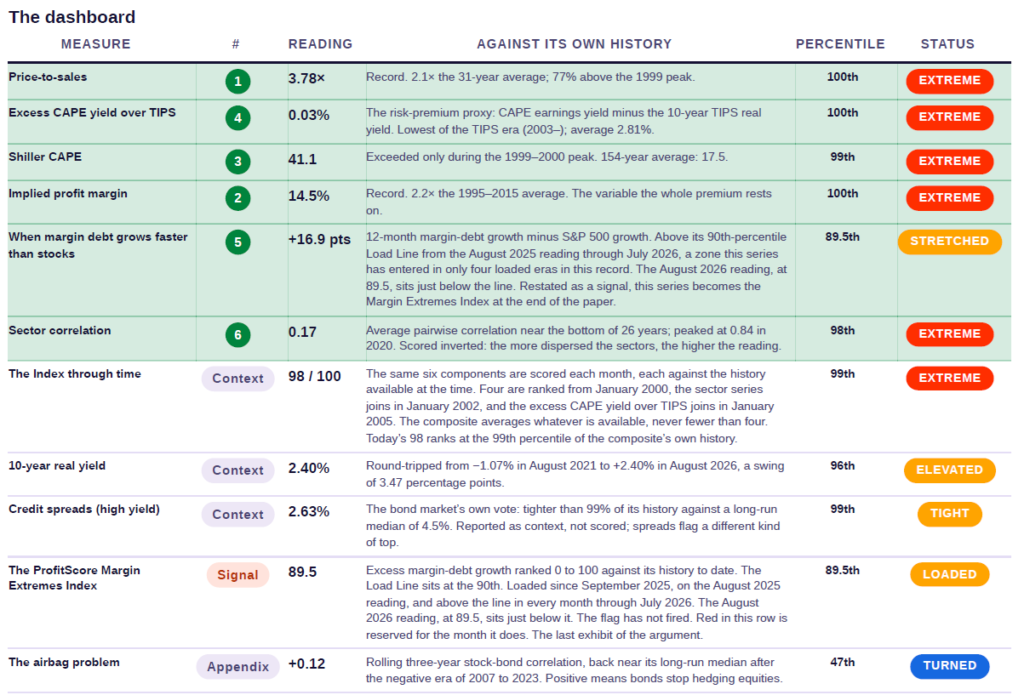
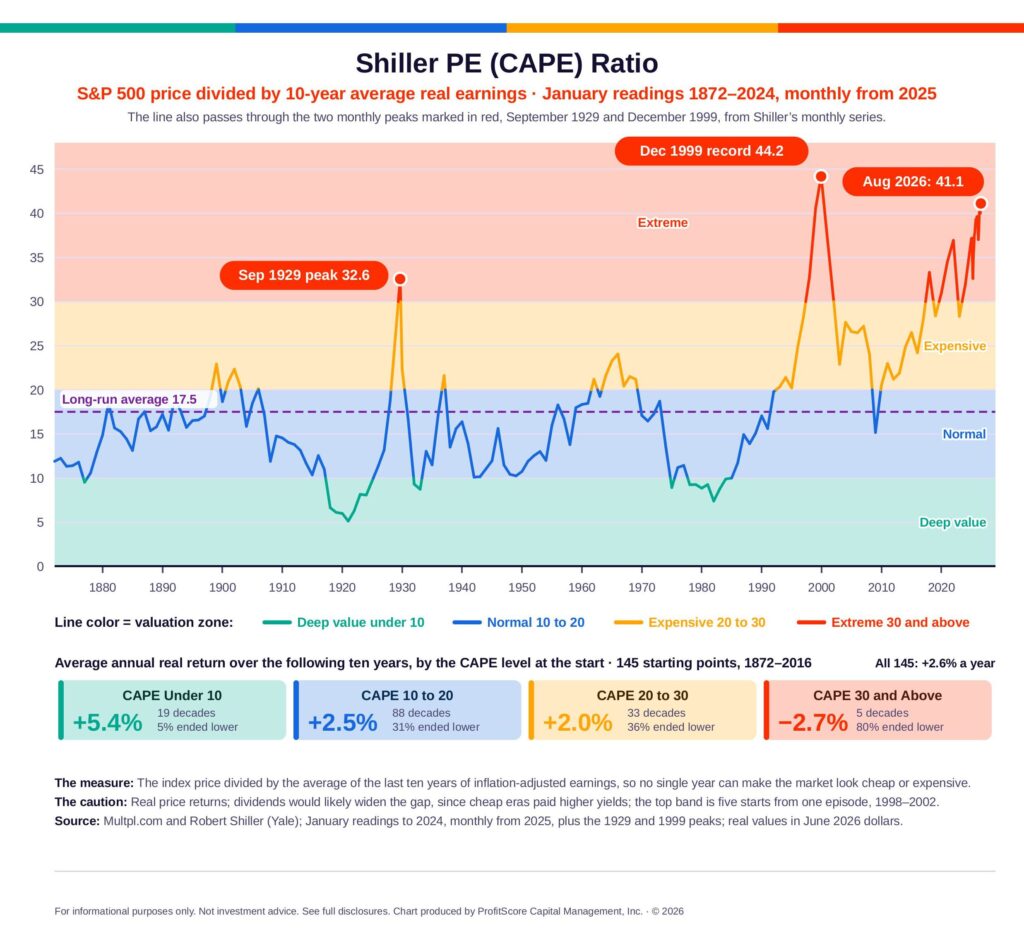
An expensive market can keep rising, but that does not make the price paid irrelevant. John McClure’s Priced to Perfection examines valuations, profitability, and leverage in U.S. equities, with its six-component Market Extremes Index reaching 98 out of 100 using data through August 2026. For a portfolio manager, this raises a practical question: how much must go right to earn a satisfactory return—and what happens if it does not?
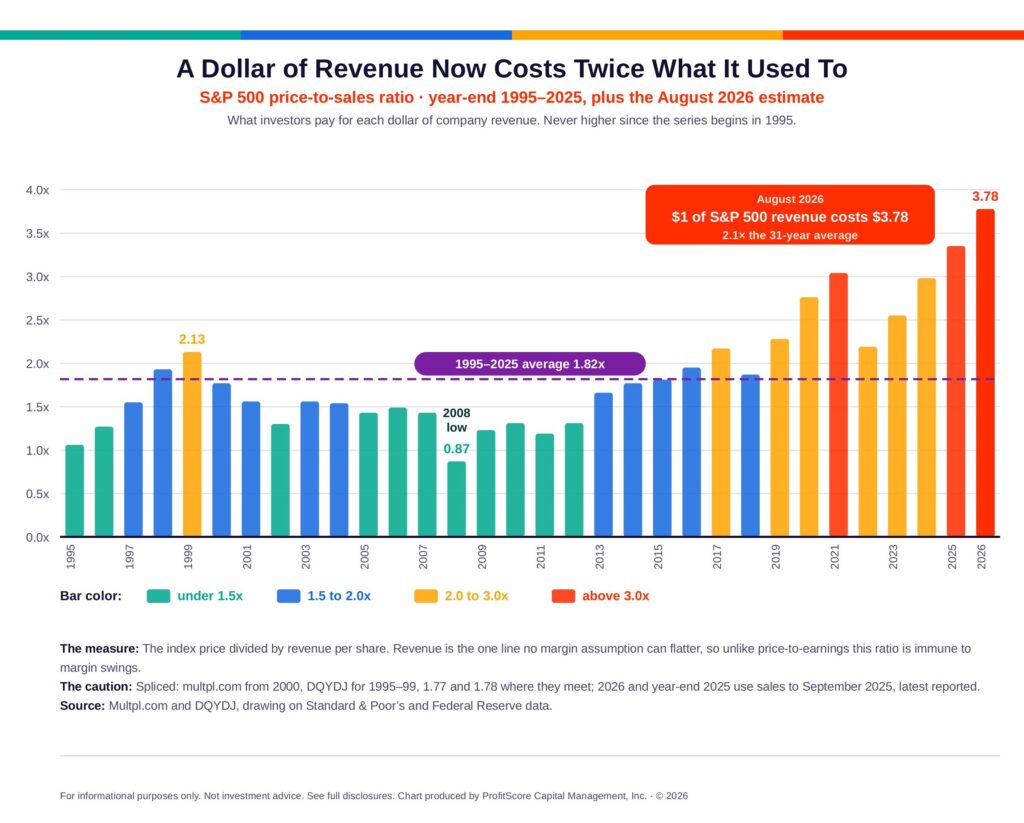
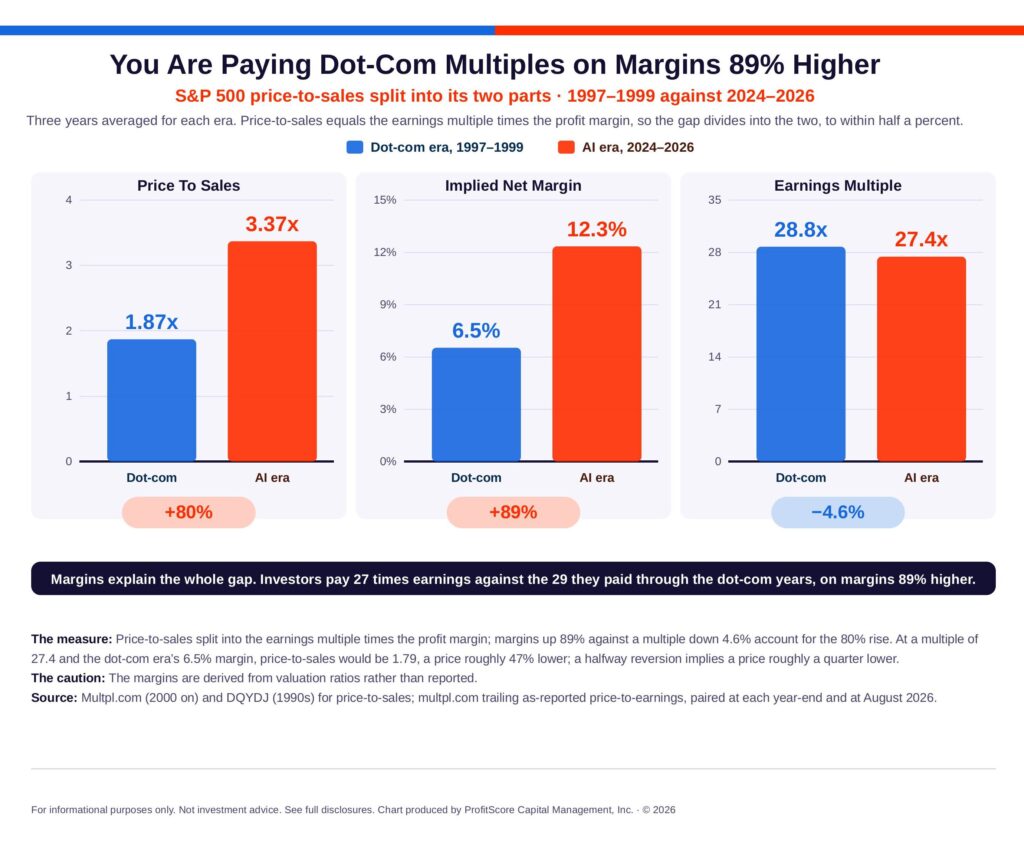
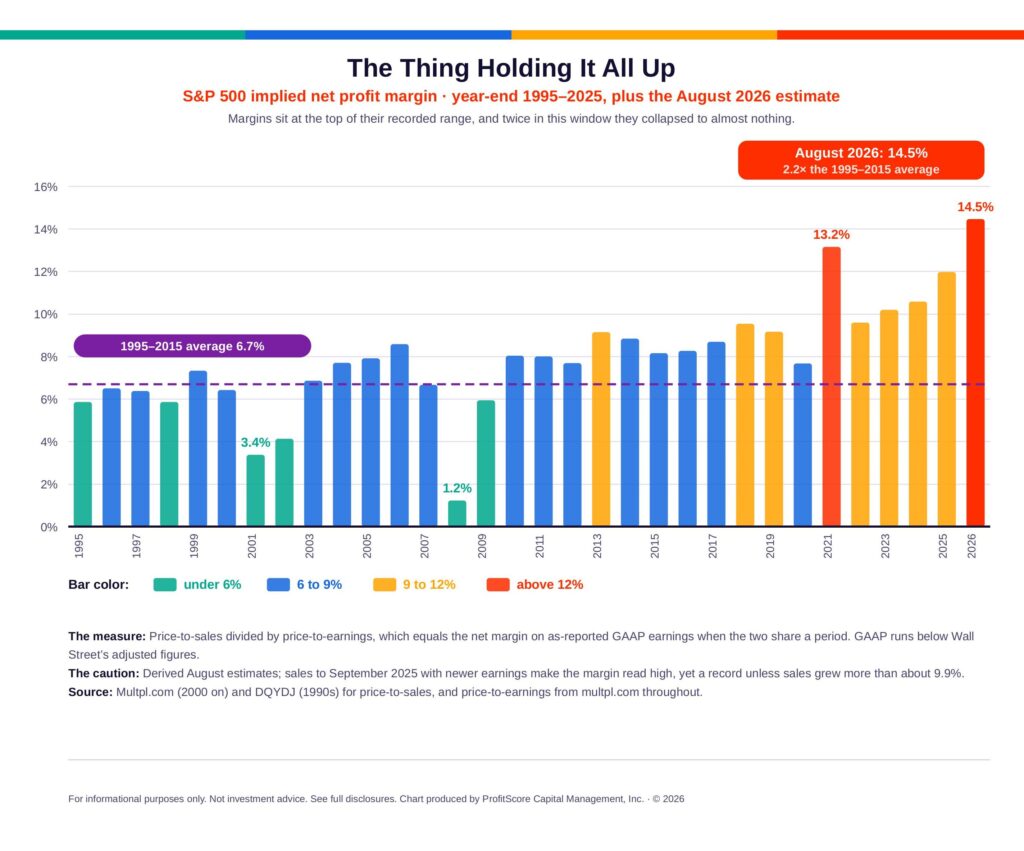
Much depends on profit margins. The S&P 500’s price-to-sales ratio of 3.78 is approximately 77% above its dot-com-era peak, with higher implied profitability explaining most of the difference between the eras. Sustaining those margins is therefore an important part of the investment case. Structural improvements may support higher profitability, but even partial normalisation would weaken earnings unless revenue growth offsets it. If earnings multiples also contract, the effects would compound. Testing both assumptions is more useful than simply extrapolating recent earnings strength.
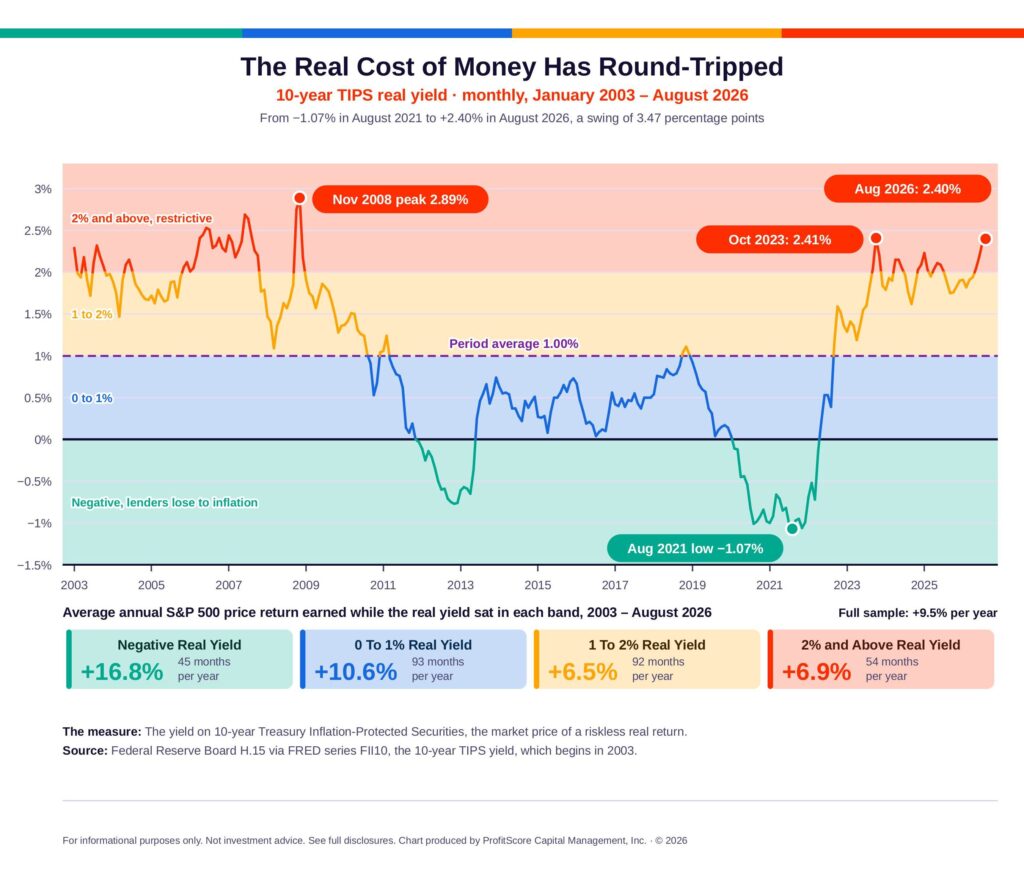
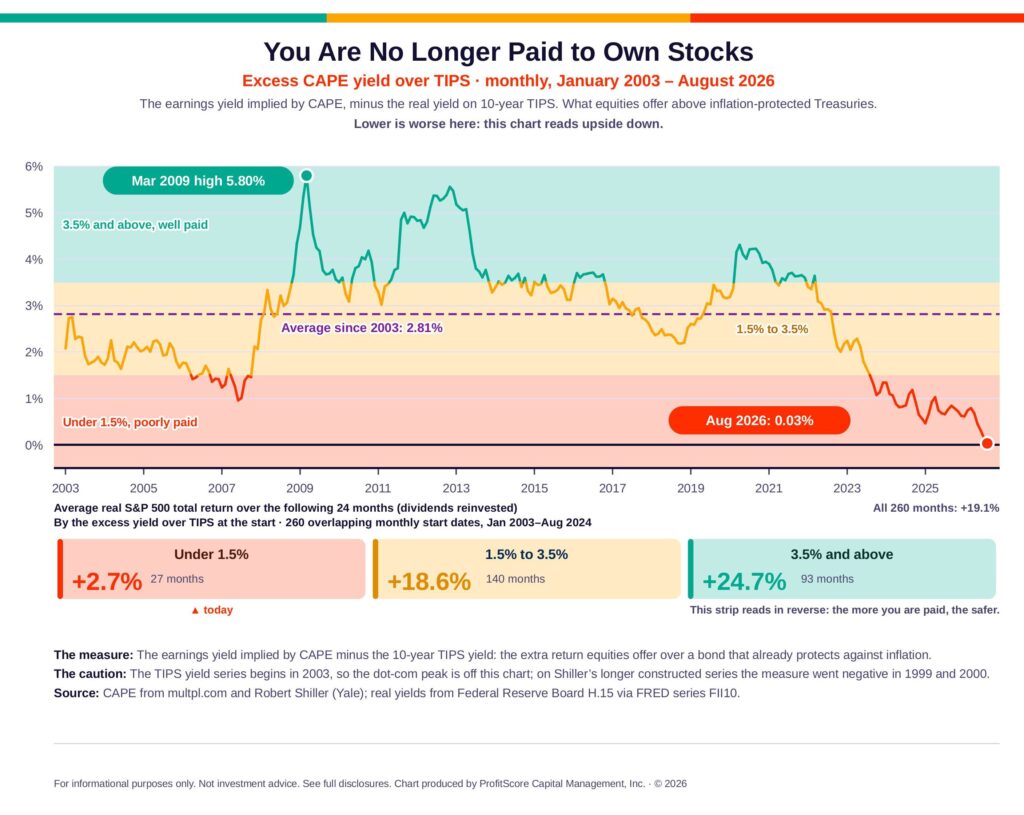
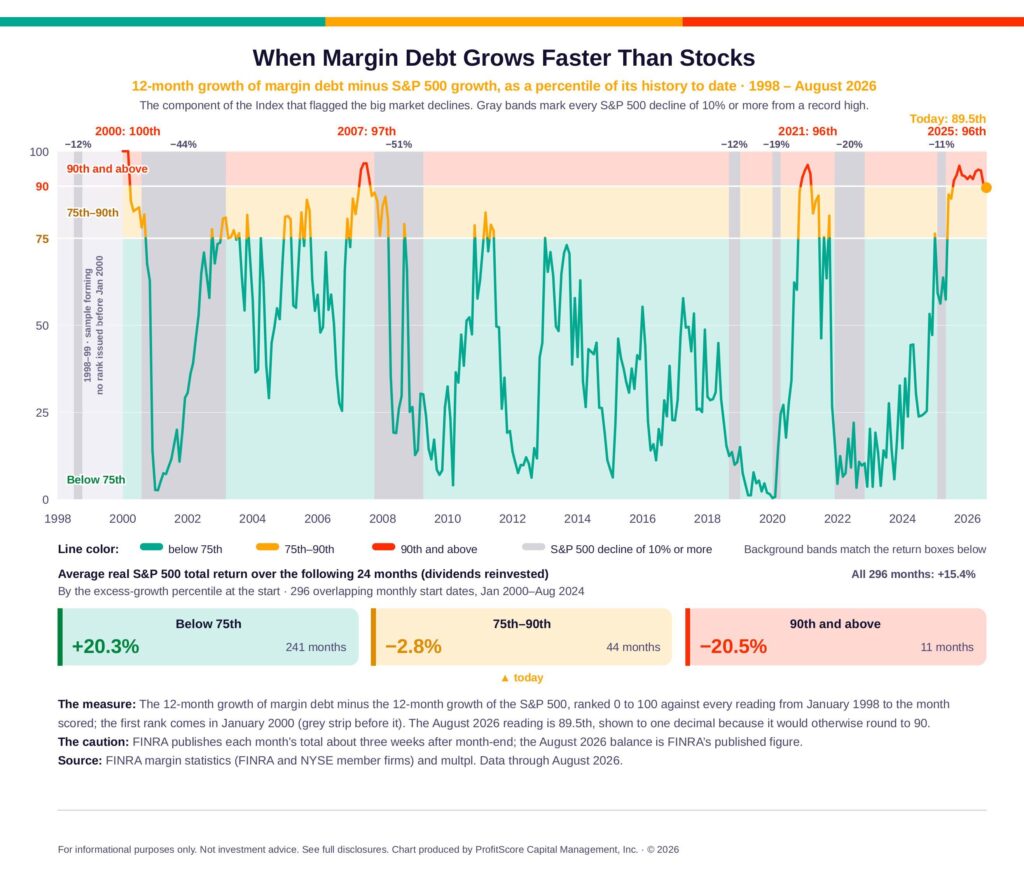
Relative valuations offer little reassurance. The CAPE earnings yield exceeds the 10-year TIPS yield by just 0.03 percentage points. Although this spread is an imperfect measure of expected equity compensation, it raises the hurdle for accepting equity risk: investors need a convincing earnings-growth outlook to justify the additional uncertainty. Elevated margin-debt growth adds a potential source of forced selling, while positive stock-bond correlation suggests that conventional diversification may offer less protection than expected.
These conditions give valuation a practical role in return expectations, exposure, and stress testing. The composite’s related inputs and limited history of extreme episodes constrain its usefulness as a forecasting tool, but portfolio decisions need not depend on predicting the market peak. Investors can assess the consequences of weaker margins, lower multiples, and simultaneous stock and bond losses—and decide whether the prospective return is sufficient to bear them.
Authors: John McClure
Title: Priced to Perfection: Six Scored Measures of a Market at Its Extremes, and the Signal That Marked the Last Three Great Turns
Link: https://ssrn.com/abstract=7541883
Abstract:
At every prior market extreme in this paper’s record, at least one independent witness dissented. Today the witnesses agree. Investors are paying 3.78 times revenue for the S&P 500, 77% more than at the peak of the dot-com bubble, and almost all of the gap over the dot-com years rests on a single assumption, that today’s unusually high profit margins will last. The reward for owning stocks over inflation-protected Treasuries has fallen to 0.03%, the lowest of the TIPS era, and margin debt has grown seventeen points faster than the market in a year. Six such measures, each ranked against its own history, form the ProfitScore Market Extremes Index. It reads 98 out of 100. CAPE has called this market expensive for twenty-five years. The Index stayed quiet through all but two stretches of them. It stood at 90 or above at the top of 2000, when every matured month that followed was a loss, averaging 31% in real terms over two years, and it has held there in every month since June 2025. The paper closes with a Load Line, named for the mark Parliament once required on every British hull, painted here on borrowed money. The ProfitScore Margin Extremes Index and its flag marked the turns of 2000, 2007 and 2022, each within two months of the peak. For twelve months this market sailed above that line. Volatility has already spoken. The trend has not. The author used Anthropic’s Claude to edit the manuscript, assist with data entry and exhibit construction, and review drafts. All analysis, measures, and conclusions are the author’s.
As always, we present several interesting figures and tables:
Notable quotations from the academic research paper:
“The same six components are scored each month, each against the history available at the time. Four are ranked from January 2000, the sector series joins in January 2002, and the excess CAPE yield over TIPS joins in January 2005. The composite averages whatever is available, never fewer than four. Today’s 98 ranks at the 99th percentile of the composite’s own history.
Margins explain the whole gap. Investors pay 27 times earnings against the 29 they paid through the dot-com years, on margins 89% higher.
The caution: Derived August estimates; sales to September 2025 with newer earnings make the margin read high, yet a record unless sales grew more than about 9.9%.
The caution: The TIPS yield series begins in 2003, so the dot-com peak is off this chart; on Shiller’s longer constructed series the measure went negative in 1999 and 2000.
The measure: The 12-month growth of margin debt minus the 12-month growth of the S&P 500, ranked 0 to 100 against every reading from January 1998 to the month scored; the first rank comes in January 2000 (grey strip before it). The August 2026 reading is 89.5th, shown to one decimal because it would otherwise round to 90.”
Are you looking for more strategies to read about? Sign up for our newsletter or visit our Blog or Screener.
Do you want to learn more about Quantpedia Premium service? Check how Quantpedia works, our mission and Premium pricing offer.
Do you want to learn more about Quantpedia Pro service? Check its description, watch videos, review reporting capabilities and visit our pricing offer.
Are you looking for historical data or backtesting platforms? Check our list of Algo Trading Discounts.
Or follow us on:
Facebook Group, Facebook Page, Twitter, Linkedin, Medium or Youtube
Share onLinkedInTwitterFacebookRefer to a friend