A New Look on Shiller’s CAPE Ratio

20.March 2019

Robert Shiller and Farouk Jivraj discuss a validity of methodology for Campbell &Shiller's CAPE ratio calculation, share their opinion on future returns of US equities and give few novel ideas for CAPE's usage for asset allocation and country and sector picking:

Authors: Jivraj, Shiller

Title: The Many Colours of CAPE

Link: https://papers.ssrn.com/sol3/papers.cfm?abstract_id=3258404

Abstract:

Campbell & Shiller's [1988] Cyclically-Adjusted Price to Earnings ratio (CAPE) has both its advocates and critics. Currently, the debate is on the validity of the high CAPE ratio for US stock markets in forecasting lower future returns, with CAPE currently at 31.21. We investigate the efficacy and validity of CAPE from several different perspectives. First, we run multiple-horizon predictability regressions for CAPE versus its peers and find that CAPE consistently displays economic and statistical significance far better than any of its peers. Second, we explore alternative constructions of CAPE based on other proxies for earnings motivated by the work of findings by Siegel [2016] using NIPA profits. We find that original CAPE is still best when comprehensively and fairly reviewing the other proxies, even for NIPA profits. Third, we assess how to practically use CAPE in both an asset allocation and relative valuation setting. We demonstrate a novel use of CAPE for asset allocation programmes as well as discuss relative valuation exercises for country, sector and single stock rotation.

Notable quotations from the academic research paper:

"Campbell & Shiller's Cyclically-Adjusted Price to Earnings ratio (CAPE), is a well known to characterize the strong relationship between an inflation adjusted earnings-to-price ratio and subsequent longterm returns. As a result, it has now become an often cited measure of equity market valuation. With such a status, the current value of CAPE, 31.12 (as in 10/2017), is causing concern amongst investors and spurring debate among academics – it is currently in 96th percentile compared to its own history since 1881. Thus, the question of whether the US stock market is overpriced, is being hotly contested and CAPE is at the centre of this debate.

CAPE

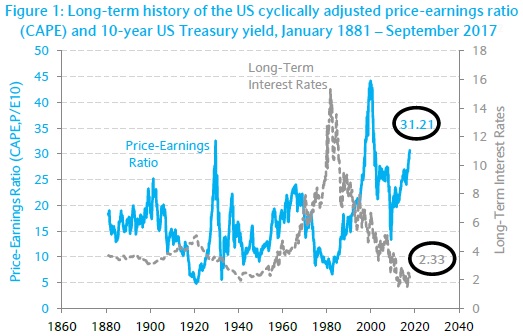
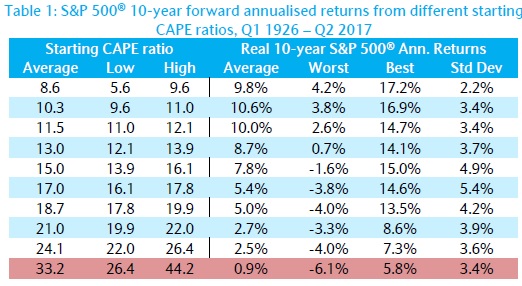
Table 2 shows, that historically, at such a starting level, by deciles, we're in the worst possible bucket where on average subsequent annualised real returns over next ten years were a mere 0.9%, with the best case being a not bad 5.8% but the worst case being a very bad -6.1%

Table of CAPE ratio

Critics mainly focus on ways to claim that the observed CAPE ratios are too high and not valid for reasons such as statistical significance and/or changing accounting standard over the years.

Siegel (2016) proposed an alternative of National Income and Product Account (NIPA) corporate profits from the Bureau of Economic Analysis to be used in context of correcting the bias in CAPE. We therefore look closely at these claims but also compliment this alternative CAPE constrution using NIPA profits, with version using operating earnings, cash flow, sales and book value as other earnings related proxies.

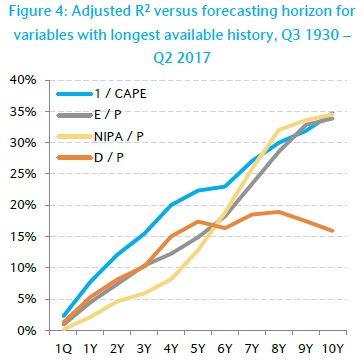
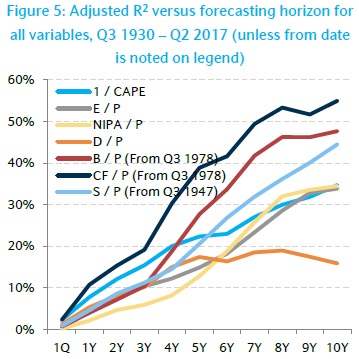
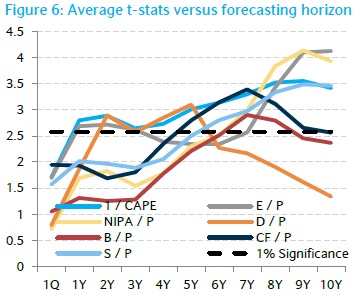
Figures 4 to 6 report R^2 and averaged t-statistics for our predictability regressions. They should be reviews in tandem. Figure 4 demonstrates the ability of CAPE in forecasting returns better then E/P, NIPA/P and D/P at shorter horizons. E/P and NIPA/P eventually catch up and significantly so, as confirmed by their t-statistics in Figure 6. However it is clear, that CAPE is able to consistently predict subsequent returns significantly so from a 1Y horizon onwards.

Figure 6 perfectly highlights the small sample bias in long horizon regressions when comparing the R^2s of B/P, CF/P and S/P with those in figure 5. Whilst the R^2s may appear higher, especially at the longest horizons, Figure 6 shows that past a 5Y horizon, S/P is the only variable that is consistently significant.


R^2 of CAPE

R^2 of other ratios

t-stat of CAPE ratios

"


Are you looking for more strategies to read about? Check http://quantpedia.com/Screener

Do you want to see performance of trading systems we described? Check http://quantpedia.com/Chart/Performance

Do you want to know more about us? Check http://quantpedia.com/Home/About


Follow us on:

Facebook: https://www.facebook.com/quantpedia/

Twitter: https://twitter.com/quantpedia


Continue reading

Better Rebalancing Strategy for Static Asset Allocation Strategies

13.March 2019

An interesting financial academic paper which analyzes an alternative approach to rebalancing of static asset allocation strategies:

Authors: Granger, Harvey, Rattray, Van Hemert

Title: Strategic Rebalancing

Link: https://papers.ssrn.com/sol3/papers.cfm?abstract_id=3330134

Abstract:

A mechanical rebalancing strategy, such as a monthly or quarterly reallocation towards fixed portfolio weights, is an active strategy. Winning asset classes are sold and losers are bought. During crises, when markets are often trending, this can lead to substantially larger drawdowns than a buy-and-hold strategy. Our paper shows that the negative convexity induced by rebalancing can be substantially mitigated, taking the popular 60-40 stock-bond portfolio as our use case. One alternative is an allocation to a trend-following strategy. The positive convexity of this overlay tends to counter the impact on drawdowns of the mechanical rebalancing strategy. The second alternative we call strategic rebalancing, which uses smart rebalancing timing based on trend-following signals – without a direct allocation to a trend-following strategy. For example, if the trend-following model suggests that stock markets are in a negative trend, rebalancing is delayed.

Notable quotations from the academic research paper:

"A pure buy-and-hold portfolio has the drawback that the asset mix tends to drift over time and, as such, is untenable for investors who seek diversification. However, a stock-bond portfolio that regularly rebalances tends to underperform a buy-and-hold portfolio at times of continued outperformance of one of the assets. Using a simple two-period model, we explain the main intuition behind this effect: rebalancing means selling (relative) winners, and if winners continue to outperform, that detracts from performance.

As stocks typically have more volatile returns than bonds, relative returns tend to be driven by stocks. Hence, of particular interest are episodes with continued negative (absolute and relative) stock performance, such as the 2007-2009 global financial crisis. In Figure 2, we contrast the monthly-rebalanced and buy-and-hold cumulative performance over the financial crisis period, where both start with an initial 60-40 stock-bond capital allocation. The maximum drawdown of the monthly-rebalanced portfolio is 1.2 times (or 5 percentage points) worse than that of the buy-and-hold portfolio, right at the time when financial markets turmoil is greatest.

Rebalanced and not rebalanced portfolio

In earlier work, Granger et al. (2014) formally show that rebalancing is similar to starting with a buy-and-hold portfolio and adding a short straddle (selling both a call and a put option) on the relative value of the portfolio assets. The option-like payoff to rebalancing induces negative convexity by magnifying drawdowns when there are pronounced divergences in asset returns. We show that time-series momentum (or trend) strategies, applied to futures on the same stock and bond markets, are natural complements to a rebalanced portfolio. This is because the trend payoff tends to mimic that of a long straddle option position, or exhibits positive convexity.

Trend exposure and portfolio drawdown

We evaluate how 1-, 3-, and 12-month trend strategies perform during the five worst drawdowns for the 60-40 stock-bond portfolio. Allocating 10% to a trend strategy and 90% to a 60-40 monthly-rebalanced portfolio improves the average drawdown by about 5 percentage points, compared to a 100% allocation to a 60-40 monthly rebalanced portfolio. The trend allocation has no adverse impact on the average return over our sample period. That is, while one would normally expect a drag on the overall (long-term) performance when allocating to a defensive strategy, in our sample, the trend-following premium earned offsets the cost (or insurance premium) paid.

An alternative to a trend allocation is strategically timing and sizing rebalancing trades, which we label strategic rebalancing. We first consider a range of popular heuristic rules, varying the rebalancing frequency, using thresholds, and trading only partially back to the 60-40 asset mix. Such heuristic rules reduce the average maximum drawdown level for the five crises considered by up to 1 percentage point. However, using strategic rebalancing rules based on either the past stock or past stock-bond relative returns gives improvements of 2 to 3 percentage points."


Are you looking for more strategies to read about? Check http://quantpedia.com/Screener

Do you want to see performance of trading systems we described? Check http://quantpedia.com/Chart/Performance

Do you want to know more about us? Check http://quantpedia.com/Home/About


Follow us on:

Facebook: https://www.facebook.com/quantpedia/

Twitter: https://twitter.com/quantpedia


Continue reading

Two Centuries of Global Factor Premiums

7.March 2019

Related to all major factor strategies (trend, momentum, value, carry, seasonality and low beta/volatility):

Authors: Baltussen, Swinkels, van Vliet

Title: Global Factor Premiums

Link: https://papers.ssrn.com/sol3/papers.cfm?abstract_id=3325720

Abstract:

We examine 24 global factor premiums across the main asset classes via replication and new-sample evidence spanning more than 200 years of data. Replication yields ambiguous evidence within a unified testing framework with methods that account for p-hacking. The new-sample evidence reveals that the large majority of global factors are strongly present under conservative p-hacking perspectives, with limited out-of-sample decay of the premiums. Further, utilizing our deep sample, we find global factor premiums to be not driven by market, downside, or macroeconomic risks. These results reveal strong global factor premiums that present a challenge to asset pricing theories.

Notable quotations from the academic research paper:

"In this paper we study global factors premiums over a long and wide sample spanning the recent 217 years across equity index (but not single securities), bond, currency, and commodity markets.

The first objective of this study is to robustly and rigorously examine these global factor premiums from the perspective of ‘p-hacking’.

We take as our starting point the main global return factors published in the Journal of Finance and the Journal of Financial Economics during the period 2012-2018: time-series momentum (henceforth ‘trend’), cross-sectional momentum (henceforth ‘momentum’), value, carry, return seasonality and betting-against-beta (henceforth ‘BAB’). We examine these global factors in four major asset classes: equity indices, government bonds, commodities and currencies, hence resulting in a total of 24 global return factors.4

We work from the idea that these published factor premiums could be influenced by p-hacking and that an extended sample period is useful for falsification or verification tests. Figure 1, Panel A summarizes the main results of these studies.

Global factor strategies

Shown are the reported Sharpe ratio’s in previous publications, as well as the 5% significance cutoff in the grey-colored dashed line. In general, the studies show evidence on the global factor premiums, with 14 of the 22 factors (return seasonality is not tested in bonds and currencies) displaying significant Sharpe ratio’s at the conventional 5% significance level.

Global factor strategies 1981-20111

Further, most of the studies have differences in, amongst others, testing methodologies, investment universes and sample periods, choices that introduce degrees of freedom to the researcher. To mitigate the impact of such degrees of freedom, we reexamine the global return factors using uniform choices on testing methodology and investment universe over their average sample period (1981-2011). Figure 1, Panel B shows the results of this replicating exercise. We find that Sharpe ratios are marginally lower, with 12 of the 24 factor premiums being significant at the conventional 5% level.

Global factor strategies 1981-2011


The second objective of this study is to provide rigorous new sample evidence on the global return factors. To this end, we construct a deep, largely uncovered historical global database on the global return factors in the four major asset classes. This data consists of pre-sample data spanning the period 1800- 1980, supplemented with post-sample data from 2012-2016, such that we have an extensive new sample to conduct further analyses. If the global return factors were unintentionally the result of p-hacking, we would expect them to disappear for this new sample period.

Our new sample findings reveal consistent and ubiquitous evidence for the large majority of global return factors. Figure 1, Panel C summarizes our main findings by depicting the historical Sharpe ratio’s in the new sample period. In terms of economic significance, the Sharpe ratios are substantial, with an average of 0.41. Remarkably, in contrast to most out-of-sample studies we see very limited ‘out-of-sample’ decay of factor premiums.

In terms of statistical significance and p-hacking perspectives, 19 of the 24 t-values are above 3.0,19 Bayesian p-values are below 5%, and the break-even prior odds generally need to be above 9,999 to have less than 5% probability that the null hypothesis is true."


Are you looking for more strategies to read about? Check http://quantpedia.com/Screener

Do you want to see performance of trading systems we described? Check http://quantpedia.com/Chart/Performance

Do you want to know more about us? Check http://quantpedia.com/Home/About


Follow us on:

Facebook: https://www.facebook.com/quantpedia/

Twitter: https://twitter.com/quantpedia


Continue reading

Fund Flows of Active Funds Significantly Affect Value and Size Factors

27.February 2019

A new academic paper related to:

#25 – Size Factor
#26 – Value (Book-to-Market) Factor

Authors: Hung, Song, Xiang

Title: Fragile Factor Premia

Link: https://papers.ssrn.com/sol3/papers.cfm?abstract_id=3312837

Abstract:

We demonstrate that returns and volatilities of the Fama-French size and value factors are significantly determined by non-fundamental flow-induced trading from actively managed equity mutual funds. Mutual fund flows are largely ignorant about systematic risks. These non-fundamental shifts in demand induce large return heterogeneity within and across the Fama-French size and book-to-market portfolios. We show that aggregate mutual fund flow- induced trades across the size and book-to-market spectrum significantly influence the size and value premia, followed by large subsequent reversals. We also find that the expected volatilities of mutual funds’ flow-induced trades strongly predict future factor volatilities. Our results highlight the importance of non-fundamental demand shocks in determining factor premia and factor volatilities.

Notable quotations from the academic research paper:

"Mutual fund trading has a considerable price impact on individual stocks. However, some more recent work suggests that mutual fund investors are largely ignorant about systematic risks, when allocating capitals among mutual funds. Empirically, it remains unclear how trades induced by the non-fundamental mutual fund flows impact returns and volatilities of size and value, the two prominent factors. This paper aims to fi ll this gap.

In our study, we use a bottom-up approach and estimate mutual fund flow-induced trading (FIT) for each stock-quarter from 1980 to 2017. In a nutshell, FIT measures the magnitude of flow-driven trading by the aggregate equity mutual fund industry on a particular stock in a given quarter. We use FIT rather than the entire realized trading of mutual funds because FIT only captures those trades that are driven by the demand shifts from mutual fund investors, which are largely ignorant about fundamentals

Fund flows

Our main fi ndings are as follows.

We fi nd that returns of the six FF size and book-to-market portfolios are largely determined by the uninformed mutual fund flow-induced trades. Within each of the six FF portfolios, stocks with higher FIT have higher return performance.

Mutual funds' flow-driven trades can even revert the positive size and value premia. That is, within the same book-to-market portfolios, we find large-cap stocks with above-median FIT outperform small-cap stocks with below-median FIT. Within the same size portfolios, growth stocks with above-median FIT outperform value stocks with below-median FIT.

Value & Size Factor

We decompose the value minus growth returns (HML) into two components: (i) value-inflow minus growth-outflow returns (HMLInflow) and (ii) value-outflow minus growth-inflow (HMLOutflow). We decompose the small minus big returns (SMB) into the sum of (i) small-inflow minus big-outflow returns (SMBInflow) and (ii) small-outflow minus big-inflow returns (SMBOutflow). Figure 2 report the average monthly returns and alphas of SMB, HML, and their inflow and outflow components.

In sum, we find that the size premium is due to the component of small-inflow stocks minus big-outflow stocks, while the value premium is due to the component of value-inflow stocks minus growth-outflow stocks."


Are you looking for more strategies to read about? Check http://quantpedia.com/Screener

Do you want to see performance of trading systems we described? Check http://quantpedia.com/Chart/Performance

Do you want to know more about us? Check http://quantpedia.com/Home/About


Follow us on:

Facebook: https://www.facebook.com/quantpedia/

Twitter: https://twitter.com/quantpedia


Continue reading

Why Is Allocation to Trend-Following Strategy So Low?

21.February 2019

Related to all trendfollowing strategies:

Authors: Dugan, Greyserman

Title: Skew and Trend Aversion

Link: https://papers.ssrn.com/sol3/papers.cfm?abstract_id=3315719

Abstract:

Despite evidence of the benefits to portfolio Sharpe ratio and variance, actual investor allocations to Trend Following strategies are typically 5% or less. Why is there such a significant discrepancy between the optimal allocation and actual allocation to Trend? We investigate known behavioral biases as a potential reason. While decision makers have other reasons to exclude Trend Following from their portfolios, in this paper, we explore loss aversion, recency bias, and the ambiguity effect as they pertain to Trend Following, and we call the combination of the three Trend Aversion. We quantify Trend Aversion and show that these biases are a viable explanation for suboptimal allocations to Trend. We demonstrate a direct connection between quantifications of known behavioral biases and current suboptimal allocations to Trend Following. Recognition of these relationships will help highlight the pitfalls of behavioral biases.

Notable quotations from the academic research paper:

"Investors may have reasons for excluding Trend Following from their portfolios ranging from time-horizon for performance, to drawdowns, to potential capacity issues. However, the strategy's long performance history shows that a meaningful allocation would have increased portfolio Sharpe ratio and reduced portfolio variance, and yet typical investments remain at or below 5%. Some investors have no exposure.

The strategy's quantitative nature, positive skew, and frequent but small losses act in concert to trigger loss aversion, recency bias, and the ambiguity e ffect. We call the combination of the three Trend Aversion.

Sharpe ratio vs. Fraction invested in Trend


Our results show Trend Aversion is a viable explanation of suboptimal allocations to Trend Following. Decades of psychological research show that people mentally inflate losses by a factor of two. In this paper, we demonstrated that a loss multiplier between 1.5 and 2.5 would cause the typical allocation to Trend of 5% in a simple two asset portfolio, in an 11-asset portfolio with random allocations, and in two other 11-asset portfolio constructions with dynamic allocations. We showed that loss aversion can decrease allocators Sharpe ratios by up to 50%. Using lookback windows in a dynamically allocated portfolio, we demonstrated that recency bias drives down allocations to Trend. Finally, we showed that combinations of loss aversion and recency bias also drive Trend allocations to suboptimal levels.

Many investors who are subject to Trend Aversion as a practical matter, for example due to investment committees or reporting structures, are unsure of how to balance Trend Aversion with the bene ts of Trend Following to reach an allocation decision. By establishing a methodology to optimize allocations under loss aversion, we provide a framework which investors can use to formalize their allocation decisions. Investors who are subject to typical loss aversion should permanently allocate at least 5% to Trend Following, while investors whose loss aversion is lower can benefi t substantially by allocating materially more than 5%."


Are you looking for more strategies to read about? Check http://quantpedia.com/Screener

Do you want to see performance of trading systems we described? Check http://quantpedia.com/Chart/Performance

Do you want to know more about us? Check http://quantpedia.com/Home/About


Follow us on:

Facebook: https://www.facebook.com/quantpedia/

Twitter: https://twitter.com/quantpedia


Continue reading

Authoritarian Countries Have Inflated GDP

13.February 2019

There has been the shadow of suspicion that autocratic regimes are slightly manipulating GDP growth numbers. A recent academic paper offers interesting idea how to double check suspicious claims of growth …

Authors: Martinez

Title: How Much Should We Trust the Dictator's GDP Growth Estimates?

Link: https://papers.ssrn.com/sol3/papers.cfm?abstract_id=3093296

Abstract:

I study the manipulation of GDP growth statistics in non-democracies by comparing the self-reported GDP figures to the nighttime lights recorded by satellites from outer space. I show that the night-lights elasticity of GDP is systematically larger in more authoritarian regimes. This autocracy gradient in the elasticity is not explained by potential differences in a large set of factors, including economic structure and levels of development, across countries with different forms of government. The gradient is larger when countries have a stronger incentive to exaggerate economic performance or when the institutions that constrain the manipulation of official statistics are weaker. I estimate that the most authoritarian regimes inflate yearly GDP growth rates on average by a factor of 1.15-1.3 and show that correcting for data manipulation provides a more nuanced view on the economic success of non-democracies in recent years.

Notable quotations from the academic research paper:

"Governments themselves usually produce economic estimates, which gives rise to a moral hazard problem, as they are constantly tempted to exaggerate just how well the economy is doing. GDP stands out in this regard as perhaps the most widely used measure of economic activity. As such, it is probably the most profi table for governments to manipulate.

This paper uses nighttime luminosity to detect and measure the manipulation of GDP growth statistics in non-democracies. GDP and nighttime lights provide complementary measures of economic activity, but while GDP is self-reported by governments and prone to manipulation, night lights are recorded by satellites from outer space and are much less vulnerable. Using panel data for 179 countries between 1992 and 2008, I study the relationship between reported GDP figures and nighttime lights across political regimes. In particular, I examine whether the same amount of growth in lights translates into systematically larger amounts of GDP growth in autocracies than in democracies.

The main result of the paper is that the night-lights elasticity of GDP is signi ficantly larger in more autocratic regimes. In other words, I find that a constant amount of growth in lights translates into higher reported GDP growth in autocracies than in democracies. A large battery of further robustness tests indicates that the autocracy gradient in the night-lights elasticity of GDP is not driven by cross-country di erences in other factors that may be potentially correlated with regime type, including geography, economic structure or levels of development.

The observed magnitude of the variation in the night-lights elasticity of GDP across regimes is substantial. The results indicate that the most authoritarian governments inflate yearly GDP growth by a factor of 1.15-1.3. I use these estimates to adjust the long-run growth rates for data manipulation in autocracies. This adjustment has important implications for our understanding of relative economic performance at the turn of the XXI century.


fastest growing countries

"


Are you looking for more strategies to read about? Check http://quantpedia.com/Screener

Do you want to see an overview of our database of trading strategies? Check https://quantpedia.com/Chart

Do you want to know how we are searching new strategies? Check https://quantpedia.com/Home/How

Do you want to know more about us? Check http://quantpedia.com/Home/About


Follow us on:

Facebook: https://www.facebook.com/quantpedia/

Twitter: https://twitter.com/quantpedia

Continue reading

Subscribe for Newsletter

Be first to know, when we publish new content


    logo
    The Encyclopedia of Quantitative Trading Strategies

    Log in

    MORE INFO
    We boasts a total prize pool of $15,000
    Gain a Share of a Total Prize Pool of $15.000
    MORE INFO
    $15.000
    Gain a Share of a Total Prize Pool