EquitesLab Out-Of-Sample Test of F-Score and Equity Reversal Strategy

7.June 2018

We would again like to present a very interesting cooperation, this time with a guys from EquitiesLab.

They too started to analyze some of Quantpedia's suggested strategies. The first article (https://www.equitieslab.com/f-score-and-short-term-reversals/) analyzes a combination of a well-known fundamental Piotrovski's F-Score strategy with a Short-Term Reversal (see Combining Fundamental FSCORE and Equity Short-Term Reversals for details). Combined strategy shows nice outperformance since year 2000. A long-short strategy trails a strong S&P 500 performance during last few years, but it can be expected in such strong bull market. However, probably the most interesting feature is strategy's outperformance during crisis years like 2001, 2002, 2008 and 2011:

Strategy's performance


Are you looking for more strategies to read about? Check http://quantpedia.com/Screener

Do you want to see performance of trading systems we described? Check http://quantpedia.com/Chart/Performance

Do you want to know more about us? Check http://quantpedia.com/Home/About


Follow us on:

Facebook: https://www.facebook.com/quantpedia/

Twitter: https://twitter.com/quantpedia

Continue reading

Currency Management with FX Style Factors

5.June 2018

A new financial research paper has been published and it is related to:

#5 – FX Carry Trade
#8 – FX Momentum
#9 – FX Value – PPP Strategy

Authors: Lohre, Kolrep

Title: Currency Management with Style

Link: https://papers.ssrn.com/sol3/papers.cfm?abstract_id=3175387

Abstract:

Currency hedging is often approached with an all-or-nothing mentality: either full hedging of all foreign exchange (FX) positions or no hedging at all. As a more nuanced alternative, we suggest systematically harvesting the benefits of the FX style factors carry, value and momentum. In particular, we demonstrate how these factors can expand the opportunity set of traditional asset allocation when pursuing either FX factor-based tail-hedging or return-seeking strategies.

Notable quotations from the academic research paper:

"There are good reasons to believe that the optimal currency hedge lies between the two extremes of a full hedge and no hedge at all. We believe that it pays off to have a closer look at currency style factors for determining a beneficial currency allocation.

FX style factors vis-à-vis multi-asset classes We will now demonstrate the mean-variance properties of FX style factors relative to traditional asset classes. Figure 1 depicts a mean-variance diagram of the three FX style factors carry, value and momentum, as well as five traditional asset classes as given by US equity, US Treasuries, US corporate bonds (investment grade and high yield).

FX style factors

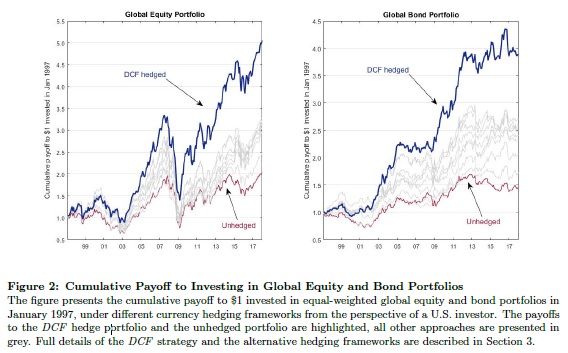
First, we inspect the investment opportunity set of traditional multi-asset investors based solely on the latter five asset classes. In particular, we take the perspective of a EUR investor who is fully hedging USD/EUR exposure. The left chart in figure 2 shows the ensuing mean-variance allocations along the efficient frontier for the five multi-assets only. Going from left to right, we learn that a more defensive investor would have allocated towards government
bonds, whereas the latter allocation for less riskaverse investors gives way to investment grade and high yield credit positions.

FX style factors 2

Second, adding the three FX style factors to the mix would significantly expand investors’ opportunity set. The ensuing efficient frontier including FX styles shifts considerably to the northwest compared to the multi-asset-only allocation. Obviously, the inclusion of the FX carry and value factors is expanding the portfolio return perspective. Still, judging from the corresponding mean-variance allocations, we learn that all three FX style factors crucially enhance the tail-hedging capabilities of any multi-asset investor, as demonstrated by their large portfolio weights in the minimum-variance portfolio. While FX momentum does play a role, especially for very defensive allocations, we see that FX value is beneficial across the whole spectrum of risk profiles. Likewise, allocation to the FX carry trade replaces some of the high yield allocation, reflecting its close association with genuine equity and credit risk. and commodities."


Are you looking for more strategies to read about? Check http://quantpedia.com/Screener

Do you want to see performance of trading systems we described? Check http://quantpedia.com/Chart/Performance

Do you want to know more about us? Check http://quantpedia.com/Home/About


Follow us on:

Facebook: https://www.facebook.com/quantpedia/

Twitter: https://twitter.com/quantpedia
Continue reading

Short-Term Return Reversals and Intraday Transactions

29.May 2018

A new financial research paper has been published and is related to:

#31 – Short Term Reversal in Stocks

Authors: Miwa

Title: Short-Term Return Reversals and Intraday Transactions

Link: https://papers.ssrn.com/sol3/papers.cfm?abstract_id=3174484

Abstract:

I examine whether a short-term reversal is attributed to past intraday or overnight price movements. The results show that intraday returns significantly reverse in the following week, while overnight returns do not, indicating that the short-term reversal is attributed to past intraday price movements. In addition, the reversal of intraday returns is stronger for more illiquid stocks and during more volatile market conditions, while the reversal is unaffected by fundamental news. This result supports the view that short-term reversals are attributable mainly to price concessions for liquidity providers to absorb intraday uninformed transactions, rather than intraday price reactions to fundamental information.

Notable quotations from the academic research paper:

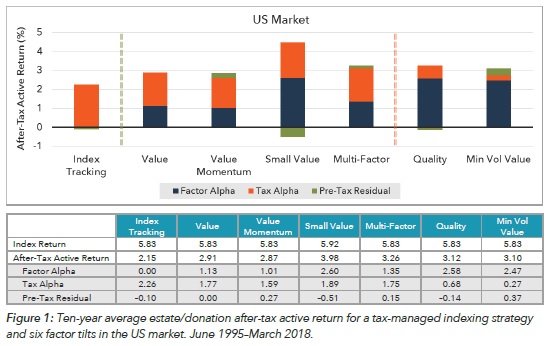
"In this study, I advance the understanding of drivers of short-term return reversals by a careful examination of when temporal price mispricing or concessions, resulting in short-term reversals, accrue. In particular, I decompose short-term return reversals into reversal of overnight return and that of intraday returns.

Though I am the first to decompose short-term return reversals in this way, such a decomposition is natural, because these two periods differ along several key dimensions. Fama (1965) shows that volatility is higher during trading hours (intraday) than it is during non-trading hours (overnight), and Kelly and Clark (2011) suggest that overnight stock returns are, on average, higher than intraday returns. Thus, decomposing return reversals into overnight and intraday return components could yield new and important information on the drivers of the short-term return reversal.

I find that short-term return reversal is mainly attributed to reversal of lagged intraday returns. In other words, intraday returns significantly reversed in the following week, while overnight returns do not. These results hold strongly in each international sample (i.e., US stocks, Japanese stocks, UK stocks, and Eurozone stocks). Even after excluding one-day returns in order to avoid the bid-ask bias, the strong intraday return reversal remains. Furthermore, this finding is robust to a variety of controls and risk-adjustments.

The two competing explanations for short-term reversals raise the question of whether the reversal of intraday returns results from a reaction to new information which occurs intraday, or from a price concession to absorb intraday transactions.

I attempt to address this question in two steps. I first examine whether the negative association between intraday returns and subsequent returns is stronger arounf fundamental news. If a reversal of intraday returns is attributed to a price reaction to fundamental news which occurs intraday, the negative association should be strengthened by the existence of fundamental news.

Then I analyze whether a reversal of intraday returns is stronger when liquidity providers request higher compensation. To this end, I examine whether the reveral of intraday returns is associated with a volatility index.

The analysis reveals that reversals of intraday returns are not stronger around news, indicating that the overreaction explanation is not plausible for the short-term reversals. On the other hand, reversals of intraday returns are stronger for illiquid stocks and when the volatility index is higher. These results support the view that reversals of intraday returns are attributed to price concessions that enable liquidity providers to absorb intraday transactions. The finding supports the lliquidity explanation."


Are you looking for more strategies to read about? Check http://quantpedia.com/Screener

Do you want to see performance of trading systems we described? Check http://quantpedia.com/Chart/Performance

Do you want to know more about us? Check http://quantpedia.com/Home/About


Follow us on:

Facebook: https://www.facebook.com/quantpedia/

Twitter: https://twitter.com/quantpedia
Continue reading

Interesting Insights into Trend-Following Strategies

23.May 2018

Related to all trendfollowing strategies:

Authors: Sepp

Title: Trend-Following Strategies for Tail-Risk Hedging and Alpha Generation

Link: https://papers.ssrn.com/sol3/papers.cfm?abstract_id=3167787

Abstract:

Because of the adaptive nature of position sizing, trend-following strategies can generate the positive skewness of their returns, when infrequent large gains compensate overall for frequent small losses. Further, trend-followers can produce the positive convexity of their returns with respect to stock market indices, when large gains are realized during either very bearish or very bullish markets. The positive convexity along with the overall positive performance make trend-following strategies viable diversifiers and alpha generators for both long-only portfolios and alternatives investments.

I provide a practical analysis of how the skewness and convexity profiles of trend-followers depend on the trend smoothing parameter differentiating between slow-paced and fast-paced trend-followers. I show how the returns measurement frequency affects the realized convexity of the trend-followers. Finally, I discuss an interesting connection between trend-following and stock momentum strategies and illustrate the benefits of allocation to trend-followers within alternatives portfolio.

Notable quotations from the academic research paper:

"Key takeaways:

1. The skewness and the convexity of strategy returns with respect to the benchmark are the key metrics to assess the risk-profile of quant strategies. Strategies with the significant positive skewness and convexity are expected to generate large gains during market stress periods and, as a result, convex strategies can serve as robust diversifiers. Using benchmark indices on major hedge fund strategies, I show the following.
– While long volatility hedge funds produce the positive skewness, they do not produce the positive convexity.
– Tail risk hedge funds can generate significant skewness and convexity, however at the expense of strongly negative overall performance.
– Trend-following CTAs can produce significant positive convexity similar to the tail risk funds and yet trend-followers can produce positive overall performance delivering alpha over long horizons.

Skewness of monthly returns of Quant Hedge Fund strategies

2. Trend-following strategies adapt to changing market condition with the speed of changes proportional to the trend smoothing parameter for the signal generation. As result, when we measure the realized performance of a trend-following strategy, the return measurement frequency should be low relative to the expected rebalancing period of the trend-following strategy. Using the data of SG Trend-following CTAs index, I show that trend-followers are expected to produce both the positive skewness and convexity for monthly, quarterly and annual returns. As a result, trend-following strategies should not be seen as diversifiers for short-term risks measured on the scales less than one month. Overall, I recommend applying quarterly returns for the evaluation of the risk-profile of a trend-following strategy.

Betas of SG Trend following CTAs to S&P 500 Index

3. By analyzing quarterly returns on the SG trend-following CTAs index conditional on the quantiles of quarterly returns on the S&P 500 index, I show that trend-following CTAs can serve as diversifiers of the tail risk. On one hand, the trend-followers generate significant positive average returns with positive skewness conditional on negative returns on the S&P 500 index. On the other hand, the trend-followers generate large positive returns, but with insignificant skewness conditional on large positive returns on the S&P 500 index. Conditional on index returns in the middle of the distribution during either range-bound or slow up-drifting markets, the trend-followers generate negative returns yet with significant positive skewness.

Quarterly Returns on SG Trend Following CTAs

4. The nature of trend-followers is to benefit from markets where prices and returns are auto-correlated, which implies the persistence of trends over longer time horizons. I present the evidence that the recent underperformance of trend-followers since 2011 to 2018 could be explained because the lag-1 autocorrelation of monthly and quarterly returns on the S&P 500 index become significantly negative in this sample period. The negative autocorrelation indicates the presence of the mean-reverting regime, even though the overall drift is positive, in which trend-followers are not expected to outperform. I introduce an alternative measure of the autocorrelation that can be applied to test for the presence of autocorrelation in short sample periods. I show that my autocorrelation measure has a strong explanatory power for returns on SG trend-following CTAs index.

Average Quartlerly returns of Trend Following CTAs

5. To quantify the relationship between the trend smoothing parameter, which defines fast-paced and slow-paced trend-followers, and the risk profile of fast-paced and slow-paced trend-followers, I create a quantitative model for a trend-following system parametrized by a parameter of the trend smoothing and by the frequency of portfolio rebalancing. The back-tested performance from my model has a significant correlation with both BTOP50 and SG trend-following CTAs indices from 2000s using the half-life of 4 months for the trend smoothing.

Position sizing

6. Using the trend system parametrized by the half-life of the trend smoothing, I analyze at which frequency of returns measurement the trend-following strategy can generate the positive convexity. The key finding is that the trend-following system can generate the positive convexity when the return measurement period exceeds the half-life of the trend smoothing and the period of portfolio rebalancing. I recommend the following.
– If a trend-following strategy is sought as a tail risk hedge with a short-time horizon of about a quarter, allocators should seek for trend-followers with relatively fast smoothing of signals with the average half-life less than a quarter.
– If a trend-following strategy is sought as an alpha strategy with a longer-time horizon, allocators should seek for trend-followers with medium to low smoothing of signals with the average half-life between a quarter and a year.
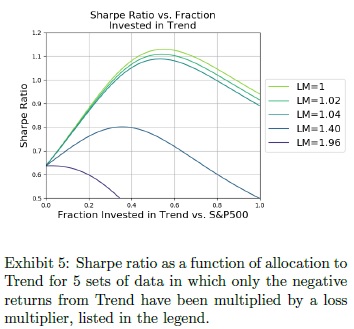
An alternative way to interpret the speed of the trend smoothing is to analyze the trend-following strategy beta to the underlying asset. For the slow-moving smoothing, the strategy maintains the long exposure to the up-trending asset with infrequent rebalancing. As a result, the higher is the half-life of the trend smoothing, the higher is the beta exposure to the index. Thus, while fast-paced trend-followers can provide better protection during sharp short-lived reversals, they suffer in periods of choppy markets. There is an interesting article on Bloomberg that some of fast-paced trend-following CTAs fared much better than slower-paced CTAs during the reversal in February 2018.

Linear Beta of S&P 500 Trend Following strategies

7. I examine the dependence between returns on the trend-following CTAs and on the market-neutral stock momentum. I show that the trend-followers have a stronger exposure to the autocorrelation factor and a smaller exposure of higher-order eigen portfolios. As a result, the trend-following CTAs produce the positive convexity while stock momentum strategies generate the negative convexity of their returns.

Strategy Betas to Principal Eigen Portfolios

8. The allocation to trend-following CTAs within a portfolio of alternatives can significantly improve the risk-profile of the portfolio. In the example using HFR Risk-parity funds and SG trend-following CTAs index, the 50/50 portfolio equally allocated to Risk-parity funds and trend-following CTAs produces the drawdown twice smaller than the portfolio fully allocated to Risk-parity funds. The 50% reduction in the tail risk is possible because the occurrence of the drawdowns of Risk-parity HFs and Trend-following CTAs are independent. While trend-followers tend to have lower Sharpe ratios than Risk-parity funds, trend-followers serve as robust diversifiers with 50/50 portfolio producing the same Sharpe ratio but with twice smaller drawdown risk.

Sharpe Ratio vs Maximum Drawdown

"


Are you looking for more strategies to read about? Check http://quantpedia.com/Screener

Do you want to see performance of trading systems we described? Check http://quantpedia.com/Chart/Performance

Do you want to know more about us? Check http://quantpedia.com/Home/About


Follow us on:

Facebook: https://www.facebook.com/quantpedia/

Twitter: https://twitter.com/quantpedia


Continue reading

Do Hedge Funds Ride Market Irrationality or Bet Against It ?

14.May 2018

A nice peak into the hedge funds industry kitchen. At the end, it is an additional evidence that a lot of hedge funds are trend-followers. And the main reason is that they are more successful because of it :

Authors: Liang, Zhang

Title: Do Hedge Funds Ride Market Irrationality?

Link: https://papers.ssrn.com/sol3/papers.cfm?abstract_id=3018483

Abstract:

We document significant evidence that hedge funds temporarily ride rather than attack high market irrationality but neither ride irrationality in the long run nor ride low irrationality. Hedge funds actively ride market irrationality during the formation period of the tech bubble in 2000 but not during the formation period of the housing bubble in 2007. Irrationality-riding funds outperform irrationality-attacking funds by 4.4% per year on a risk-adjusted basis. This outperformance is attributed to irrationality-riding during high irrationality periods-the formation period of the tech-bubble, and the bursting period of the housing bubble. The adoption of irrationality riding strategy is related to manager skill as well as investment styles. Our results are consistent with the behavioral theories that sophisticated investors ride rather than attack unsophisticated investors’ strong misperception. Finally, we do not find that mutual fund managers have the irrationality riding ability.

Notable quotations from the academic research paper:

"The conventional efficient market hypothesis (e.g., Freidman, 1953; Fama, 1965; Fama and French, 1996; Ross, 2001) suggests that rational investors attack market irrationality by conducting arbitrage trades to correct mispricing quickly and profit from their attacking strategy.

In contrast, behavioral studies (e.g., Delong, Shleifer, Summers and Waldman, 1990b; Abreu and Brunnermeier, 2002, 2003; Dumas, Kurshev and Uppal, 2009; Mendel and Shleifer, 2012) claim that rational investors choose to temporarily ride rather than attack noise traders’ high irrationality because the corresponding arbitrage may not be implementable. More interestingly, the behavior theory predicts that riding funds outperforms attacking funds, which is opposite to the conventional efficient market hypothesis theory.

This goal of this study is to distinguish the above two opposing views by empirically testing whether hedge funds, as rational investors, ride noise traders’ high irrationality in short run. Using a large sample of 5,617 equity-oriented hedge funds from the Lipper TASS database over the period from January 1994 to December 2013, we examine whether hedge fund managers ride or attack noise traders’ irrationality, by comparing the percentage of irrationality-riding funds with the portion of irrationality-attacking funds.

Following convention in the noise trading literature, we choose the noise trader sentiment index approximated by the Index of Consumer Sentiment from the University of Michigan as our base proxy for market-wide irrationality.2 We measure irrationality-riding via the timing coefficient in the conventional market timing models. Both the efficient market hypothesis and behavioral theory imply that hedge funds riding market irrationality should have significantly positive coefficients on the interaction term of the market index and the sentiment index, while funds that attack irrationality should have negative coefficients to offset the effect of irrationality on stock prices.

Out of the entire sample, about 20% of hedge fund managers have t-statistics of the riding coefficients equal to or greater than 1.65. The portion of hedge funds with a t-statistic equal to or lower than -1.65 is only 4.6%. These facts suggest that hedge fund managers do not attack, but ride noise traders’ irrationality.

This distribution pattern of the t-statistic significantly varies across investment styles. For example, 62.5% of multi-strategy funds and 35% of global macro funds adopt irrationality-riding strategy but the fraction of irrationality-riding funds among equity market neutral, convertible arbitrage or event driven funds is trivial. Moreover, the fraction of hedge funds with a t-statistic of riding coefficient equal to or greater than 1.65 is 31.4% during the high irrationality periods and is reduced to 17.0% during the lower irrationality periods. This fraction is 32.4% during normal time and 14.4% during the period of two financial crises, including the tech bubble crisis from March 2000 to December 2002 and the subprime crisis from June 2007 to December 2009. Hedge funds actively ride market irrationality during the tech bubble formation period from January 2000 to February 2000, but not during the housing bubble formation period from January 2005 to May 2007. Hedge fund managers do not show meaningful propensity to ride market irrationality in the long run either. The proportion of funds that choose to ride the 12-month leading market irrationality is smaller than the proportion that chooses to attack.

Further, we investigate whether hedge funds’ irrationality-riding choice is attributed to randomness or skill. In sum, our empirical results are consistent with the behavioral theory but not with the efficient market theory. We conclude that hedge fund managers choose to ride high market irrationality in the short run but to attack it in the long run.

Given the fact that market irrationality-riding is generally adopted by hedge funds, we examine whether this strategy is economically significant by comparing the performance of irrationality-riding funds with irrationality-attacking funds in subsequent periods.

The performance difference between the riding and attacking funds in the subsequent periods is consistent with the behavioral predictions but against the predictions of the efficient market hypothesis. The Fung and Hsieh (2004) seven-factor alpha delivered by the riding portfolio is at least 0.31 % per month, or equivalently 3.7% per year, significantly higher than that of the attacking portfolio over the subsequent one to twelve months. The risk-adjusted outperformance of the riding funds relative to the attacking funds in next one month is 0.49% (t-stat=12.02) during the high irrationality periods and -0.03% (t-stat=-0.90) during the low irrationality periods."


Are you looking for more strategies to read about? Check http://quantpedia.com/Screener

Do you want to see performance of trading systems we described? Check http://quantpedia.com/Chart/Performance

Do you want to know more about us? Check http://quantpedia.com/Home/About


Follow us on:

Facebook: https://www.facebook.com/quantpedia/

Twitter: https://twitter.com/quantpedia


Continue reading

Seasonal Strategy on US Equities + Genovest tests Quantpedia’ strategy

8.May 2018

A new financial research paper has been published and is related to:

#31 – Market Seasonality Effect in World Equity Indexes
#41 – Turn of the Month in Equity Indexes
#75 – Federal Open Market Committee Meeting Effect in Stocks

Authors: Hull, Bakosova, Kment

Title: Seasonal Effects and Other Anomalies

Link: https://papers.ssrn.com/sol3/papers.cfm?abstract_id=3165669

Abstract:

We revisit a series of popular anomalies: seasonal, announcement and momentum. We comment on statistical significance and persistence of these effects and propose useful investment strategies to incorporate this information. We investigate the creation of a seasonal anomaly and trend model composed of the Sell in May (SIM), Turn of the Month (TOM), Federal Open Market Committee pre-announcement drift (FOMC) and State Dependent Momentum (SDM). Using the total return S&P 500 dataset starting in 1975, we estimate the parameters of each model on a yearly basis based on an expanding window, and then proceed to form, in a walk forward manner, an optimized combination of the four models using a return to risk optimization procedure. We find that an optimized strategy of the aforementioned four market anomalies produced 9.56% annualized returns with 6.28% volatility and a Sharpe ratio of 0.77. This strategy exceeds that Sharpe ratio of Buy-and-Hold in the same period by almost 100%. Furthermore, the strategy also adds value to the previously published market-timing models of Hull and Qiao (2017) and Hull, Qiao, and Bakosova (2017). A simple strategy which combines all three models more than doubles the Sharpe ratio of Buy-and-Hold between 2003-2017. The combined strategy produces a Sharpe ratio of 1.26, with annualized returns of 18.03% and 13.26% volatility. We publish conclusions from our seasonal trend and anomaly model in our Daily Report.

Notable quotations from the academic research paper:

"In this paper we combine seasonal anomalies, Fed announcement and trend in a walk forward way. Numerous papers present compelling evidence on seasonal effects of the market, with Turn of the Month and the Halloween effect being the most convincing. At the same time there appears to be an excess return prior to Fed meetings. We combine these effects with the new trend indicator to create an effectiv emodel that beats Buy-and-Hold. This Seasonal Anomaly and Trend Model is then combined in an ensemble with other market timing models into an even more powerful strategy.

We start with four robust seasonal anomalies, and propose a simple deterministic trading strategy for each. Then we introduce a few different options of combining these four strategies. First, we look at the mean-variance optimization algorithm (Markowitz 1952), and second, we perform a grid search on model weights to look for optimal combination of signals rather than using portfolio optimization. Last, we also consider a simple equal weight portfolio for comparison. The results are as follows. From 1976 to 2017, the equally weighted model produces the highest Sharpe ratio (0.89 compared to 0.77 of the grid search algorithm and 0.80 for the mean-variance algorithm). However, the grid search model produces the highest Sharpe ratio of 0.84 in more recent period (1996-2017), compared to 0.82 and 0.78 for equal weight and mean-variance algorithm respectively. The univariate strategies are restricted to be between 0% and 150% invested in S&P 500, with the exception of the trend model which is capped between -50% and 150%. We maximize the backtested Sharpe ratio in our analysis, since this metric is rather invariant to scaling. Investors wishing to deploy these models in their portfolios can subsequently choose their level of leverage based on their risk preferences.

The seasonal trend model also enhances the market-timing models of Hull and Qiao (2017) and Hull, Qiao, and Bakosova (2017). A simple strategy which combines all three models almost triples the Sharpe ratio of Buy-and-Hold between 2003-2017. The combined strategy produces a Sharpe ratio of 1.26, with annualized returns of 18.03% and 13.26% volatility.

Figure 13 shows the wealth accumulation of the combined strategy relative to Buy-and-Hold. The outperformance is not economically significant in the bull market of the early 2000s but becomes more pronounced in the volatile period during the Global Financial Crisis (GFC) and in the jittery markets of 2011-2012.

Wealth accumulation of combined seasonal trading strategy

"


Quantpedia & Genovest cooperation

We started a very interesting cooperation with a guys from Genovest. They started to analyze some of Quantpedia's suggested strategies. The first article analyzes a well-known Graham's Net Current Asset Value strategy and shows that the strategy has not lost its outperformance during the last few years:

https://genovest.com/blog/putting-quantpedia-to-the-test/

Net Current Asset Value strategy

The strategy's rules are really simple. Investor only buy stocks with NCAV (net current asset value, as defined by Graham, is current assets minus all liabilities, divided by the number of shares outstanding) over 1.5, exclude lightly-regulated companies, and exclude companies in the financial sector. The portfolio of stocks is formed annually in July, and held for one year with equal weighting.

We are looking forward to any new strategy's backtest …


Are you looking for more strategies to read about? Check http://quantpedia.com/Screener

Do you want to see performance of trading systems we described? Check http://quantpedia.com/Chart/Performance

Do you want to know more about us? Check http://quantpedia.com/Home/About


Follow us on:

Facebook: https://www.facebook.com/quantpedia/

Twitter: https://twitter.com/quantpedia
Continue reading
Subscription Form

Subscribe for Newsletter

 Be first to know, when we publish new content
logo
The Encyclopedia of Quantitative Trading Strategies

Log in