Persistence in Cryptocurrencies

29.December 2017

Cryptocurrencies are at the moment very popular, therefore we decided to point on a short research paper showing interesting cryptos' characteristic – persistence:

Authors: Caporale, Gil-Alana, Plastun

Title: Persistence in the Cryptocurrency Market

Link: https://papers.ssrn.com/sol3/papers.cfm?abstract_id=3084023

Abstract:

This paper examines persistence in the cryptocurrency market. Two different longmemory methods (R/S analysis and fractional integration) are used to analyse it in the case of the four main cryptocurrencies (BitCoin, LiteCoin, Ripple, Dash) over the sample period 2013-2017. The findings indicate that this market exhibits persistence (there is a positive correlation between its past and future values), and that its degree changes over time. Such predictability represents evidence of market inefficiency: trend trading strategies can be used to generate abnormal profits in the cryptocurrency market.

Notable quotations from the academic research paper:

"One of the key issues yet to be analysed is whether the dynamic behaviour of cryptocurrencies is predictable, which would be inconsistent with the Efficient Market Hypothesis. Long-memory techniques can be applied for this purpose.

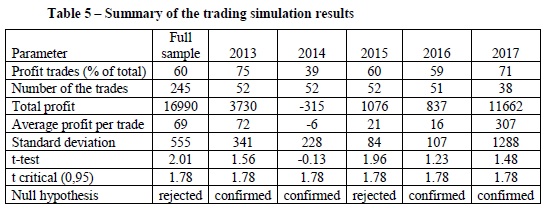
The present study carries out a more comprehensive analysis by considering four main cryptocurrencies (the most liquid ones: BitCoin, LiteCoin, Ripple, Dash) and applying two different long-memory methods (R/S analysis and fractional integration) over the period 2013-2017 to investigate their stochastic properties. Moreover, it also examines the evolution of persistence over time (by looking at changes in the Hurst exponent). Any predictable patterns could of course be used as a basis for trading strategies aimed at making abnormal profits in the cryptocurrency market.

pic1

As can be seen, the series do not follow a random walk, and are persistent, which is inconsistent with market efficiency. The most efficient cryptocurrency is Bitcoin, which is the oldest and most commonly used, as well as the most liquid. Degree of persistence varies over the time, and fluctuates around its average.

"


Are you looking for more strategies to read about? Check http://quantpedia.com/Screener

Do you want to see performance of trading systems we described? Check http://quantpedia.com/Chart/Performance

Do you want to know more about us? Check http://quantpedia.com/Home/About

Continue reading

Carry Trade Across Fixed and Floating Currency Regimes

20.December 2017

A new financial research paper related to:

#5 – FX Carry Trade

Authors: Accominotti, Cen, Chambers, Marsh

Title: Currency Regimes and the Carry Trade

Link: https://papers.ssrn.com/sol3/papers.cfm?abstract_id=3077029

Abstract:

Carry trade returns vary across fixed and floating currency regimes. Over the last century, outsized carry returns occur exclusively in the floating regime, being zero in the fixed regime. The absence of skewness in floating carry returns rules out a skewness-based explanation for this result. Fixed-to-floating regime shifts deliver negative return shocks to the floating carry strategy, even when controlling for volatility risk. This result explains average excess returns to the floating and therefore the unconditional carry trades over the long-run. We rationalize these findings with a model allowing risk compensation in currency markets to depend on regime.

Notable quotations from the academic research paper:

"Our empirical analysis exploits a new database of daily bid and offered exchange rates in spot and forward markets spanning the interval 1919-present. The year 1919 marks the dawn of modern currency trading with the emergence of a continuously traded forward market in London. Consistent with the post-Bretton Woods evidence, we find that the carry trade earns significant average returns over the whole sample period. Our estimated Sharpe ratio of between 0.5 and 0.6 is still substantial and only slightly lower than the 0.7 to 0.8 for the post-Bretton Woods sample. This finding of outsized carry returns across the whole period is robust to differing portfolio weights and to the inclusion of transaction costs. We further exploit our data to examine the dependence of carry trade returns on currency regimes by conditioning the return to the carry trade on the exchange rate regime of each currency pair at the beginning of each period.1 We classify any currency pair into a floating (fixed) regime based on whether its exchange rate volatility is above (below) a certain threshold.

pic1

pic2

Our first finding is that carry trade returns vary with exchange rate regimes. Average excess returns of the unconditional carry trade are entirely driven by returns to the carry strategy conditioned on the sample of currency pairs in the floating exchange rate regime. We term this strategy the floating carry trade. In comparison, the carry strategy conditioned on the sample of currency pairs in the fixed exchange rate regime (the fixed carry trade) generates zero returns on average. Moreover, the exchange rate of a floating currency pair tends to move according to a random walk without drift as the average spot return is close to zero and statistically insignificant. In contrast, the exchange rate of a fixed currency pair tends to move as predicted by the uncovered interest parity (UIP). Although the carry component of fixed carry trade returns is substantial at 2-3%, these gains are exactly offset by losses from spot rate depreciation when fixed exchange rate regimes collapse.

There are three other results related to our main finding regarding the regime-dependence of carry returns.

First, we find that the skewness of returns to the floating and fixed carry trade strategies in our long sample differ from the consensus view regarding skewness in the literature. In the post-Bretton Woods period, outsized carry returns display negative skewness and we confirm this result in our own sample. However, when we examine skewness of floating and fixed carry returns separately in our long sample, only the unprofitable fixed carry trade displays negative return skewness due to losses arising from the collapse of currency pegs. In contrast, the return skewness of the profitable floating carry trade is not significantly different from zero.

Second, we further explore the indirect relationship between floating carry returns and the fixed regime. We find that the more that either currency in a floating pair is in a pegged relationship with other currencies, the worse is the performance of the floating carry trade strategy.

Last, we ascertain that the variation of carry trade returns is not only related to the time-series but also the cross-section of exchange rate regimes across currency pairs.

Our second main finding is that the collapse of currency pegs has spill-over effects on floating currency pairs, thereby causing significant losses to carry traders. The January 2015 abandonment by the Swiss National Bank of its cap on the value of the franc against the euro is an example of such a collapse. The breakdown of this particular fixed exchange rate coincides with poor carry trade returns when investment currencies such as the Australian and New Zealand dollars depreciate against the pound sterling, while funding currencies such as the Japanese yen and Swiss franc appreciate. Our regression analysis verifies that this example is representative of the relationship between fixed-to-floating regime changes and negative returns to the floating carry trade.

"


Are you looking for more strategies to read about? Check http://quantpedia.com/Screener

Do you want to see performance of trading systems we described? Check http://quantpedia.com/Chart/Performance

Do you want to know more about us? Check http://quantpedia.com/Home/About

Continue reading

FX Momentum Explained via Dispersion Risk

11.December 2017

A new financial research paper related to FX Momentum strategies:

Authors: Eriksen

Title: Cross-Sectional Return Dispersion and Currency Momentum

Link: https://papers.ssrn.com/sol3/papers.cfm?abstract_id=3001681

Abstract:

This paper studies the relation between global foreign exchange (FX) return dispersion risk and the cross-section of currency momentum returns. We find robust empirical evidence that FX return dispersion is a priced risk factor and that it contains information beyond traditional factors. Currencies with high past returns (winners) load positively on dispersion innovations, whereas currencies with low past returns (losers) load negatively. Intuitively, investors demand a premium for holding past winners as they perform poorly in periods with unexpectedly low cross-sectional dispersion, while past losers provide insurance against periods with disappearing dispersion.

Notable quotations from the academic research paper:

"In this paper, we offer a risk-based explanation of currency momentum profits by showing empirically that the high returns to winner currencies can be understood as compensation for dispersion risk, which, in our setting, is defined as innovations to the cross-sectional deviation in currency market excess returns. More precisely, we find that winner currencies load positively on innovations to cross-sectional FX dispersion and perform poorly in periods with unexpectedly low cross-sectional dispersion, periods in which loser currencies provide insurance by delivering positive returns. That is, the high return to winner currencies can be understood as compensation to momentum investors for the risk of disappearing dispersion.

Our main sample of currencies comprises up to 48 countries as in Menkhoff et al. (2012) and our main results are based on momentum portfolio constructed by sorting currencies into five portfolios based on their past excess returns. Investing in the portfolio of winner currencies and shorting the portfolio of loser currencies yields large unconditional excess returns of 5.73% and 5.84% per annum for one- and three-month formation periods, respectively, after adjusting for transaction costs through bid and ask quotes.

This high return is hard to explain using traditional risk factor, but can be rationalized using dispersion risk. We construct our measure of dispersion risk as the cross-sectional deviation across five carry trade portfolios formed by sorting individual currencies into five portfolios based on their previous period’s forward discount. Using this factor, we show that the observed heterogeneity in average net excess returns across currency momentum portfolios can be explained by their different exposures to FX dispersion innovations.

Our key empirical results are as follows: i) We show that dispersion risk is priced in the cross-section of currency momentum portfolios, ii) has a significant positive price of risk, and iii) that dispersion risk is able to account for a substantial part of the heterogeneity is average momentum net excess returns.

The cross-sectional R2 exceeds 96% for one month momentum portfolios and is about 66% for three-month momentum portfolios.Moreover, we find that sorting individual currencies, where currency excess returns are signed according to their previous periods’ excess return (referred to as conditional excess returns), into five portfolios based on their ex ante exposure to dispersion innovations yields a monotonically increasing pattern of average excess returns, corroborating the fact that investors require a higher premium for investing in currencies that are more exposed to negative dispersion shocks.

"


Are you looking for more strategies to read about? Check http://quantpedia.com/Screener

Do you want to see performance of trading systems we described? Check http://quantpedia.com/Chart/Performance

Do you want to know more about us? Check http://quantpedia.com/Home/About

Continue reading

Equity Market is Efficient – But on a Long Term

4.December 2017

A new financial research paper sheds some light on a long debate abour market efficiency:

Authors: Bouchaud, Ciliberti, Lamperiere, Majewski, Seager, Ronia

Title: Black Was Right: Price Is Within a Factor 2 of Value

Link: https://papers.ssrn.com/sol3/papers.cfm?abstract_id=3070850

Abstract:

We provide further evidence that markets trend on the medium term (months) and mean-revert on the long term (several years). Our results bolster Black’s intuition that prices tend to be off roughly by a factor of 2, and take years to equilibrate. The story behind these results fits well with the existence of two types of behaviour in financial markets: “chartists”, who act as trend followers, and “fundamentalists”, who set in when the price is clearly out of line. Mean-reversion is a self-correcting mechanism, tempering (albeit only weakly) the exuberance of financial markets.

Notable quotations from the academic research paper:

"In his remarkably insightful 1986 piece called “Noise”, Fisher Black famously wrote: An efficient market is one in which price is within a factor 2 of value, i.e. the price is more than half of value and less than twice value. He went on saying: The factor of 2 is arbitrary, of course. Intuitively, though, it seems reasonable to me, in the light of sources of uncertainty about value and the strength of the forces tending to cause price to return to value. By this definition, I think almost all markets are efficient almost all of the time.

As far as we are concerned, we always believed that Black was essentially right, precisely for the argument he sketched: humans are pretty much clueless about the “fundamental” value of anything traded on markets, except perhaps in relative terms. The myth that “informed” traders step in and arbitrage away any small discrepancies between value and prices does not make much sense. The wisdom of crowds is too easily distracted by trends and panic.

In Black’s view, prices evolve pretty much unbridled in response to uninformed supply and demand flows, until the difference with value is strong enough for some mean-reversion forces to drive prices back to more reasonable levels. If Black’s uncertainty band  was – say – 0.1%, the efficient market theory (EMT) would be a very accurate representation of reality for most purposes. But if  Black’s uncertainty band = 50% or so, as Black imagined, EMT would only make sense on time scale longer than the mean-reversion time TMR. For stock indices with volatility of 20%/year one finds TMR 6 years.

The dynamics of prices within Black’s uncertainty band is in fact not random but exhibits trends: in the absence of strong fundamental anchoring forces, investors tend to under-react to news and/or take cues from past price changes themselves. This induces positive autocorrelation of returns that have been documented in virtually all financial markets. The picture that emerges, and that we test in the present study, is therefore the following: market returns are positively correlated on time scales <<TMR and negatively correlated on long time scales ~ TMR, before eventually following the (very) long term fate of fundamental value – presumably a biased geometric random walk with a non-stationary drift.

We test this idea on a large set of instruments: indexes, bonds, FX and commodity futures since 1960 (using daily data) and spot prices since 1800 (using monthly data). Our results confirm, and make more precise, Black’s intuition. We find in particular that mean-reversion forces start cancelling trend following forces after a time around 2 years, and mean-reversion appears to peak for channel widths of Black’s uncertainty band on the order of 50 to 100%, which corresponds to Black’s “factor 2”.

In a way, our results are very intuitive: mean-reversion comes as a mitigating force against trend following that allows markets to become efficient on the very long run, as anticipated by many authors. However, even highly liquid markets only equilibrate on time scales of years – and not seconds, as market efficient enthusiasts would claim.

"


Are you looking for more strategies to read about? Check http://quantpedia.com/Screener

Do you want to see performance of trading systems we described? Check http://quantpedia.com/Chart/Performance

Do you want to know more about us? Check http://quantpedia.com/Home/About

Continue reading

Do Short Selling Costs Affect the Profitability of Stock Anomalies

27.November 2017

A new financial research paper related to all long-short equity factor strategies:

Authors: Bekjarovski

Title: How Do Short Selling Costs and Restrictions Affect the Profitability of Stock Anomalies?

Link: https://papers.ssrn.com/sol3/papers.cfm?abstract_id=3066750

Abstract:

Short selling frictions cannot explain the persistence of seven prominent stock anomalies. Long-only investing is robust and profitable and can be further enhanced by using a synthetic short. Moreover, portfolios restricted to stocks that are easy to short sell continue to have large and significant short anomaly alphas. I derive cost bounds for switching between implementation methods and show that the cost associated with short anomaly positions is small relative to their profitability contribution using a proprietary database of borrowing fees. Overall, the empirical evidence does not support the implications of arbitrage asymmetry that mispricing is concentrated in short positions where it is too costly to exploit.

Notable quotations from the academic research paper:

"Historical tests of the CAPM have given rise to an abundance of anomalously priced characteristics in the cross-section of stock returns. Focus in academic work has been placed on the performance of zero-cost long-short portfolios. In practice, investment vehicles that provide anomaly exposure tend to be long-only. Evidence on the impact of short selling frictions on anomaly profitability is scarce. The goal of this paper is to fill this gap and explore the effect of short selling costs and short selling restrictions on the viability of anomaly investing.

From the point of view of practitioners, the impact of short selling frictions is relevant as it can help determine the optimal approach to anomaly investing. Should strategies be executed long-only or long-short? Alternatively, can shorting the market, rather than shorting individual securities, be used to improve between anomaly fit and the performance of anomaly combinations?

An explanation of anomalies grounded on arbitrage asymmetry implies two key hypotheses: (1) anomaly profitability should be concentrated in short positions and (2) capturing this profitability should be too costly. The paper finds evidence against both claims for seven prominent stocks anomalies. Extensive mispricing exists in long positions and short selling costs are avoidable and low relative to short position profitability. In other words, short selling frictions cannot account for the persistence of anomalies. The evidence is as follows.

Time series alphas are large and statistically significant in long-only anomaly portfolios. Moreover, the inclusion of long-only anomalies to the investment universe leads to an economically large improvement in risk-adjusted performance in portfolio analysis. Sharpe ratios go up by 32% out-of-sample and 60% in-sample relative to a traditional passive investment in the market. The improvement is significant at the 1% level. The results suggest that there is significant profitability in long-positions which is evidence against the first implication of arbitrage asymmetry that anomaly profitability should be concentrated in short positions. Even investors who do not short sell (for whatever reason) can extensively improve performance by including anomalies to their investment universe.

Is it necessary to short sell individual securities to exploit security overpricing and negative alphas? If short selling individual securities is impossible, how can we further improve upon long-only investing? In the presence of all-encompassing prohibitive shorting frictions on individual securities, the paper proposes the use of a synthetic-short strategy. The synthetic bet goes long the highest alpha decile and an intermediate portfolio whilst shorting the market. The synthetic-short approach aims to achieve two objectives. First, it removes overexposure to the equity premium which otherwise dominates long-only investing. Second, the synthetic-short approach exploits negative alphas in overvalued securities. Ideally, investors want to buy positive alpha whilst short selling negative alpha securities. In practice investors can often only easily short sell the market. In other words, investors can only easily short securities in their value-weighted proportions. A long position in a positive alpha decile combined with a market short implies a net short position on all nine remaining decile portfolios. Taking a short position on the lowest negative alpha decile portfolio is beneficial. This is the standard approach in the unrestricted long-short setting. However, short positions in intermediate portfolios can be suboptimal. In properly priced intermediate portfolios without an alpha, short positions are just redundant bets that needlessly waste capital. More problematically however, intermediate portfolios can also have a positive alpha which can be harmful to strategy profitability. To reduce this risk, I include a positive weight in the second highest alpha portfolio in the synthetic-short. The goal is to reduce the net negative weight assigned to the second highest alpha portfolio in the overall synthetic-short strategy.

The results show that using a synthetic-short improves Sharpe ratios by 40% out-of-sample and 80% in-sample relative to long-only investing. Improvements are statistically significant at the 2% level. The findings suggest that long-only investing can be extensively improved by using only a market short. The evidence goes against the second hypothesis as it shows that short position profitability can partly be exploited using a cheap execution method such as a market short.

Short selling individual securities in the short leg of anomalies is profitable in the absence of shorting costs. Short alphas capture 63% of long-short profitability. In addition, portfolio analysis shows that short selling individual securities improves the Sharpe ratio by 64% out of sample and 24% in-sample relative to the synthetic-short approach. Improvements are statistically significant at the 2% level (4% in-sample). Overall, the evidence suggests that short selling restriction on either individual securities or the market can severely reduce the profitability of anomalies. However, they do not completely annul their investment potential.

"


Are you looking for more strategies to read about? Check http://quantpedia.com/Screener

Do you want to see performance of trading systems we described? Check http://quantpedia.com/Chart/Performance

Do you want to know more about us? Check http://quantpedia.com/Home/About

Continue reading

A Few Tips for Volatility Trading

21.November 2017

A new financial research paper related to volatility selling strategies:

Authors: Sepp

Title: Gaining the Alpha Advantage in Volatility Trading

Link: https://papers.ssrn.com/sol3/papers.cfm?abstract_id=3032098

Abstract:

We present some empirical evidence for short volatility strategies and for the cyclical pattern of their P&L. The cyclical pattern of the short volatility strategies produces an alpha in good times but collapses to the beta in bad times. We introduce a factor model with risk-aversion to explain the risk-premium of short volatility strategies as a compensation to bear losses in bad market regimes. We then consider an econometric model for statistical inference of market regimes and for optimal position sizing. Finally, we illustrate model applications for generating alpha from volatility strategies.

Notable presentation slides from the academic research paper:

"

pic1

pic2

pic3

pic4

pic5

pic6

pic7

pic8

pic9

"


Are you looking for more strategies to read about? Check http://quantpedia.com/Screener

Do you want to see performance of trading systems we described? Check http://quantpedia.com/Chart/Performance

Do you want to know more about us? Check http://quantpedia.com/Home/About

Continue reading
Subscription Form

Subscribe for Newsletter

 Be first to know, when we publish new content
logo
The Encyclopedia of Quantitative Trading Strategies

Log in