Common Factor Structure in a Cross-Section of Stocks

26.January 2017

An amazing academic paper about multiple equity factor models and about the way how to pick the best one:

Authors: Cooper, Maio, Philip

Title: Multifactor Models and the APT: Evidence from a Broad Cross-Section of Stock Returns

Link: https://papers.ssrn.com/sol3/papers.cfm?abstract_id=2883765

Abstract:

We seek to describe the broad cross-section of average stock returns. We follow the APT literature and estimate the common factor structure among a large cross-section containing 278 decile portfolios (associated with 28 market anomalies). Our statistical model contains seven common factors (with an economic meaning) and prices well both the original portfolio returns and an efficient combination of these portfolios. This model clearly outperforms the empirical workhorses in the literature when it comes to pricing this broad cross-section. Augmenting the empirical models with new factor-mimicking portfolios, based on APT principles, significantly improves their performance.

Notable quotations from the academic research paper:

"The traditional workhorse in the empirical asset pricing literature the three-factor model of Fama and French (1993, 1996) (FF3 henceforth) fails to explain the new market anomalies. Moreover, the four-factor model of Carhart (1997) (C4) does a good job in capturing price momentum, but also struggles in terms of explaining some of the pro fitability- and investment-based anomalies. In response to this gap, we have witnessed the emergence of new multifactor models containing (diff erent versions of) investment and profi tability factors, in particular the five-factor model of Fama and French (2015, 2016b) (FF5) and the four-factor model of Hou, Xue, and Zhang (2015, 2016) (HXZ4). However, several dimensions of the broad cross-section of stock returns are still not explained by the new factor models. In particular, the five-factor model does not account for momentum (including industry momentum), while both of these models do not capture several profi tability and investment-based (in particular, several forms of accruals) anomalies.

Following such evidence, several questions naturally emerge in the empirical asset pricing literature: How many factors do we need, and what are these factors, to describe well the broad cross-section of stock returns? To which dimensions of the cross-section of stock returns are these factors more correlated? To what extent (and how) can we improve the current multifactor models proposed in the literature in order to achieve a better description of large-scale cross-sectional risk premia? This paper attempts at providing answers to these questions. In order to achieve this goal, we adopt the general framework of the Arbitrage Pricing Theory (APT).

We follow part of the relatively small empirical APT literature in terms of estimating common stock return factors by applying asymptotical principal components analysis (APCA) to a large cross-section of stock returns. We employ a total of 28 anomalies or portfolio sorts for a total of 278 decile portfolios. The estimation results show that there are seven common factors that are statistically signi ficant over our sample period (1972 to 2013). These seven factors cumulatively explain around 91% of the cross-sectional variations in the 278 portfolio returns. The first common factor basically captures the average anomaly and thus resembles a market factor. The other six factors capture di fferent dimensions of the large cross-section of market anomalies. In particular, the second, third, and four factors are strongly correlated with value-growth, investment, profi tability, and momentum-based anomalies. This is consistent with the role of the seven-factor model in terms of describing well this cross-section of 278 equity portfolios. This statistical model is thus a benchmark for this speci fic cross-section of stock returns, against which the existent models are compared.

We conduct cross-sectional asset pricing tests of our APT model by using the 278 equity portfolios as testing assets. The results con firm that the seven-factor model explains about 60% of the cross-sectional variation in the risk premia associated with the 278 portfolios. Moreover, most factor risk price estimates are statistically signi ficant. Across categories of anomalies, the APT does a better job in pricing value-growth and intangibles, compared to the group of investment-based anomalies. Moreover, the model prices perfectly an efficient combination of the original portfolios as indicated by the GLS cross-sectional R2 estimates around 100%. This result confi rms that the statistical model is a successful APT.

Next, we compare our APT model to some of most popular multifactor models existent in the literature in terms of pricing the 278 portfolios. The models include the already mentioned FF3, C4, HXZ4, FF5, in addition to a restricted version of FF5 that excludes HML (FF4), and the four-factor model of Pastor and Stambaugh (2003) (which includes a stock liquidity factor). The results show that only C4 and HXZ4 o ffer an economically signi ficant explanatory power for the broad cross-section of stock returns, while the fit of both FF5 and FF4 is quite small. Moreover, the performance of all the six empirical factor models clearly lags behind the fi t of the seven-factor APT, suggesting that these models have a large room for improvement in terms of describing large-scale cross-sectional risk premia.

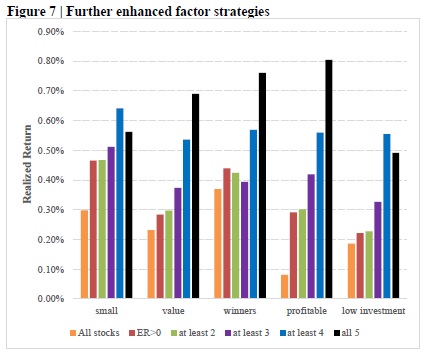
In light of such evidence, we defi ne and estimate new empirical multifactor models to better describe the broad cross-section of anomalies. All these models contain seven factors, to be consistent with our benchmark APT, and represent augmented versions of C4, HXZ4, FF5, and FF4, the best performing empirical models. The new factors in each of these models represent factor-mimicking portfolios (spreads among extreme portfolio deciles) associated with selected anomalies. These anomalies are those for which the original factors in each model do a worse job in terms of describing the time-series variation in the corresponding decile portfolio returns. Thus, our criteria for selecting the new factors relies on the APT restriction that the risk factors should explain well the time-series variation in the returns of the testing assets. The results show that adding the new factors improves all four empirical models, and helps especially the performance of both FF5 and FF4 in terms of explaining the large cross-section of stock returns. Moreover, the augmented models do a very good job in explaining an efficient combination of the original portfolios, thus, showing that they represent valid APTs. Therefore, the performance of the augmented empirical models is quite similar to that of our benchmark APT. Overall, our results indicate that there is a signi ficant room for improving the existing empirical multifactor models in terms of explaining the large cross-section of stock returns in a way that is consistent with the APT."


Are you looking for more strategies to read about? Check http://quantpedia.com/Screener

Do you want to see performance of trading systems we described? Check http://quantpedia.com/Chart/Performance

Do you want to know more about us? Check http://quantpedia.com/Home/About

Continue reading

PutWrite vs. BuyWrite Index Differences

20.January 2017

A short but interesting academic paper about differences in a well-known CBOE PutWrite and BuyWrite Indexes:

Author: Israelov

Title: PutWrite versus BuyWrite: Yes, Put-Call Parity Holds Here Too

Link: https://papers.ssrn.com/sol3/papers.cfm?abstract_id=2894610

Abstract:

The CBOE PutWrite Index has outperformed the BuyWrite Index by approximately 1.1 percent per year between 1986 and 2015. That is pretty impressive. But troubling. Yes – troubling – because the theory of put-call parity tells us that such outperformance should be almost impossible via a compelling no-arbitrage restriction. This paper explains the mystery of this outperformance, which has implications for portfolio construction.

Notable quotations from the academic research paper:

"Writing equity index covered calls is an effective approach to jointly earning the equity and volatility risk premium. So too is writing naked equity index put options. Which approach is better? Many investors compare the historical performance of the two approaches for the answer, potentially leading to the conclusion that put-writing is preferable to covered calls. On the surface, it appears that writing put options would be the preferred approach. The CBOE PutWrite Index (PUT) has outperformed the BuyWrite Index (BXM) by approximately 1.1 percent per year between 1986 and 2015. That is pretty impressive. But troubling. Yes – troubling – because the theory of put-call parity tells us that such outperformance should be almost impossible via a compelling no-arbitrage restriction.

The primary reason behind the performance difference in the PutWrite and BuyWrite Indices is due to a construction difference during just four hours per month. A quirky difference in their portfolio construction results in the PutWrite Index missing out on approximately four hours per month of S&P 500 Index return relative to the BuyWrite Index.

Each month on the morning of option expiration, both the BuyWrite’s call option and the PutWrite’s put option expire and settle at the same time at the Special Open Quotation (SOQ). At this time, option expiration fully divests the PutWrite Index of its equity exposure. Until it re-establishes a short put option position, it is a zero beta portfolio. In contrast, at the same time, the BuyWrite portfolio becomes a beta one portfolio with the expiration of its call option, because it is fully invested in the S&P 500 Index with no corresponding short call option position. It remains a beta one portfolio until it re-establishes its short call option position.

So, over this four-hour window, the BuyWrite Index is over-exposed to the S&P 500 relative to its longterm average exposure. Similarly, the PutWrite Index is under-exposed to the S&P 500 relative to its long-term average exposure.

As an example, on average, between 2004 and 2015, the S&P 500 Index was down 23 basis points on option expiration mornings. The equity returns over this four hour period 12 times per year suggests 2.7% of annual underperformance for the BuyWrite Index relative to the PutWrite Index. Adding back in the intercept (annualized) provides a combined effect of 2.0% of annualized expiration-date underperformance. This is very close to the 2.1% the BuyWrite Index underperformed the PutWrite Index over the same 2004 to 2015 period."


Are you looking for more strategies to read about? Check http://quantpedia.com/Screener

Do you want to see performance of trading systems we described? Check http://quantpedia.com/Chart/Performance

Do you want to know more about us? Check http://quantpedia.com/Home/About

Continue reading

Purifying Factor Premiums in Equity Markets

14.January 2017

An interesting academic paper related to a lot of seasonality strategies, but mainly to:

#7 – Volatility Effect in Stocks – Long-Only Version
#14 – Momentum Effect in Stocks
#26 – Value (Book-to-Market) Anomaly
#229 – Earnings Quality Factor

Authors: de Carvalho, Xiao, Soupe, Dugnolle

Title: Diversify and Purify Factor Premiums in Equity Markets

Link: https://papers.ssrn.com/sol3/papers.cfm?abstract_id=2894171

Abstract:

In this paper we consider the question of how to improve the efficacy of strategies designed to capture factor premiums in equity markets and, in particular, from the value, quality, low risk and momentum factors. We consider a number of portfolio construction approaches designed to capture factor premiums with the appropriate levels of risk controls aiming at increasing information ratios. We show that information ratios can be increased by targeting constant volatility over time, hedging market beta and hedging exposures to the size factor, i.e. neutralizing biases in the market capitalization of stocks used in factor strategies. With regards to the neutralization of sector exposures, we find this to be of importance in particular for the value and low risk factors. Finally, we look at the added value of shorting stocks in factor strategies. We find that with few exceptions the contributions to performance from the short leg are inferior to those from the long leg. Thus, long-only strategies can be efficient alternatives to capture these factor premiums. Finally, we find that factor premiums tend to have fatter tails than what could be expected from a Gaussian distribution of returns, but that skewness is not significantly negative in most cases.

Notable quotations from the academic research paper:

"In this paper we show the importance of portfolio construction when it comes to capturing factor premiums efficiently. We first show that the simplest and most traditional approaches to factor investing tend to generate lower risk-adjusted returns because of uncontrolled risk and unwanted exposure to the market index or market capitalization biases. We show that strategies that target constant volatility and hedge the market beta and exposure to size deliver higher information ratios. This is in particular due to a reduction in volatility.

We also show the importance of removing sector exposure as an additional source of risk without return in factor investing. And we explain why long only factor investing can rather efficiently capture factor premiums, in particular from the low risk and momentum factors. Additionally, we demonstrate the importance of diversifying factors in each style thanks to the decorrelation of factor returns even within the same style.

Finally, we show that factor premiums tend to exhibit fat tails, but also a relatively small skewness.

Overall, we defend the importance of purifying and diversifying factor exposures in factor investing as one way of significantly improving risk-adjusted returns from factor strategies. And although this causes turnover to increase due to the need for additional trades, we highlight the fact that most of the benefits shown in this paper can be captured in practice by using clever approaches to contain turnover."


Are you looking for more strategies to read about? Check http://quantpedia.com/Screener

Do you want to see performance of trading systems we described? Check http://quantpedia.com/Chart/Performance

Do you want to know more about us? Check http://quantpedia.com/Home/About

Continue reading

Seasonalities in Stock Returns

8.January 2017

An interesting academic paper related to a lot of seasonality strategies, but mainly to:

#125 – 12 Month Cycle in Cross-Section of Stocks Returns

Authors: Hirschleifer, Jiang, Meng

Title: Mood Beta and Seasonalities in Stock Returns

Link: https://papers.ssrn.com/sol3/papers.cfm?abstract_id=2880257

Abstract:

Existing research has documented cross-sectional seasonality of stock returns – the periodic outperformance of certain stocks relative to others during the same calendar month, weekday, or pre-holiday periods. A model based on the differential sensitivity of stocks to investor mood explains these effects and implies a new set of seasonal patterns. We find that relative performance across stocks during positive mood periods (e.g., January, Friday, the best-return month realized in the year, the best-return day realized in a week, pre-holiday) tends to persist in future periods with congruent mood (e.g., January, Friday, pre-holiday), and to reverse in periods with non-congruent mood (e.g., October, Monday, post-holiday). Stocks with higher mood betas estimated during seasonal windows of strong moods (e.g., January/October, Monday/Friday, or pre-holidays) earn higher expected returns during future positive mood seasons but lower expected returns during future negative mood seasons.

Notable quotations from the academic research paper:

"We propose here a theory based on investor mood to offer an integrated explanation for known seasonalities at both the aggregate and cross-sectional levels, and to offer new empirical implications which we also test. In our model, investor positive (negative) mood swings cause periodic optimism (pessimism) in evaluating signals about assets’ systematic and idiosyncratic payoff components. This results in seasonal variation in mispricing and return predictability.

Consistent with the model predictions, we uncover a set of new cross-sectional return seasonalities based on the idea that stocks that have been highly sensitive to seasonal mood fluctuations in the past will also be sensitive in the future. In other words, we argue that some stocks have higher sensitivities to mood changes (higher mood betas) than others, which creates a linkage between mood-driven aggregate seasonalities and seasonalities in the cross-section of returns. In particular, we argue that investor mood varies systematically across calendar months, weekdays, and holidays. In consequence, a mood beta estimated using security returns in seasons with mood changes helps to predict future seasonal returns in other periods in which mood is expected to change.

During our sample period 1963-2015. the average stock excess return (measured by CRSP equal-weighted index return minus the riskfree rate) is highest in January and lowest in October. Thus, we focus on January as a proxy for an investor high-mood state and October for a low-mood state. Using Fama-MacBeth regressions, we verify the finding of Heston and Sadka (2008) for January and October—historical January (October) relative performance tends to persist in future January (October) for the following ten or more years. In our interpretation, stocks that do better than others during one month will tend to do better again in the same month in the future because there is a congruent mood at that time.

Furthermore, we find a new reversal effect that crosses months with incongruent moods; historical January (October) returns in the cross section tends to significantly reverse in subsequent Octobers (Januaries). A stock that did better than other stocks last January tends to do worse than other stocks in October for the next five years or so. A one-standard-deviation increase in the historical congruent (incongruent)-calendar-month leads an average 23% increase (17% decrease) in the next ten years, relative to the mean January/October returns.

Our explanation for these effects is not specific to the monthly frequency. A useful way to challenge our theory is therefore to test for comparable cross-sectional seasonalities at other frequencies. Moving to the domain of daily returns, we document a similar set of congruent/incongruent-mood-weekday return persistence and reversal effects.

We confirm this return persistence effect for Monday and Friday returns, and then show, analogous to the monthly results, that a congruent-mood-weekday return persistence effect applies: relative performance across stocks on the best-market-return (worst-market-return) day realized in a week tends to persist on subsequent ten Fridays (Mondays) and beyond, when good (bad) market performance is expected to continue. A one-standard-deviation increase in historical congruent-weekday or congruent-mood-weekday return is associated an average with a 4% or 12% higher return in the subsequent ten Mondays/Fridays.

At the level of individual stocks, there is pre-holiday cross-sectional seasonality, wherein stocks that historically have earned higher pre-holiday returns on average earn higher pre-holiday returns for the same holiday over the next ten years.

The cross-sectional return persistence and reversal effects across months, weekdays, and holidays are overall consistent with our theoretical predictions that investors’ seasonal mood fluctuations cause seasonal misperceptions about factor and firm-specific payoffs and lead to cross-sectional return seasonalities. These predictions are based on the idea that different stocks have different mood beta—a stock’s return sensitivity to factor mispricing induced by mood shocks. We argue that the concept of mood beta integrates various seasonality effects. We therefore perform more direct tests of the model prediction that mood betas will help forecast the relative performance of the stocks in seasons with different moods."


Are you looking for more strategies to read about? Check http://quantpedia.com/Screener

Do you want to see performance of trading systems we described? Check http://quantpedia.com/Chart/Performance

Do you want to know more about us? Check http://quantpedia.com/Home/About

Continue reading

Quantopian & Quantpedia Trading Strategy Series: Cross-Sectional Equity Mean Reversion

29.December 2016

Quantopian & Quantpedia Trading Strategy Series continues … Now with a 4th article, again written by Matthew Lee, focused on Cross-Sectional Equity Mean Reversion (Strategy #13):

https://www.quantopian.com/posts/quantpedia-trading-strategy-series-an-analysis-on-cross-sectional-mean-reversion-strategies

Cross-sectional mean reversion in stocks (strong tendency of stocks with strong gains/losses to reverse in a short-term time frame – up to one month) is a well-known market observation and the main reason why so many academic researchers generally use a 2-12 momentum measurement (returns over the past 12 months, excluding the previous one) when examining momentum anomaly. Many academic papers examined this effect, the most notable are papers by Jagadesh, and Bruce Lehmann (see "Other papers" section on Quantpedia subpage for this reversal strategy for additional academic research papers). The most academics speculate that the fundamental reasons for the anomaly are market-microstructure frictions (bid-ask bounce) or investors' cognitive biases – overreaction to past information and a correction of that reaction after a short time horizon.

But is this simple equity strategy still profitable?

Matthew Lee from Quantopian performed an independed analysis during an out of sample period from 12-01-2011 to 12-01-2016. Overall, the performance of simple short-term equity reversal strategy is below the market. But, it's to be noted that this strategy is long/short compared to just long-only equity benchmark (which is the SPY). So if we want to compare total performance of that strategy, we should compare long only reversal of the "loser stocks decile". Long/short equity reversal strategy has a Sharpe ratio 0.84 and Beta of 0.15. Sharpe ratio of long/short version is comparable to market portfolio and a low correlation of equity reversal strategy makes it a possible addon to investment portfolio.

However … Reversal strategy is very active (weekly, bi-weekly rebalancing) which means high transaction costs and slippage. So really high caution should be paid in a real-world implementation and steps which tries to limit strategy's turnover should be taken.

The final OOS equity curve:

Strategy's performance

Thanks for the analysis Matthew!

You may also check first, second or third article in this series if you liked the current one. Stay tuned for the next …

Continue reading

An Effect of Monetary Conditions on Carry Trades

22.December 2016

A related paper to:

#5 – FX Carry Trade

Authors: Falconio

Title: Carry Trades and Monetary Conditions

Link: https://papers.ssrn.com/sol3/papers.cfm?abstract_id=2854134

Abstract:

This paper investigates the relation between monetary conditions and the excess returns arising from an investment strategy that consists of borrowing low-interest rate currencies and investing in currencies with high interest rates, so-called "carry trade". The results indicate that carry trade average excess return, Sharpe ratio and 5% quantile differ substantially across expansive and restrictive conventional monetary policy before the onset of the recent financial crisis. By contrast, the considered parameters are not affected by unconventional monetary policy during the financial crisis.

Notable quotations from the academic research paper:

"My main result is that carry trade portfolio average return, Sharpe ratio and 5% quantile di ffer substantially across expansive and restrictive conventional monetary policy before the onset of the recent financial crisis. Speci fically, I find that expansive periods are characterised by signi cantly higher average returns and Sharpe ratios and lower downside risk. Concerning this, I argue that expansive conventional monetary policy is able to improve market expectations across countries and in this way lower FX volatility risk. This generates a currency appreciation for net debtor nations and an increase in carry trade pro fits.

Second, I present evidence suggesting that the considered parameters are similar across aggressive and stabilising unconventional monetary policy during the recent financial crisis. So, the Federal Reserve could not a ffect market expectations during this time.

For investors, this evidence suggests that rewards from carry trade vary with changes in monetary conditions only during "normal" times. For researchers, this evidence suggests that recognising the relevance of monetary policy is crucial to understanding the pricing implications of FX volatility risk for carry trade."


Are you looking for more strategies to read about? Check http://quantpedia.com/Screener

Do you want to see performance of trading systems we described? Check http://quantpedia.com/Chart/Performance

Do you want to know more about us? Check http://quantpedia.com/Home/About

Continue reading

Subscribe for Newsletter

Be first to know, when we publish new content


    logo
    The Encyclopedia of Quantitative Trading Strategies

    Log in

    MORE INFO
    We boasts a total prize pool of $15,000
    Gain a Share of a Total Prize Pool of $15.000
    MORE INFO
    $15.000
    Gain a Share of a Total Prize Pool