Beta Herding and Low-Beta Anomaly
A new financial research paper has been published and is related to:
#77 – Beta Factor in Stocks
Author: Hwang, Rubesam, Salmon
Title: Overconfidence, Sentiment and Beta Herding: A Behavioral Explanation of the Low-Beta Anomaly
Link: https://papers.ssrn.com/sol3/papers.cfm?abstract_id=3224321
Abstract:
We investigate asset returns using the concept of beta herding, which measures cross-sectional variations in betas induced by investors whose beliefs about the market are biased due to changes in confidence or sentiment. Overconfidence or optimistic sentiment causes beta herding (compression of individual assets’ betas towards the market beta), while under-confidence or pessimistic sentiment leads to adverse beta herding (dispersion of betas away from the market beta). We find that beta herding is related to the low-beta anomaly, as high beta stocks underperform low beta stocks on a risk-adjusted basis exclusively following periods of adverse beta herding. As an explanation of the low-beta anomaly, we propose the persistence of bias in betas (i.e., a large difference in betas) that lasts for more than one year as market uncertainty continues.
Notable quotations from the academic research paper:
"In this study we fill the gap in the literature by investigating the bias in cross-sectional asset returns when individual asset prices move together regardless of their fundamentals. We propose a mechanism that explains this comovement in asset returns with respect to two well-known behavioral biases in finance: investor overconfidence and sentiment.
We demonstrate that the cross-sectional difference in the expected returns and betas of individual assets is suppressed when investors are overconfident about signals of the market outlook, and thus their posterior prediction of the market return is overly affected by these signals. A comparable compression of betas arises in the presence of investor sentiment. When optimistic views about the market outlook prevails, individual betas are biased towards the market beta. The opposite case is also possible: when investors are under-confident about the market outlook or their sentiment is pessimistic, the difference between individual betas increases.
This type of cross-sectional bias in betas is referred to as “beta herding” in this study because individual betas are biased (herd) towards the market beta regardless of their equilibrium risk-return relationship, when investors’ market outlook is excessively affected by their optimism or overconfidence about the market outlook. In practice, when beta herding arises, investors may buy assets whose returns increase less than the market because these assets would appear relatively cheap. Likewise, they may sell assets whose returns increase more than the market because these assets would seem to be relatively expensive and the opportunity for taking apparent profits might be hard to resist. In fact, the more confident or optimistic investors are about their market outlook, the more likely they are to trade at a price close to their view.
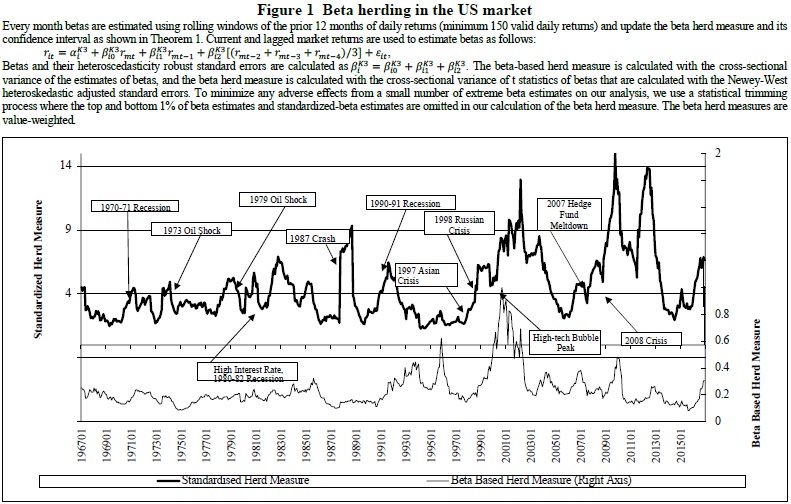
In our model, high and low beta stocks are not affected differently by beta herding, and thus beta herding can be easily measured by the cross-sectional variance of standardized-betas, which are equivalent to the t-statistics of beta estimates. The standardized-beta provides information on the precision of the beta estimate in addition to its magnitude, and more importantly, makes it possible to compare the dynamics of beta herding over different periods.
We find that the low-beta anomaly is observed only after periods of adverse beta herding, when the dispersion of standardized-betas increases: for value-weighted decile portfolios formed on standardized-betas, the risk-adjusted return of the high-minus-low portfolio over the 12 months following adverse beta herding is -11.4% per year, whereas the returns are not different from zero following periods of no beta herding or high beta herding. The effects of adverse beta herding on standardized-beta sorted portfolios are quite persistent and remain significant over two years."
Are you looking for more strategies to read about? Sign up for our newsletter or visit our Blog or Screener.
Do you want to learn more about Quantpedia Premium service? Check how Quantpedia works, our mission and Premium pricing offer.
Do you want to learn more about Quantpedia Pro service? Check its description, watch videos, review reporting capabilities and visit our pricing offer.
Do you want algorithmic access to the full Quantpedia database via the API? Subscribe to Quantpedia Pro, ask for an API key, and explore the in/out-of-sample statistics, source academic papers, and code snippets — ideal for quantitative research, systematic trading workflows, and AI model training.
Are you looking for historical data or backtesting platforms? Check our list of Algo Trading Discounts.
Or follow us on:
Facebook Group, Facebook Page, Telegram, Twitter, Linkedin, Medium or Youtube
Share onLinkedInTwitterFacebookRefer to a friend


