Smart Beta Strategies in Australia

24.March 2016

An academic paper related to multiple strategies:

Authors: Docherty

Title: How Smart is Smart Beta Investing? Evidence from Australia

Link: http://papers.ssrn.com/sol3/papers.cfm?abstract_id=2706246

Abstract:

"Smart beta" investing is an alternative to the traditional active and passive approaches to funds management, whereby investors adopt a systematic method that provides exposure to factors that are argued to be related with expected returns at low cost. Therefore, the question of how smart is smart beta investing can be empirically examined by testing the performance of those factors that underlie smart beta portfolios. We use a long time-series of data and show that the value, momentum, low volatility and quality factors all generate positive abnormal returns in the Australian equity market. Rather than ranking these factors based on relative performance, we argue that the optimal approach to smart beta investing is to diversify across these factors, given the low correlations between factor returns. Our results provide important implications for the Australian funds management industry. First, while this study does not examine the specific strategies applied by smart beta fund managers, the evidence presented provides a justification for the application of smart beta as a low cost alternative to active investment. Second, given evidence that multiple factors explain equity returns, multi-factor models should be used to measure active portfolio manager performance in order to distinguish pure alpha from abnormal returns generated due to smart beta exposure.

Notable quotations from the academic research paper:

"Given most of the academic evidence regarding the performance of smart beta factors has focused on the United States equity market, this study provides a summary of the key literature and updated empirical findings regarding the five key systematic risk factors in the Australian equity market: size, value, momentum, low volatility and quality. We use a long time-series of 25 years of historical data to show that there is statistically significant evidence to support the existence of the value, momentum, low volatility and quality factors in the Australian equity market. However given the low correlation between factor returns, diversifying across factors is superior to constructing a smart beta portfolio that only provides exposure to a single factor.

Given the evidence presented above that several factors have historically explained returns in the Australian equity market, a natural extension is to ask which of these factors is best. However, we argue that such a debate is moot. Given the justification for smart beta investing is that it provides exposure to additional factors that are related to changes in investor wealth beyond the market risk premium, the returns across these factors should vary across different states. The smart beta factors are only moderately correlated with the market risk premium, and in the case of value, momentum and quality, these correlations are negative.

Table 8 reports the weightings of both the low volatility and maximum Sharpe ratio portfolios. Both the minimum expected variance and maximum expected Sharpe ratio portfolios are highly diversified across the five factors. With respect to the maximum Sharpe ratio portfolio, the value factor is weighted most heavily, followed by momentum, whereas the size factor has the highest weighting in the minimum variance portfolio. While the results reported in Table 8 are not necessarily indicative of the optimal allocation across factors given the reliance on historical data, what this table does clearly illustrate is that diversified factor exposures are superior to smart beta portfolios constructed using a single factor. For example, a value investor would gain utility by also having additional exposure to the momentum, quality or low volatility factor as part of their complete portfolio.

There is an ongoing debate about whether equity market factors are priced domestically or globally. Karolyi and Stulz (2003) argue that international equity flows and cross-country correlations should result in global factors being the key determinant of returns. They propose a model whereby equity prices are determined by a stock’s sensitivity to global risk factors. If smart beta factors were priced globally, investors could rely on the plethora of US-focused research to support their decision making. However the home bias, whereby market participants over-invest in their domestic market, may cause a degree of segmentation as the marginal investor is likely to be a domestic investor who is sensitive to local influences. The correlations between the Australian and global smart beta factors are reported in Table 9. While positively correlated as expected, the magnitude of these correlations is relatively modest, particularly when compared with the correlations between the respective market portfolios. These results show that local, as opposed to global, factors are a substantial driver of the variation in smart beta factor returns. The differences between local and global factor returns, as evidenced by their modest correlations, also illustrates the need for Australian-focused research as a means of justifying local smart beta strategies."


Are you looking for more strategies to read about? Check http://quantpedia.com/Screener

Do you want to see performance of trading systems we described? Check http://quantpedia.com/Chart/Performance

Do you want to know more about us? Check http://quantpedia.com/Home/About

Continue reading

Covered Calls Uncovered

17.March 2016

A related paper has been added to:

#20 – Volatility Risk Premium Effect

Authors: Israelov, Nielsen

Title: Covered Calls Uncovered

Link: http://papers.ssrn.com/sol3/papers.cfm?abstract_id=2444999

Abstract:

Equity index covered calls have historically provided attractive risk-adjusted returns largely because they collect equity and volatility risk premia from their long equity and short volatility exposures. However, they also embed exposure to an uncompensated risk, a naïve equity market reversal strategy. This paper presents a novel performance attribution methodology, which deconstructs the strategy into these three identified exposures, in order to measure each’s contribution to the covered call’s return. The covered call’s equity exposure is responsible for most of the strategy’s risk and return. The strategy’s short volatility exposure has had a realized Sharpe ratio close to 1.0, but its contribution to risk has been less than 10 percent. The equity reversal exposure is responsible for about one-quarter of the covered call’s risk, but provides little reward. Finally, we propose a risk-managed covered call strategy that hedges the equity reversal exposure in an attempt to eliminate this uncompensated risk. Our proposed strategy improved the covered call’s Sharpe ratio, and reduced its volatility and downside equity beta.

Notable quotations from the academic research paper:

"Equity index covered calls are the most easily accessible source of the volatility risk premium to most investors. The volatility risk premium, which is absent from most investors’ portfolios, has had more than double the risk-adjusted returns (Sharpe ratio) of the equity risk premium, which is the dominant source of return for most investors. By providing the equity and volatility risk premia, equity index covered calls returns have been historically attractive, nearly matching the returns of their underlying index with significantly lower volatility.

One source of confusion on covered calls may be due to the opacity of the strategy’s risk exposures. Our paper’s first contribution is a novel performance attribution methodology for portfolios holding options, such as the covered call strategy. We demonstrate how to decompose the portfolio return into three distinct risk exposures: passive equity, equity market timing, and short volatility.

We demonstrate our proposed performance attribution by analyzing and comparing two covered call strategies. The first strategy mimics the CBOE S&P 500 BuyWrite Index (BXM), selling one-month at-the-money call options on option expiration dates. The second strategy mimics the CBOE S&P 500 2% OTM BuyWrite Index (BXY), selling one-month 2% out-of-the money call options on option expiration dates. Our performance attribution shows that passive equity is the dominant exposure for both covered call strategies. Short volatility contributes less than 10% of the risk, but with a Sharpe ratio near 1.0, adds approximately 2% annualized return to the covered call strategies.

Option-savvy market participants, such as market makers, are well aware that options include market timing, an active equity exposure. In fact, they often employ a delta-hedging program specifically designed to reduce the risk arising from this dynamic exposure. However, the covered call benchmark (CBOE BuyWrite Index) and most covered call funds do not hedge the time varying equity exposure arising from option convexity. Further, the risk and return contribution of an unhedged short option position’s dynamic equity exposure is by-and-large not reported by those who manage to those who invest in covered call strategies and is unaddressed in the covered call literature.

We employ our performance attribution to document that market timing is responsible for about one-quarter of the at-the-money covered call’s risk. The timing bet is smallest immediately after option expiration and largest just prior to option expiration. In fact, on the day before the call option expires, the equity timing position provides on average nearly the same risk as the passive equity exposure. We further show that covered call investors have not been compensated for bearing this risk. Because the embedded market timing is hedgeable by trading the underlying equity, covered call investors do not need to take that bet to earn the volatility risk premium. In other words, by shorting an option, covered calls include a market timing exposure that bets on equity reversals whose risk is material, uncompensated, and unnecessary for earning the volatility risk premium.

Having identified the covered call’s active equity exposure as an uncompensated contributor to risk, our final contribution analyzes a risk-managed covered call strategy that hedges away the identified dynamic equity exposure. On each day, the covered call’s active equity exposure may be measured by computing the delta of the strategy’s call option. The strategy trades an offsetting amount of the S&P 500 so that the covered call’s equity exposure remains constant. This risk management exercise mimics the delta-hedging approach taken by volatility desks. In so doing, the risk-managed covered call achieves higher risk-adjusted returns than does the traditional covered call because it continues to collect the same amount of equity and volatility risk premium, but is no longer exposed to equity market timing risk."


Are you looking for more strategies to read about? Check http://quantpedia.com/Screener

Do you want to see performance of trading systems we described? Check http://quantpedia.com/Chart/Performance

Do you want to know more about us? Check http://quantpedia.com/Home/About
Continue reading

A Closer Look At Ben Graham’s “Net Current Asset Value” (NCAV) Rule

9.March 2016

A related paper has been added to:

#37 – Net Current Asset Value Effect

Authors: Oxman, Mohanty, Carlisle

Title: Deep Value Investing and Unexplained Returns

Link: http://papers.ssrn.com/sol3/papers.cfm?abstract_id=1928694

Abstract:

Following Ben Graham’s “net current asset value” (NCAV) rule for stock selection (“net net” strategy), we provide evidence that buying stocks in companies with per share NCAV greater than the current share price produced superior risk-adjusted returns over the 1975- 2010 period. The risk factors that explain the returns associated with these firms include market risk, market liquidity, a factor capturing overreaction (long-term reversal), and a relative distress factor. The only firm characteristics that drive excess stock returns for such firms are the analyst coverage, stock price per share, and turnover. Controlling for firm size and common risk factors, we find that returns are higher among net-net stocks with low analyst coverage, low stock price per share and lower trading volume.

Notable quotations from the academic research paper:

"We document that the average monthly return on a net-net portfolio is nearly 5% while the average monthly return on the equal-weighted CRSP is only 1.4% over the same period. We find that the market risk of net- net stocks is quite high. Surprisingly, the small-firm premium in our study does not have any significant explanatory power, nor does the value premium. The momentum factor, from Carhart (1997), has some explanatory power, as does the long-term reversal factor from DeBondt and Thaler (1985). Net- net firms are good candidates for explanation by way of the reversal factor because they are likely to be incorrectly undervalued, based on the firm’s fundamental characteristics. We also note that the leverage factor, based on Ferguson and Shockley (2003), has some explanatory power. It is still puzzling that all risk factors described above leave an unexplained alpha of between 4 and 5% per month.

We explore the relation between firm characteristics and the return anomaly in some detail. We find that firms that fall into the net- net category are typically small firms with high book-to-market ratios and low analyst coverage. Such firms also have significantly lower volume than the CRSP mean, and some of those firms are actually less illiquid than the CRSP mean. Net-net firms with per-share price of $5 or greater tend to be more liquid than the CRSP mean. In contrast, net-net firms with per-share price of $3-$5 are much less liquid than the CRSP mean. Controlling for risk factors and firm characteristics we show that the trading volume and analyst coverage are two key factors explaining the excess returns available to net-net firms."


Are you looking for more strategies to read about? Check http://quantpedia.com/Screener

Do you want to see performance of trading systems we described? Check http://quantpedia.com/Chart/Performance

Do you want to know more about us? Check http://quantpedia.com/Home/About
Continue reading

Do the Size, Value, and Momentum Factors Exist in Emerging Markets?

2.March 2016

A new related paper has been added to:

#14 – Momentum Effect in Stocks

#25 – Small Capitalization Stocks Premium
#26 – Value (Book-to-Market) Anomaly

Authors: Cakici, Tang, Yan

Title: Do the Size, Value, and Momentum Factors Drive Stock Returns in Emerging Markets?

Link: http://papers.ssrn.com/sol3/papers.cfm?abstract_id=2727257

Abstract:

This paper investigates the size, value and momentum effects in 18 emerging stock markets during the period 1990−2013.We find that size and momentum strategies generally fail to generate superior returns in emerging markets. The value effect exists in all markets except Brazil, and it is robust to different periods and market conditions. Value premiums tend to move positively together across different markets, and such inter-market co-movements increase overtime and during the global financial crisis.

Notable quotations from the academic research paper:

"Emerging markets usually have slower information diffusion, higher transaction costs, lower institutional investor participation than developed markets. Retail investors in emerging markets tend to passively hold suboptimal portfolios due to underdeveloped financial markets. These market frictions intertwined with the mechanisms underlying the value and momentum premiums can either exacerbate or dampen the value and momentum effects on cross-sectional variation in expected stock returns.

Following Fama and French (1993), we construct factor mimicking portfolios based on size, book-to-market equity ratio, and momentum, and calculate monthly factors with respect to size (SMB), value (HML), and momentum (UMD) for individual markets. 2 We find that during the period 1990 − 2013, the size effect does not exist in all emerging markets except China. In contrast, the average SMB is negative in 14 of 18 markets, ranging from –0.10% per month in Czech Republic to –1.02% per month in Hungary. The average HML is always positive in a range from 0.41% per month in Brazil to 2.34% per month in India, and it is statistically significant in all markets except Brazil. On the other hand, the momentum effect, which tends to be stronger than the size and value effects in the U.S. and other developed markets, is surprisingly weak in most emerging markets. Although the average UMD is positive in 14 markets with a minimum of 0.05% per month in Malaysia and a maximum of 1.99% per month in India, it is statistically significant only in Chile (with a mean HML of 0.74%) and India (with a mean HML of 2.34% per month).

Next, we correlate value and momentum factors. We show that they often move inversely together both within the same market and across different markets. Moreover, the negative correlations between the value and momentum factors are stronger for big stocks than for small stocks and in the periods when the U.S. stock market posts positive returns than in the periods of negative U.S. stock market returns. On the other hand, the value factor tends to move positively together across different markets, so does the momentum factor.

Finally, we perform subperiod analyses. We find that the value strategy in emerging markets is robust to different sample periods and market conditions, while the momentum effect is generally weak. Moreover, the value premium has become more positively correlated across emerging markets overtime, and are even more so during the global financial crisis period."


Are you looking for more strategies to read about? Check http://quantpedia.com/Screener

Do you want to see performance of trading systems we described? Check http://quantpedia.com/Chart/Performance

Do you want to know more about us? Check http://quantpedia.com/Home/About

Continue reading

Sell in May and Go Away in the Equity Index Futures Markets

25.February 2016

A new related paper has been added to:

#31 – Market Seasonality Effect in World Equity Indexes

Authors: Dzahabarov, Ziemba

Title: Sell in May and Go Away in the Equity Index Futures Markets

Link: http://papers.ssrn.com/sol3/papers.cfm?abstract_id=2721068

Abstract:

The period May 1 to the turn of the month of November (last five trading days October) has historically produced negligible returns. The rest of the year (late October to the end of April) has essentially all the year's gains. In this paper we show that there is a statistically significant difference and conclude that the strategy go to cash in the weak period and go long in the strong period has about double the returns of buy and hold for large cap S&P500 index and triple for the small cap Russell2000 index during the period 1993-2015 in the index futures markets.

Notable quotations from the academic research paper:

"September and October have historically had low stock market returns with many serious declines or crashes occurring in October. Also the months of November to February have historically had higher than average returns. This suggests the strategy to avoid the bad months and be in cash then and only be long the stock market in the good months. Sell-in-May-and-go-away, which is sometimes called the Halloween E ffect, is one such strategy that is often discussed in the financial press.

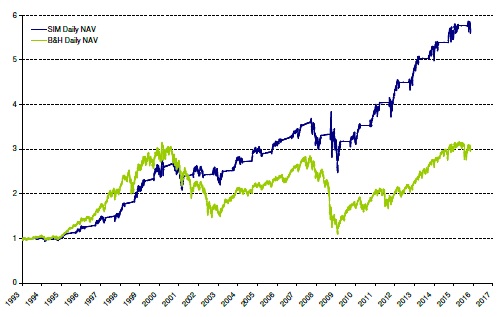
Figure 1: S&P500 Futures Sell in May (SIM) and B&H Cumulative Returns Comparison. 1993-2015. (Entry at Close on 6th Day before End of October. Exit 1st Day of May.)

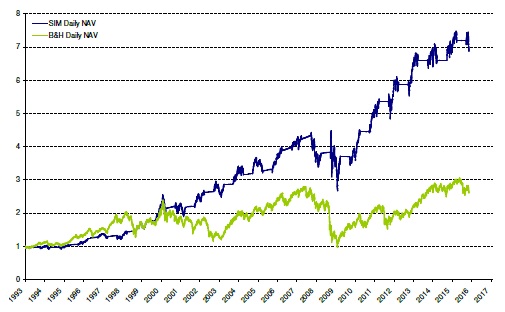
Figure 2: Russell2000 Futures Sell in May (SIM) and B&H Cumulative Returns Comparison. 1993-2015. (Entry at Close on 6th Day before End of October. Exit 1st Day of May.)

For the S&P500 a buy and hold strategy turns $1 on February 4, 1993 into $3.05 on December 16, 2015; whereas, sell in May and move into cash, counting interest (Fed funds e ffective monthly rate for sell in May) and dividends for the buy and hold, had a final wealth of $5.77, some 89.2% higher. For the Russell2000, the final wealths were $2.70 and $7.11, respectively, some 163.3% higher. Figures 1 and 2 show this strategy using the rule sell on the fi rst trading day in May and buy on the 6th trading day before the end of October, for the S&P500 and Russell2000 index futures for the years 1993-2015, respectively. This rule did indeed beat a buy and hold strategy by two and three times in nal wealth with lower standard deviation risk. The strategy works in most but not all years and in strategy design can be combined with other e ffects depending upon market conditions."


Are you looking for more strategies to read about? Check http://quantpedia.com/Screener

Do you want to see performance of trading systems we described? Check http://quantpedia.com/Chart/Performance

Do you want to know more about us? Check http://quantpedia.com/Home/About

Continue reading

An Interesting Cross-Asset Class Analysis of Risk Premiums

19.February 2016

Author: Ebner

Title: Risk and Risk Premia: A Cross-Asset Class Analysis

Link: http://papers.ssrn.com/sol3/papers.cfm?abstract_id=2711624

Abstract:

The existence of risk premia has been widely documented in the academic literature over the past decades. Until now they have typically been handled as separate phenomena for specific markets or asset classes and thus examined independently. This study analyses risk premia across a variety of asset classes and risk styles to uncover their common performance characteristics, underlying risk sources and return’s sensitivity to economic factors. Based on a set of 16 risk premia over a 22 year sample period we were able to illustrate that risk premia’s expected returns are significantly influenced by their volatility and their sensitivity to funding liquidity and market volatility. Furthermore we show that macroeconomic factors such as industrial production and inflation have a significant effect on the expected returns of the entire set of risk premia. Finally, analysing the link between premia and the global market portfolio shows that premia with unfavourable comoments possess superior expected returns.

Notable quotations from the academic research paper:

"This study initiates with the analysis of return characteristics for 16 risk premia over a 22 year sample period.

We show that the expected return of a risk premium is significantly affected by its volatility. In other words, higher risk premia volatilities go hand in hand with higher expected returns. However, the analysis of risk premia’s skewnesses and kurtoses does not provide significant results. Subsequently, we build a global cross-asset market portfolio and analyse how risk premia comoments determine their expected returns. The idea behind this is that investors are not compensated for diversifiable risk in equilibrium, but for their systematic risk exposure. The results are in line with the efficient market hypothesis and show that risk premia when adding positive cokurtosis or negative coskewness to a diversified market portfolio have significantly higher expected returns. However, we do not find significant results for a risk premium’s beta exposure to the global cross-asset market portfolio. The second part of the analysis studies the relevance of economic conditions affecting risk premia returns. Considered factors are change in industrial production and inflation, market volatility and market- and funding liquidity. We start with a regime analysis which documents considerable differences in a risk premia’s return given subject to economic conditions.

Comparing risk premia over different regime classifications, this analysis shows the intuitive result that the risk premium “government market” generates attractive returns during unfavourable market regimes and serves as a “safe haven” investment. However, it is not the only risk premium with higher returns during unfavourable periods. For example “commodity momentum” and “FX value” also generate attractive returns during unfavourable market conditions. Afterwards we analyse the expected return of risk premia contingent on each of the economic conditions. We see that during periods of high industrial production changes and low inflation changes, risk premia per se possess higher expected returns. This is also true during periods of high funding liquidity. This study concludes with an analysis of how risk premia’s expected returns are linked to their sensitivities to economic factors. We show that risk premia with higher sensitivities to funding liquidity and market volatility possess significantly higher expected returns."


Are you looking for more strategies to read about? Check http://quantpedia.com/Screener

Do you want to see performance of trading systems we described? Check http://quantpedia.com/Chart/Performance

Do you want to know more about us? Check http://quantpedia.com/Home/About

Continue reading

Subscribe for Newsletter

Be first to know, when we publish new content


    logo
    The Encyclopedia of Quantitative Trading Strategies

    Log in

    MORE INFO
    We boasts a total prize pool of $15,000
    Gain a Share of a Total Prize Pool of $15.000
    MORE INFO
    $15.000
    Gain a Share of a Total Prize Pool