How Julius Baer Mixes Quantitative Investment Strategies
Related to multiple strategies, mainly to Carry, Volatility Selling and Trend-Following strategies …
Authors: Sepp
Title: Diversifying Cyclicality Risk of Quantitative Investment Strategies (Presentation Slides)
Link: https://papers.ssrn.com/sol3/papers.cfm?abstract_id=2980708
Abstract:
What is the most significant contributing factor to the performance of a quantitative fund: its signal generators or its risk allocators? Can we still succeed if we have good signal generators but poor risk management?
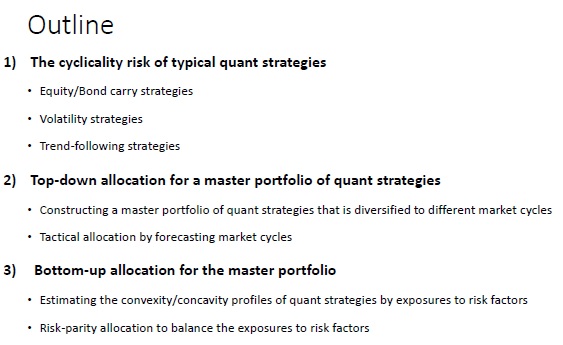
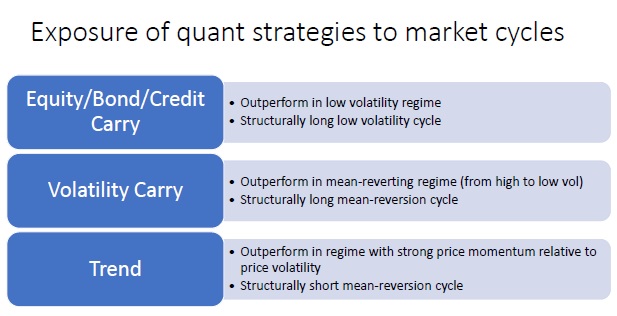
We consider the risk of the skewness and the cyclicality of the key quantitative strategies:
1. Carry strategies
2. Volatility strategies
3. Trend-following strategies
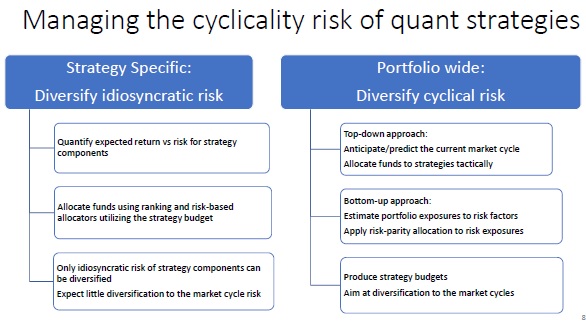
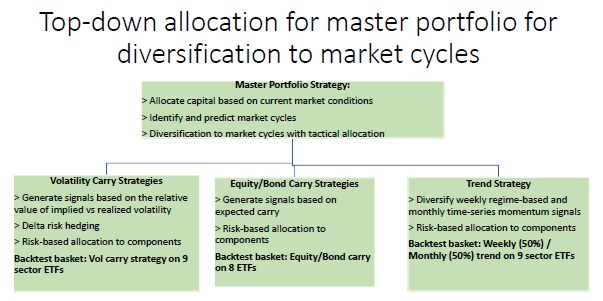
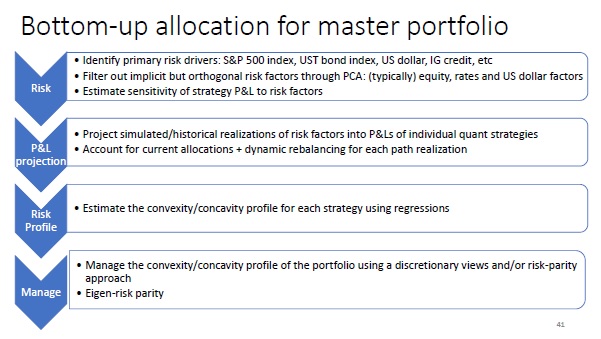
We then present the two approaches for diversification of the cyclicality risk for a master portfolio of these strategies using:
1. Top-down allocation
2. Bottom-up allocation
We illustrate a few examples using back-tested data using systematic quantitative strategies with risk-based allocators.
Notable quotations from the academic research paper:
"
"
Are you looking for more strategies to read about? Check http://quantpedia.com/Screener
Do you want to see performance of trading systems we described? Check http://quantpedia.com/Chart/Performance
Do you want to know more about us? Check http://quantpedia.com/Home/About