A Simple Approach to Market-Timing Strategy Replication
In previous articles, we discussed the ideas behind portfolio replication with market factors and presented Quantpedia’s approach to Multi-Factor Regression. Additionally, we examined the methods of market factor data extension used in construction of our historic factor universe we utilize to mimic portfolios during the past century (Extending Historical Daily Bond Data to 100 Years, Extending Historical Daily Commodities Data to 100 Years, 100-Years of Multi-Asset Trend-Following, Fama & French Data Library). We showed, our replication methodology can yield reliable results, given the performance is in fact driven by the factors from our factor universe (How to Replicate Any Portfolio). The resultant synthetic curve allows you to probe the portfolio behavior in various historical market conditions.
However, overall robustness of the results suffers significantly if the model portfolio or trading strategy we attempt to synthesize is driven by a market-timing model. We do not know the rules driving the underlying strategy we could apply ourselves beforehand. Furthermore, there is no simple mechanism of market-timing rule detection we could potentially utilize in our regression model. Hypothetically, we could include a variety of market-timing strategies into the factor universe. But since there are countless market-timing methods, covering everything is simply unrealistic. Particularly in context of historic factor universe construction. In an attempt to capture the effects of underlying timing rules, we came up with a simple approach to address this problem to a somewhat satisfactory extent.
Methodology
Built on principles of portfolio replication described in the How to Replicate Any Portfolio article we introduce a few methodological changes to mimic market timing strategies. They are built around simple daily probability of the underlying strategy being in market.
Firstly, we detect and exclude periods of flat model portfolio performance from Multi-Factor Regression to generate a new synthetic portfolio. Flat period detection follows a simple rule to filter out possible false positives. The rule requires at least 3 consecutive days with 0% return to classify these as flat periods. We then build the synthetic curve as usual. Secondly, we calculate probabilities of the strategy being in-market by day-of-year, following this formula:
Where pi is the probability/weighting coefficient for the ith day-of-year category.
There are two approaches to day-of-year categorization:
- based on calendar years (1-366 categories);
- based on trading calendars (1-253 categories).
We chose to carry out our analysis on calendar-based categorization at this point. The results do not differ significantly if we use trading-calendar categorization.
Finally, we weigh each daily data point of the synthetic curve by the calculated probability, categorically by day-of-year.
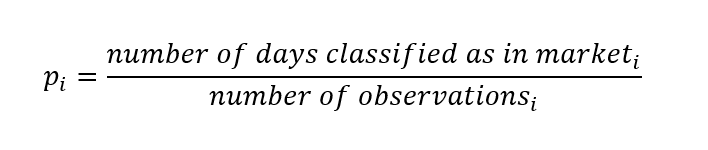
We presume that following this simple approach we can quite accurately model the effects of calendar-based rules or seasonality (as shown in Figure 1) and at least attempt to approximate the effects of the other timing principles. It needs to be pointed out, however, the presented method proxies the market-timing effects only from a high-level perspective. We can neither detect nor mimic any timing effects of the underlying assets.
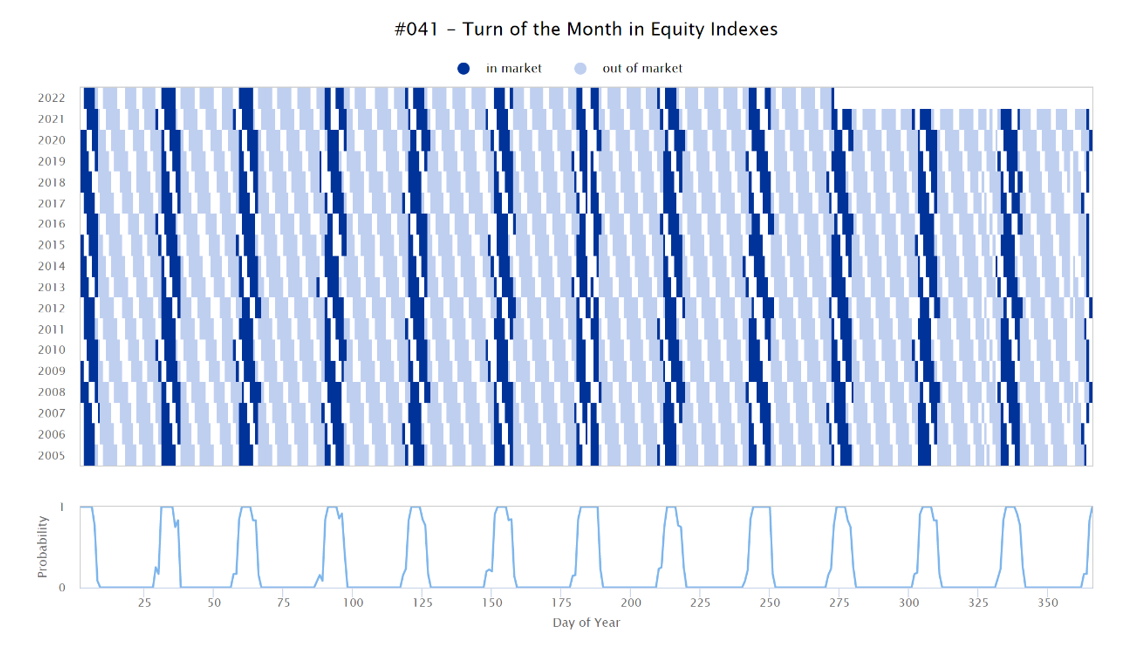
Figure 1 Weighting coefficients for #041 – Turn of the Mont in Equity Indexes
Results
Utilizing the original algorithm presented in the How to Replicate Any Portfolio article we replicated AOR – iShares Core Growth Allocation ETF yielding the following results (See Figure 2).
Following the methodology described here, does not yield any different regression results for assets such as AOR. The flat period filtering rule does not detect any flat period. Therefore, the weights calculated for each day-of-year category equate to 1 (see Figure 3).
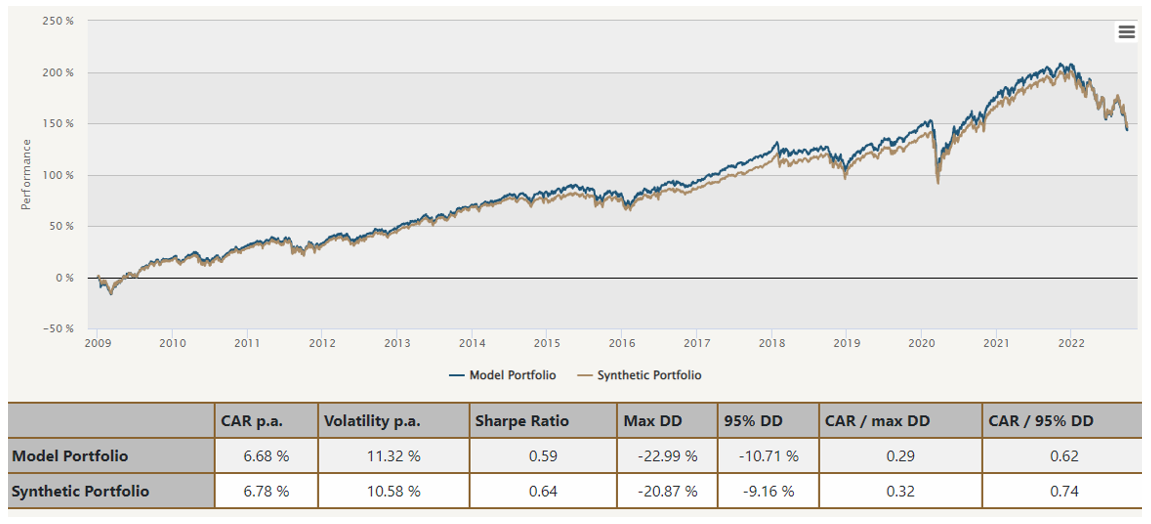
Figure 2 Synthetic Portfolio (Model Portfolio: 100% AOR) – original methodology
Figure 3 Model Portfolio: 100% AOR – daily weighting coefficient
Once we established our new methodology does not affect the regression model, we proceeded to replicate some market-timing strategies. We have chosen strategies #031 – Market Seasonality Effect in World Equity Indexes and #133 – Timing the Small Cap Effect to paint a picture of different modeling outcomes. As anticipated, the figures suggest our approach works very well on the strategies driven by some form of seasonality or calendar-based timing rules. This is clearly shown in Figure 4 which displays a replication of the #031 strategy. It almost appears as if we overlayed the daily in-market pattern artificially, but it is in fact based on the calculated probabilities shown in Figure 5.
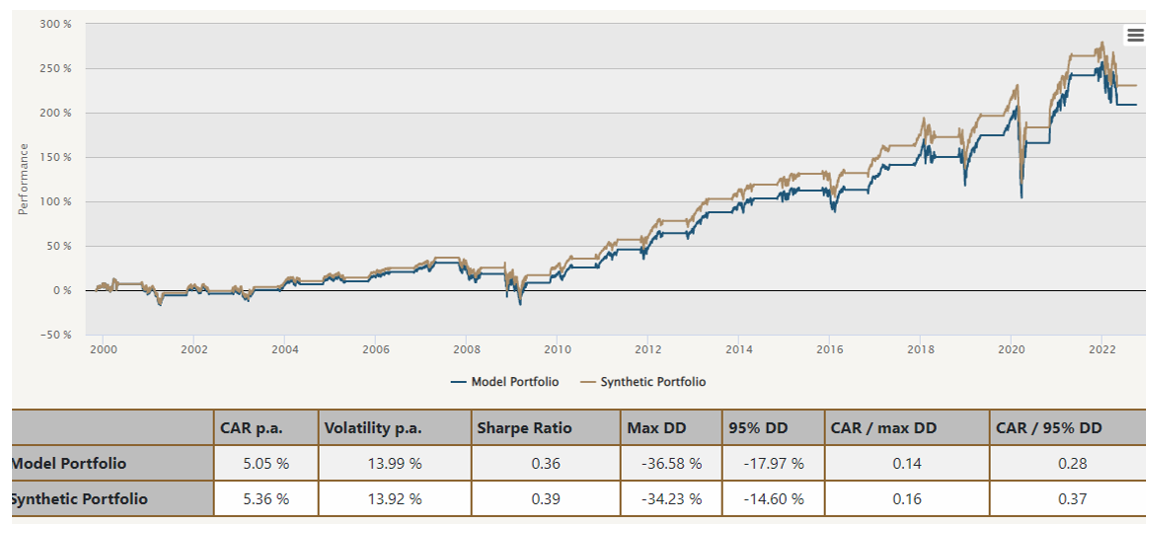
Figure 4 Synthetic Portfolio (Model Portfolio: 100% #031)
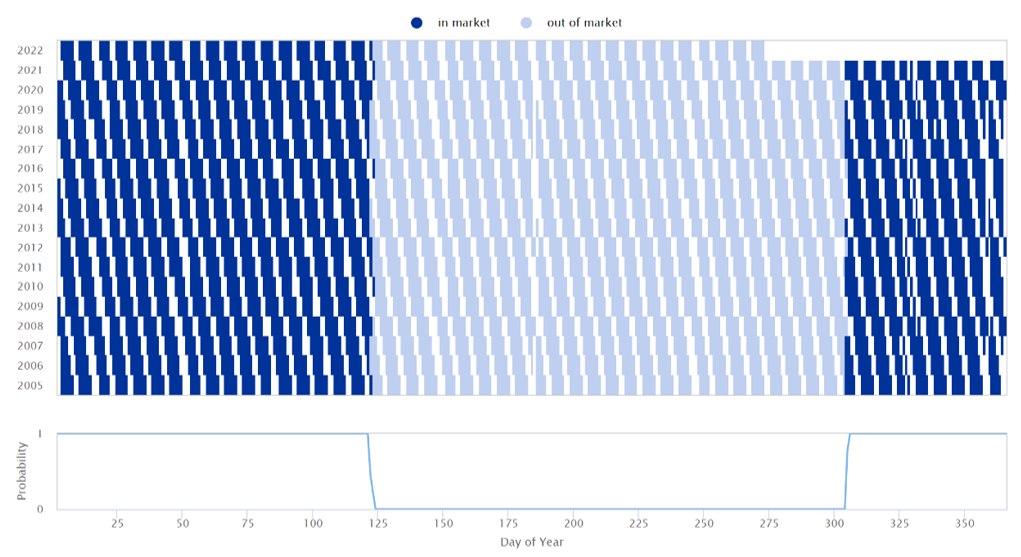
Figure 5 Model Portfolio: #031 – daily weighting coefficient
Indeed, seasonal strategies represent only a subset of all trading strategies. Nonetheless, the same method applies to any strategy based around any other timing rule or a combination of two and more. We have chosen #133 to represent those (see Figure 6). The fit is not nearly as precise as before, but the results still carry some informative value since the timing effects are in fact weighted in by the coefficient shown in Figure 7.
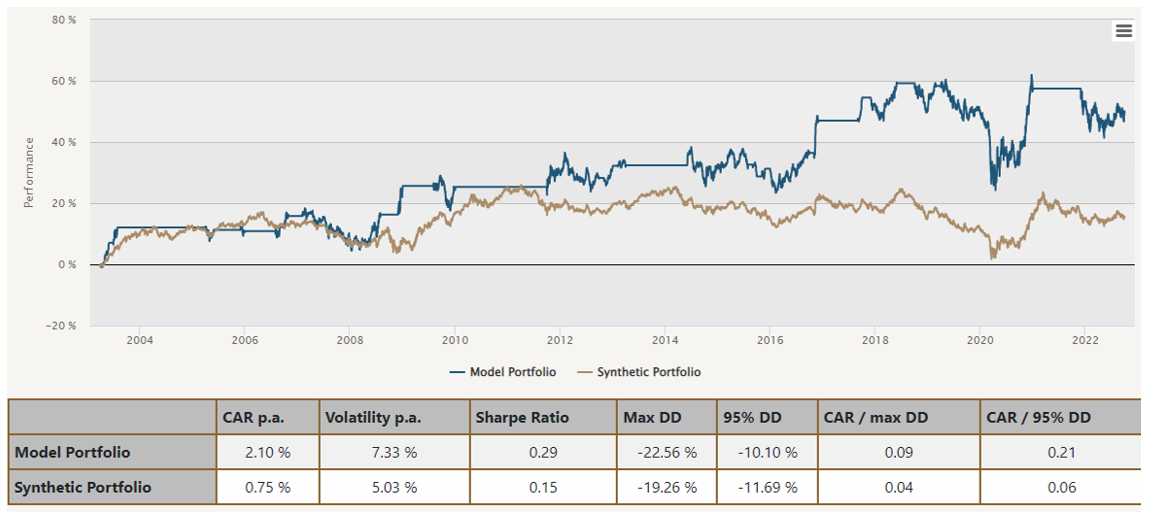
Figure 6 Synthetic Portfolio (Model Portfolio: 100% #133)
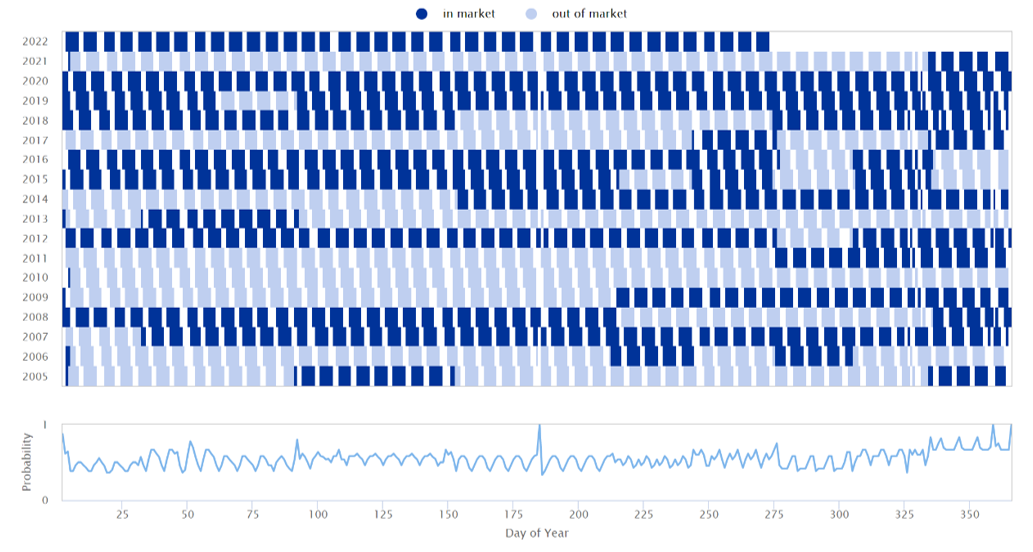
Figure 7 Model Portfolio: 100% #133 – daily weighting coefficient
However, this may have a significant added value if averaged across a more extended period. Hence why we developed this approach with our historical portfolio replication in mind. The following figures show the extended synthetic performance of the above-mentioned strategies. They were constructed utilizing the approach introduced in this article from our historical factor universe previously presented in How to Replicate Any Portfolio.
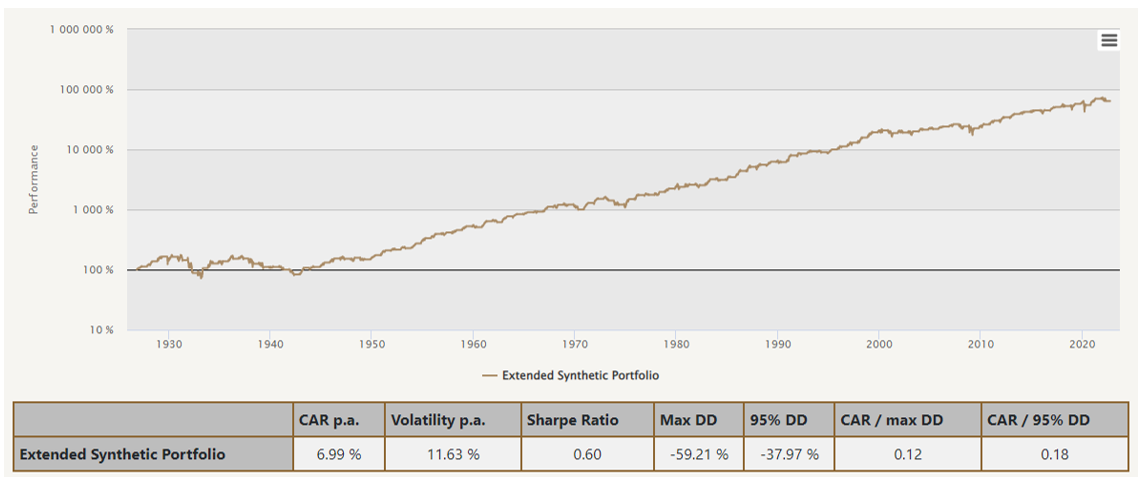
Figure 8 Extended Synthetic Portfolio (Model Portfolio: 100% #031)
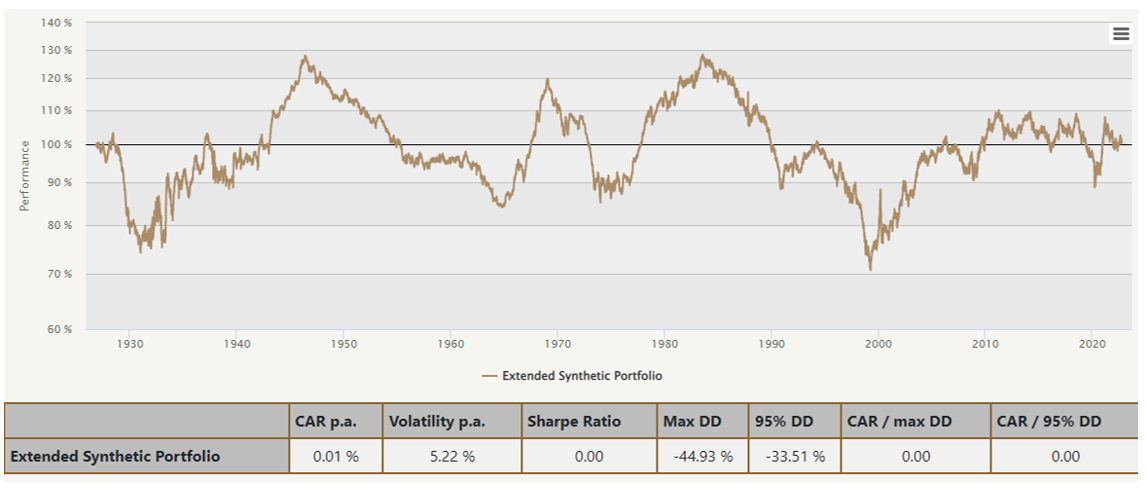
Figure 9 Extended Synthetic Portfolio (Model Portfolio: 100% #133)
Conclusion
In an attempt to capture the effects of market timing in factor replication, we came up with an approach that addresses the issue in a simple replicable manner. It allows us to perform the multi factor analysis without a need to implement any recognition algorithms for market-timing strategy. Moreover, we simply do not need to distinguish between different types of strategies.
We based the method on analyzing probability of in-market strategy state on day-of-year basis. The replication results show that our method works very well on the subset of market-timing strategies built on calendar-based or period-based rules.
We built this method with historical factor replication in mind. Overlaying the probability pattern across an extended period averages the market-timing effects across the whole period which in turn effects the performance of the synthetic portfolio. Therefore, the results still carry a significant value for the types of market-timing strategies with irregular in-market patterns.
Are you looking for more strategies to read about? Sign up for our newsletter or visit our Blog or Screener.
Do you want to learn more about Quantpedia Premium service? Check how Quantpedia works, our mission and Premium pricing offer.
Do you want to learn more about Quantpedia Pro service? Check its description, watch videos, review reporting capabilities and visit our pricing offer.
Do you want algorithmic access to the full Quantpedia database via the API? Subscribe to Quantpedia Pro, ask for an API key, and explore the in/out-of-sample statistics, source academic papers, and code snippets — ideal for quantitative research, systematic trading workflows, and AI model training.
Are you looking for historical data or backtesting platforms? Check our list of Algo Trading Discounts.
Or follow us on:
Facebook Group, Facebook Page, Telegram, Twitter, Linkedin, Medium or Youtube
Share onLinkedInTwitterFacebookRefer to a friend


