Active vs. Passive Life Cycle Savings Strategies
The main goal of our new article is to explore the efficacy of passive versus active management strategies in the context of savings for long-term financial goals. By analyzing the performance of nine distinct asset classes, including Double Leveraged ETFs and an implementation of the Pragmatic Asset Allocation (PAA) strategy, over an almost-century-long horizon, we simulate and compare the outcomes of three passive and three active strategies. This comparative analysis focuses on their influence on key investment characteristics, including Final Portfolio Size, Maximum Drawdown, and Maximum Loss, to determine their potential in enhancing long-term investment results.
Introduction
Concept of savings is crucial in financial planning – not only to accumulate wealth, but also for ensuring a stable future. Present article looks at different ways to save: the traditional, more passive approaches as well as dynamic, active approach following Life-Cycle logic — a strategy that advocates for a transition from higher-risk to lower-risk assets throughout time.
Passive investment strategies involve selecting a portfolio with a fixed composition and sticking with it for a certain duration. In contrast, active strategies adjust the asset weights within the portfolio over time. Among active strategies, Life-Cycle strategies can be passive or active themselves. A typical passive Life-Cycle fund is a collection of funds that follow predetermined allocations in asset classes. An active Life-Cycle fund involves the portfolio manager dynamically adjusting the asset mix over time.[1] Active strategies can be integrated with other strategies, for example, as is the case in this study, the Pragmatic Asset Allocation (PAA) strategy.
The debate on savings often centers on whether it’s better to always invest in stocks or use a mix of stocks and bonds, commonly using the rule that your stock investment should be “100 minus your age.”[2] Some have critiqued the conventional age-based strategy for asset allocation, highlighting the market’s inherent unpredictability. Paul A. Samuelson argue that if stock market movements are essentially random, systematically transitioning from high-risk to low-risk assets with age may not be the most effective approach. Samuelson later suggested that having a basic amount of money saved for retirement could actually support gradually moving from riskier investments to safer ones as you get older.[3]
In this setting, Life-Cycle funds stand out as a smart strategy, automatically shifting your investment from stocks to bonds and cash as your savings journey progresses towards its horizon. This method follows the concept of adjusting investments based on the stage of your saving period, aiming to maximize growth in the initial phases and focus on protecting your capital as the endpoint of your savings goal approaches.
While some academic studies have criticized target-date funds for not being aggressive enough (Schleef and Eisinger, 2007)[4], others have shown preference for Life-Cycle funds over generic passive funds (Pfau, 2010)[5]. This study aims to look into and compare passive and active savings strategies, employing simulations to see the dynamics and outcomes of each approach over a nearly century-long horizon. Every year, we start a new cycle of saving $100 every month for 20 years, allowing us to observe the evolution of the target amount under both passive and active management strategies. Additionally, we’ll examine the impact of Double Leveraged ETFs on the final savings amount and determine which strategy— passive or active — offers superior outcomes. By analyzing both passive (with a fixed asset composition) and active portfolios (with changing asset weights), we aim to contribute to the discussion on the most effective approach to savings.
Data and Methodology
For this study, we collected monthly performance data for nine distinct asset classes, ranked by their risk levels, using the same dataset as in our previous research on the Pragmatic Asset Allocation Model. Among these, we included 200% Leveraged Stocks, designed to deliver twice the daily performance of their benchmarks. While Triple Leveraged ETFs are available, we opted for Double Leveraged ETFs for safety reasons primarily and because we consider them sufficiently representative for the goals of this study. Our analysis also encompasses US Stocks, specifically the S&P 500 ETF, an indicator of the overall stock market performance in the US. Additionally, we examined the NASDAQ 100 index comprising 100 of the largest companies on Nasdaq Stock Exchange predominantly from technology sector. Our study extends to the MSCI ACWI (All Country World Index) that comprises stocks from both developed and emerging markets globally, and the MSCI EM (Emerging Markets), focusing on large and mid-sized companies in emerging markets. The asset classes also include 10-year US Treasury Bonds, Gold, recognized as a “safe haven” asset, and Commodities, which involve physical goods such as oil, natural gas, metals, and agricultural products, alongside Cash. Furthermore, the Pragmatic Asset Allocation (PAA) strategy, although traditionally viewed more as a strategy than an asset class, is incorporated into our study as an additional “asset.” The Pragmatic Asset Allocation (PAA) strategy is designed for investors who prefer a balanced approach, offering a way to participate in global market opportunities with less effort. It combines the advantages of Global Tactical Asset Allocation (GTAA), such as investing in high-performing markets, but with fewer demands for frequent portfolio adjustments. Essentially, PAA allows investors to achieve smarter investment outcomes by making strategic, occasional changes rather than constant monitoring and rebalancing.
Our analysis begins on November 30, 1926 and we simulate a saving strategy where $100 is saved and invested monthly, for a period of 20 years. This process is initiated annually, resulting in 96 separate investment paths, each representing a 20-year saving period.
We computed equity curves based on the monthly performance data to determine the end value of saving $100 monthly, the maximum drawdown, and the maximum loss. We also analyzed the probability distribution of returns, maximum drawdowns, and losses at the conclusion of the investment horizon. We considered outcomes at the 5th, 25th, 50th, 75th, and 90th percentiles. We paid particular attention to the 25th percentile to adopt a conservative stance, assuming that 75% of future outcomes would be more favorable. This approach reflects our cautious perspective, given the unlikeliness of consistently high performance over a 20-year span.
Subsequently, we constructed and evaluated several saving strategies, distinguishing between passive and active portfolio management approaches. While crafting passive strategies was relatively straightforward—setting asset weights initially and maintaining them throughout—the active strategies required us to periodically adjust the weights of the assets.
Results
Idea 1: Passive strategy: 100% SPY
A passive saving strategy involves maintaining a fixed allocation of asset classes over time. In this context, we explore a straightforward passive strategy: investing $100 monthly into 100% US Stocks over a 20-year period.
Table 1 provides a detailed view of the potential risk and return of saving entirely in US Stocks, broken down by various percentiles. Final size column represents the ending value of the investment portfolio, Drawdown indicates the maximum percentage decrease from the portfolio’s peak to its bottom before a new peak is achieved, Loss shows the actual reduction from the portfolio’s highest accumulated value during the entire saving period. We distinguish between drawdown and loss because losses are of greater concern for investors as they reflect the actual decrease from the portfolio’s peak value, indicating a tangible reduction in wealth.
As mentioned, outcomes can vary widely depending on the percentile considered. 5th Percentile is near the worst-case scenario, with only 5% of outcomes being worse. The final portfolio size is $37,696, with a significant drawdown and loss of -81.5% and -74.7%, indicating a high-risk outcome. 25th Percentile represents a conservative outlook, where 75% of outcomes are expected to be better. The final size is $53,692, with a drawdown and loss of -45.0% and -36.6%, showing less volatility and risk compared to the 5th and 10th percentile. Finally, 90th Percentile is among the most favorable scenarios and demonstrates high final values ($131,194), with the smallest drawdown (-22.5%) and loss (-9.1%) in the Table 1, indicating that only 10% of outcomes surpass this. For visual comparison, see Figure 1 illustrating the growth of savings across the 10th, 25th, 50th, and 75th percentiles over the 20-year saving period.
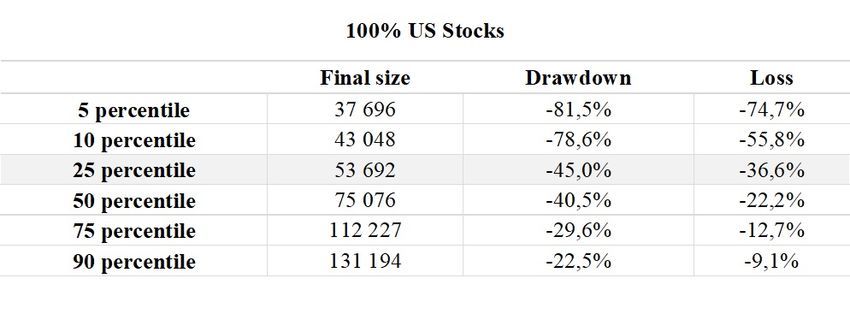
Table 1 Risk and Return Profile for Saving 100% in US Stocks
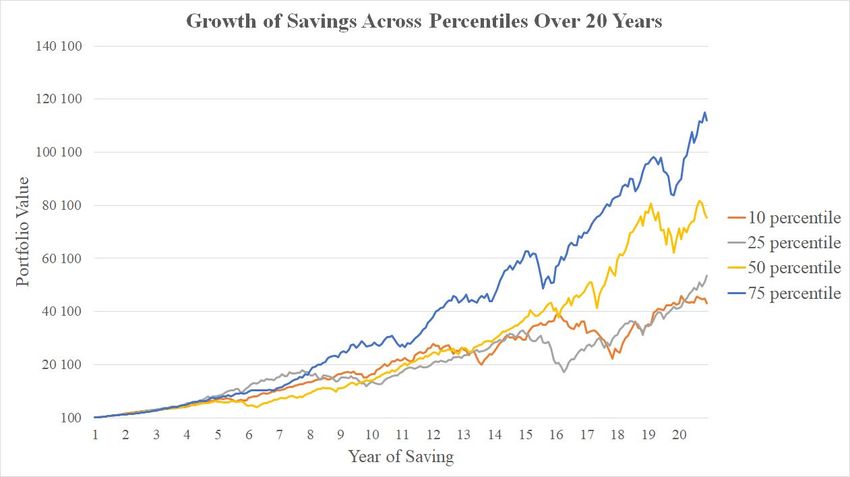
Figure 1 Growth of Savings Across Percentiles Over 20 Years
Idea 2: Passive strategy: 100% each of the asset class
Analogically, we examined passive investment strategies involving a monthly investment of $100 across various asset classes, including Leveraged Stocks, US Stocks, NASDAQ, MSCI ACWI, MSCI EM, US Bonds, Gold, Commodities, and Cash over a 20-year period. Table 2 shows the risk and return profiles of these asset classes.
This analysis highlights the fundamental principle of risk versus reward in saving and investing. Asset classes with higher risk, such as 200% Leveraged US Stocks and NASDAQ, offer the potential for significant returns but come with a higher risk. On the other hand, cash investments, which inherently have no drawdown, represent the safest option but offer the lowest growth potential.
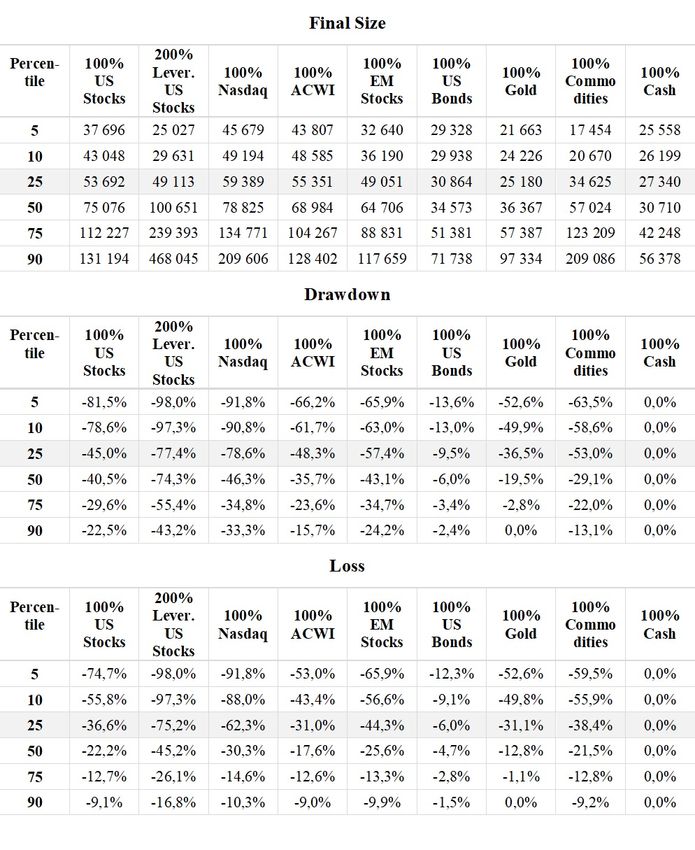
Table 2 Risk and Return Profile for Saving 100% in each asset
Idea 3: Passive Strategy: 50% Leveraged Stocks 50% Bonds
In an effort to explore diversified investment strategies, we considered a passive approach that splits savings between Leveraged US Stocks and US Bonds. We hypothesized that such a portfolio might outperform traditional allocations like 100% in SPY or a 60% SPY – 40% Bonds mix in terms of overall portfolio characteristics.
However, as illustrated in Table 3, our findings did not support this hypothesis. The performance metrics of the mixed portfolio—comprising 50% Leveraged US Stocks and 50% US Bonds—in terms of final size, drawdown, and loss were found to be similar to those of a portfolio consisting entirely of stocks. Characteristics for 100% US Stocks allocation and the 60% US Stocks – 40% US Bonds mix are detailed in Tables 4 and 5.
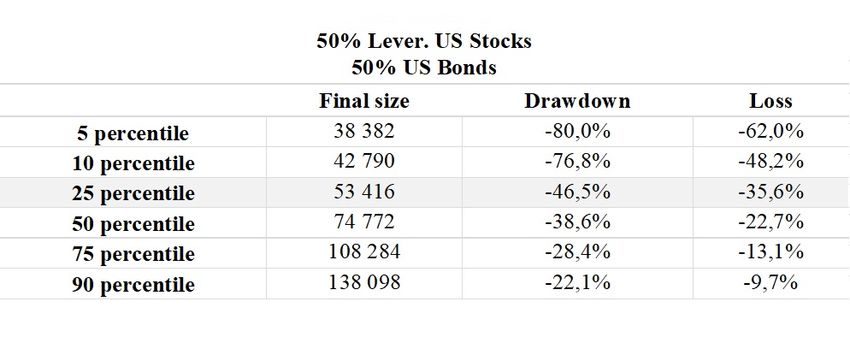
Table 3 Risk and Return Profile for Saving 50% in Leveraged US Stocks and 50% in US Bonds
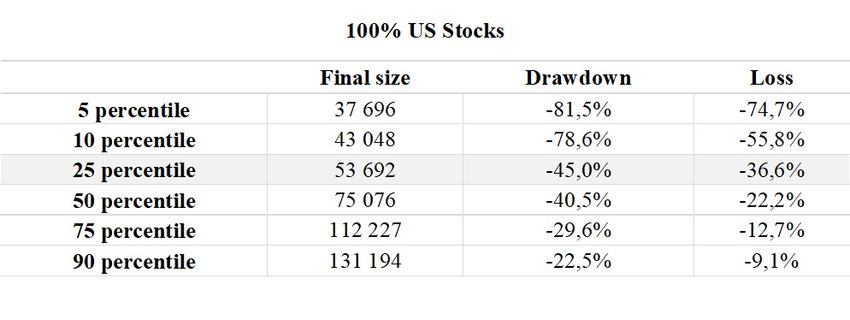
Table 4 Risk and Return Profile for Saving 100% in US Stocks
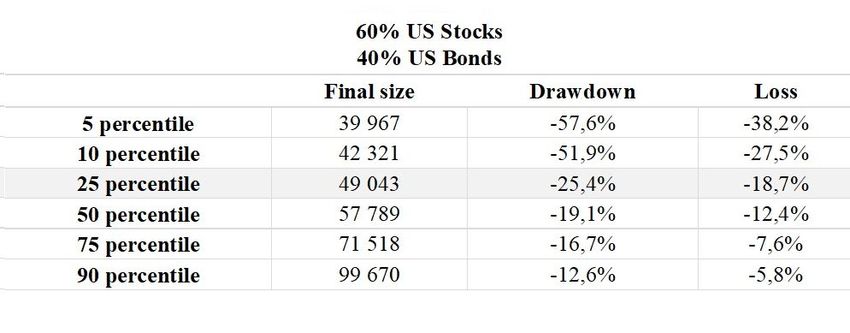
Table 5 Risk and Return Profile for Saving 60% in US Stocks and 40% in US Bonds
Idea 4: Active Strategy: Passive Life-Cycle
Unlike static passive strategies, active strategies involve a dynamic asset allocation that changes over time. This is what Life-Cycle Investing represents. It begins with an investment in more volatile assets (like stocks) and progressively shifts towards safer assets (like bonds) as the investment horizon approaches. In other words, this method involves adjusting the asset allocation weights over time. We examined two variations of Life-Cycle investing:
- Classic Life-Cycle Investing: Starts with 100% allocation in US Stocks for the first 15 years, then gradually shifts to 100% Bonds by year 20.
- Life-Cycle Approach with Leveraged Start: Starts with an allocation in 200% Leveraged Stocks, transitioning to 100% US Stocks by the end of the first 5 years, maintains this allocation for the next 10 years, and then shifts to 100% Bonds in the final 5 years leading up to year 20.
Table 6 indicates that the performance characteristics of both approaches are comparable, and there is no advantage to using Leveraged US Stocks in the above-mentioned designed Life Cycle portfolios.
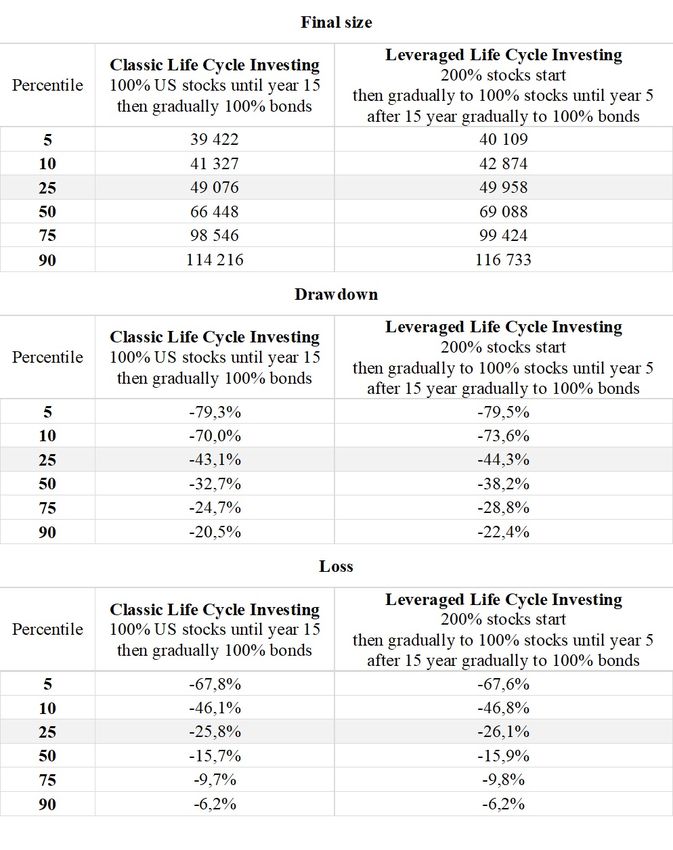
Table 6 Risk and Return Profile for Life-Cycle
Idea 5: Active Strategy: Pragmatic Asset Allocation (PAA)
The Pragmatic Asset Allocation (PAA) model is an innovative strategy for semi-active investors, aiming to blend the benefits of Global Tactical Asset Allocation (GTAA) with fewer rebalancing requirements. In this context, PAA is treated as its own investment class rather than a strategy. As demonstrated in Table 7, allocating $100 monthly over 20 years to PAA offers a final size similar to that of the Nasdaq but with considerably lower drawdowns, indicating reduced volatility.
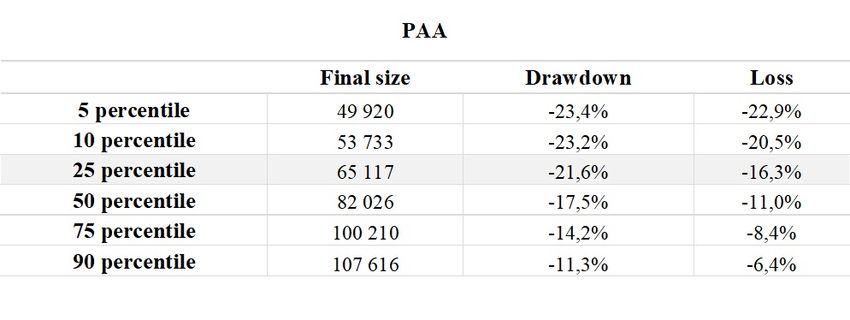
Table 7 Risk and Return Profile for Pragmatic Asset Allocation
Idea 6: Active Strategy: Life-Cycle PAA:
Our final concept explores maximizing the potential of the Pragmatic Asset Allocation (PAA) by initially taking on more risk. The strategy begins by investing in 200% US Stocks for the first two years. Then, over the next three years, we transition gradually to a mix of 65% PAA and 35% Leveraged Stocks, maintaining this allocation until year 10. From year 10 onward, we keep 65% PAA, decrease 200% US Stocks gradually from 35% to 15%, while investing in US Bonds until at year 20 we have 65% PAA, 15% Leveraged US Stocks and 20% US Bonds. The outcomes of this strategy are detailed in Table 8.
Compared to the first portfolio presented in this paper – passive strategy of 100% stock investment, this Life-Cycle PAA approach achieves similar or even slightly lower volatility (41.1% drawdown vs. 45% for Stocks) but delivers superior performance (final size of 25th percentile is $75,017 vs. $53,692). This pattern holds true when comparing it to the Traditional Life-Cycle strategy as well, offering a 50% higher return at the same level of risk.
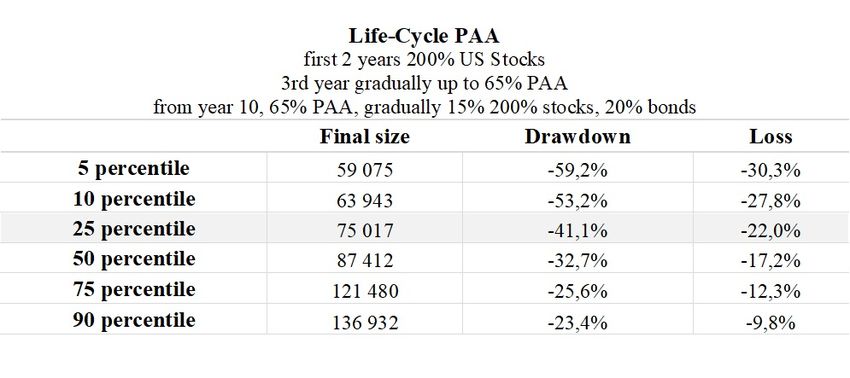
Table 8 Risk and Return Profile for Life-Cycle PAA
Conclusion
This study contributes to the ongoing debate on passive versus active saving strategies focusing on achieving long-term financial goals. Through simulations based on data spanning almost a century, this study evaluates the balance between risk and return in both approaches. Traditional passive approaches, with fixed investment allocations, and active Life-Cycle strategies, which begin with investments in riskier assets before transitioning to safer ones.
The analysis include variety of assets, including riskier ones like Double Leveraged ETFs and introduces the Pragmatic Asset Allocation (PAA) as an innovative asset.
We evaluated six distinct strategies: three passive (100% US Stocks, 100% other assets and a blend of 50% Leveraged Stocks and 50% Bonds); and three active Life-Cycle strategies, including a traditional Life-Cycle model, a PAA strategy, and a combined PAA Life-Cycle approach. We evaluated these strategies based on key metrics: the final portfolio size, maximum drawdown, and maximum loss, with a particular focus on the conservative 25th percentile as a measure of risk.
The findings indicate that while passive strategies offer a stable and straightforward approach for investors desiring consistency, active strategies—particularly those incorporating the PAA model—present a more dynamic opportunity to achieve higher returns with similar or even reduced risk levels.
Author: Margaréta Pauchlyová, Quant Analyst, Quantpedia
Are you looking for more strategies to read about? Sign up for our newsletter or visit our Blog or Screener.
Do you want to learn more about Quantpedia Premium service? Check how Quantpedia works, our mission and Premium pricing offer.
Do you want to learn more about Quantpedia Pro service? Check its description, watch videos, review reporting capabilities and visit our pricing offer.
Are you looking for historical data or backtesting platforms? Check our list of Algo Trading Discounts.
Or follow us on:
Facebook Group, Facebook Page, Twitter, Linkedin, Medium or Youtube
[1] SCHOOLEY, Diane K.; WORDEN, Debra Drecnik. Investors’ asset allocations versus life-cycle funds. Financial Analysts Journal, 1999, 55.5: 37-43.
[2] BODIE, Zvi; CRANE, Dwight B. Personal investing: Advice, theory, and evidence. Financial Analysts Journal, 1997, 53.6: 13-23.
[3] SAMUELSON, Paul A. A case at last for age-phased reduction in equity. Proceedings of the national academy of sciences, 1989, 86.22: 9048-9051.
[4] SCHLEEF, Harold J.; EISINGER, Robert M. Hitting or missing the retirement target: Comparing contribution and asset allocation schemes of simulated portfolios. Financial Services Review, 2007, 16.3: 229.
[5] PFAU, Wade D. Lifecycle funds and wealth accumulation for retirement: Evidence for a more conservative asset allocation as retirement approaches. Financial Services Review, 2009, 19.1.
Share onLinkedInTwitterFacebookRefer to a friend


