Anomaly Discovery and Arbitrage Trading
Today, we will look closer into the hood of life expectancy of investment strategies and try to answer the critical question on which many, in some sense, if not all, trading strategies are built: what happens with anomalies after their discovery? Especially inspected variable concerns the size of trading AUM (asset under management) of hedge funds (HFs) that are performing arbitrage opportunities and a few minor other characteristics such as the research prominence.
The paper’s authors, with the sweet, simple name Anomaly Discovery and Arbitrage Trading, analyze a stylized model of anomaly discovery, which has implications for both asset prices and arbitrageurs’ trading. Their original research produced an arbitrageur-based asset pricing model that shows that discovering an anomaly reduces the correlation between the returns of its long- and short-leg portfolios: HFs (professional arbitrageurs) use to increase (unwind) such trades when their wealth increases (decreases), further supporting the view that the discovery effects work through arbitrage trading. This effect is more substantial when arbitrageurs’ wealth is more volatile. The study is thoughtful and precise, totaling 99 different anomalies. Furthermore, after discovering an anomaly, hedge funds increase their positions by exploiting it. What is interesting to see that results are more robust for anomalies discovered by studies with more citations.
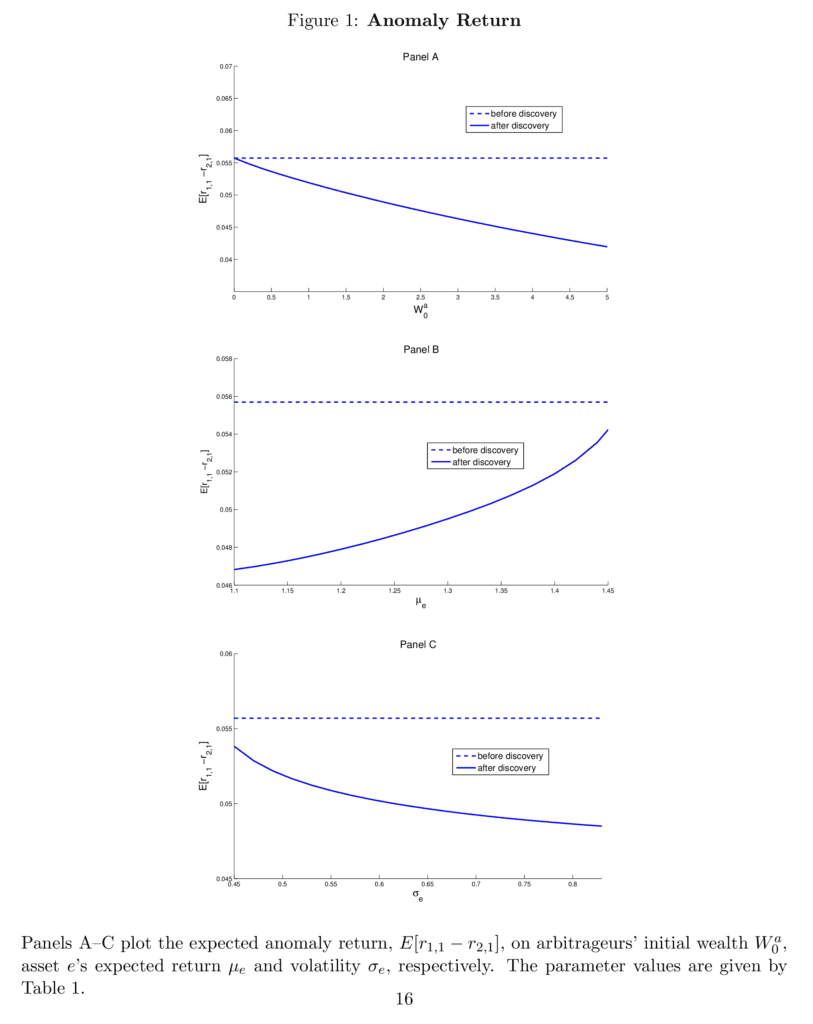
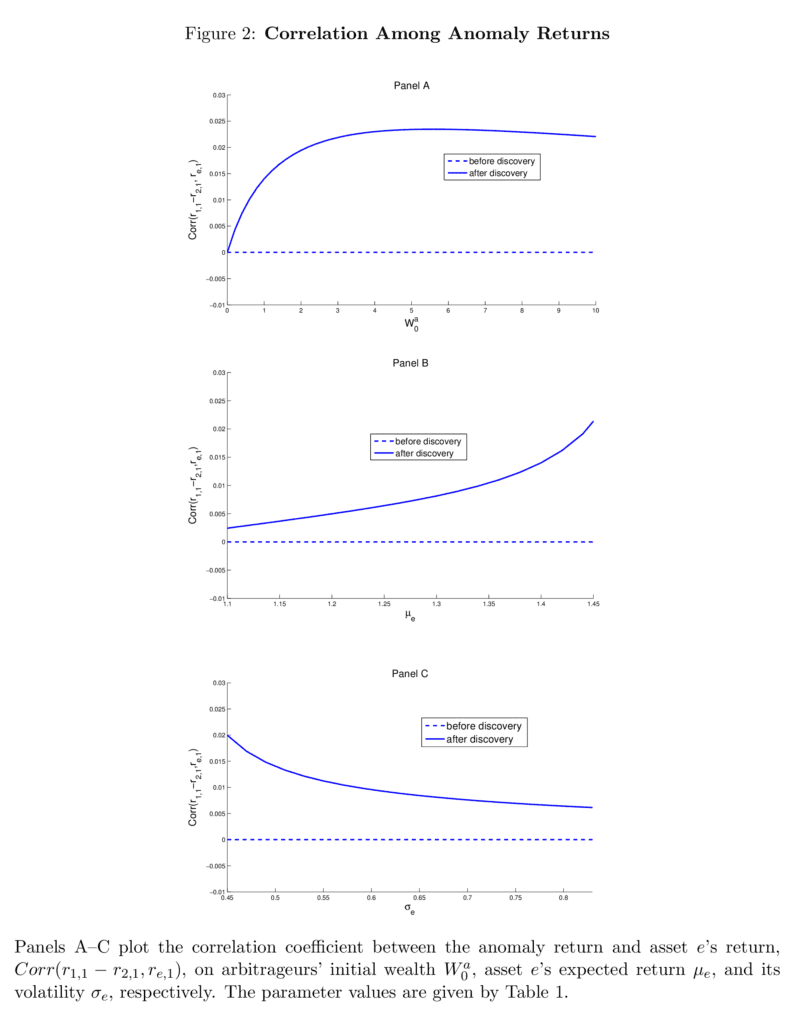
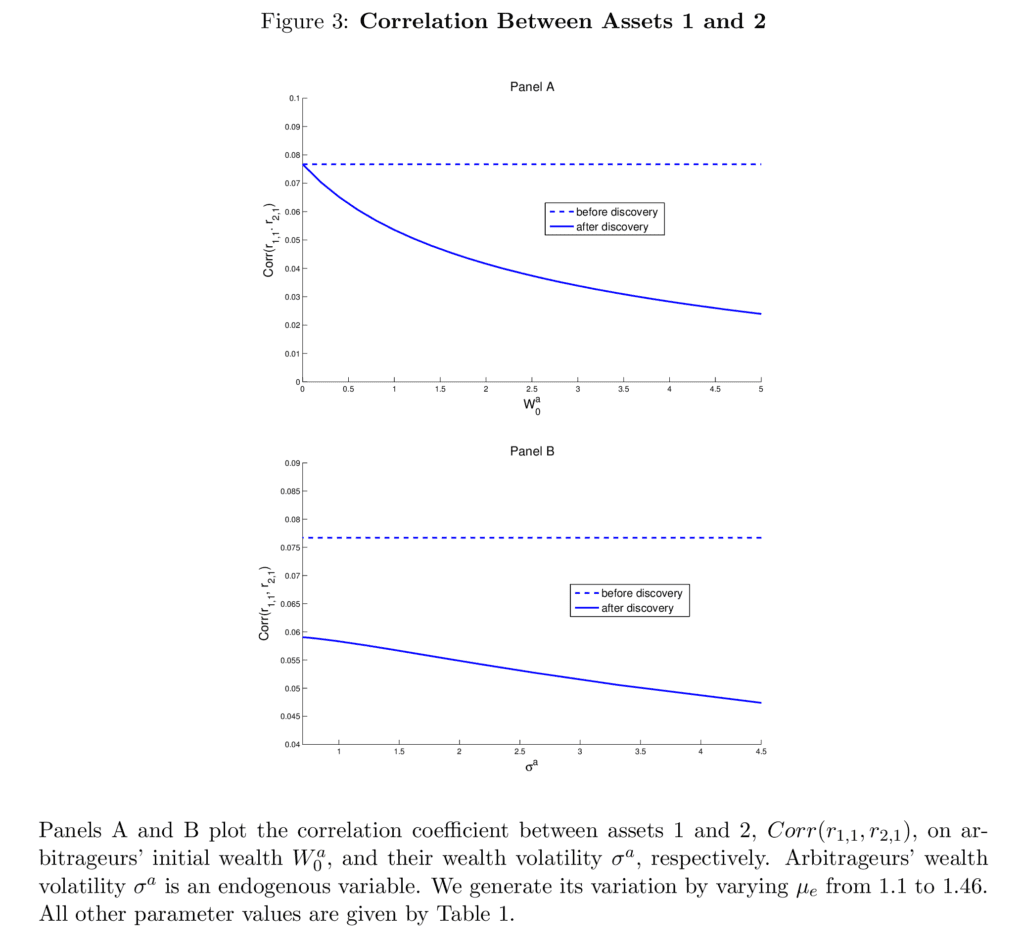
Let’s now take a closer look at our selected 3 figures which nicely depict the study’s results in a nutshell. Figure 1 illustrates the effects of discovery on the expected anomaly returns. The dashed line represents the size of the anomaly before the discovery. After the discovery, arbitrageurs exploit the opportunity, reducing the expected anomaly return. The discovery reduces the expected anomaly return from 5.5% to 5%. HFs will allocate more investment to the newly discovered anomalies. That is, the wealth effect increases the correlation between the newly discovered anomaly return and the return from the existing anomaly (Fig. 2). When arbitrageurs’ wealth decreases, they will unwind some of their positions in the long-short portfolio; arbitrageurs’ wealth shocks push the returns of the two assets in opposite directions, which reduces the correlation between the returns of assets (Fig. 3).
What’s on the take for us? Suppose we find an exciting opportunity and see it employed by entities bigger than us, which also deploy more capital. In that case, we should just keep replicating them, and exploit the market inefficiency eventually to the point, that it is overcrowded and completely loses its relevance. What matters is to be quick after the discovery and initial adoption of big HF.
There is also another thing to bear in mind. If you spot new dissonance of performance of one asset in your diversified portfolio, it may be because some contributor (understand large HF performing arbitrage) to its outsized returns simply stopped engaging in the execution of strategy targeting the long or short leg of their systematic portfolio, because he moved a portion of capital into the newer-discovered market anomaly. You might consider cutting exposure to those assets as well.
Authors: Xi Dong, Qi Liu, Lei Lu, Bo Sun, and Hongjun Yan
Title: Anomaly Discovery and Arbitrage Trading
Link: https://papers.ssrn.com/sol3/papers.cfm?abstract_id=2431498
Abstract:
We analyze a stylized model of anomaly discovery, which has implications for both asset prices and arbitrageurs’ trading. Our evidence based on 99 anomalies is consistent with the prediction that the discovery of an anomaly reduces the correlation between the returns of its deciles 1 and 10 portfolios. This effect becomes linked to the aggregate trading of hedge funds only after discovery. Hedge funds increase (reverse) their positions in exploiting anomalies when their aggregate wealth increases (decreases), further suggesting that these discovery effects operate through arbitrage trading.
And as always, we present several exciting figures and tables:
Notable quotations from the academic research paper:
“We empirically test [] implications based on 99 anomalies that can be constructed based on widely accessible public data. For each anomaly, we construct a dummy variable that takes the value of 0 before its “discovery” and 1 afterwards. We use the publication time of the paper that documented the anomaly (or latest working paper dates for unpublished papers) as a proxy for the discovery time.
We first test the discovery effect on the correlation between the long and short leg returns. Specifically, for each anomaly, we use a five-year rolling window to estimate the correlation coefficient between the monthly excess returns of deciles 1 and 10. To control for its potential time trend, our analysis focuses on excess correlation: the correlation between deciles 1 and 10 minus the correlation between deciles 5 and 6. The idea is that arbitrageurs are likely to take larger long-short positions in deciles 1 and 10 than in deciles 5 and 6. Hence, the correlation between deciles 5 and 6 should have little discovery effect, but should share the common time trend with the correlation between deciles 1 and 10.
We then regress the excess correlation on the discovery dummy with anomaly fixed effects. The coefficients for the discovery dummy are significantly negative and imply that the discovery of an anomaly reduces the excess correlation measure by 4% to 10%, which represents 33% to 83% of the standard deviation of the measure.
We then link the discovery effect to arbitrageurs. Specifically, our model implies that after the discovery of an anomaly, the excess correlation between its deciles 1 and 10 becomes more negatively correlated with the volatility of arbitrageurs’ wealth. To test this prediction, we use the aggregate AUM of U.S. equity hedge funds as a proxy for arbitrageur’s wealth. We run a panel regression of the excess correlation measure on the interaction term of the discovery dummy and the hedge fund AUM volatility. Consistent with the model prediction, the estimated interaction coefficients are significantly negative. A one-standard deviation increase in the AUM volatility increases the magnitude of the discovery effect on the excess correlation by 3% to 10%. Note that this prediction is the opposite of the conventional wisdom that the correlations among asset returns increase with the market volatility.2 Hence, our empirical evidence suggests that the discovery effect in our model dominates the effect implied by the conventional intuition.
Consistent with our model predictions, the trading intensity measure for an anomaly is significantly positive only after the anomaly’s discovery. The average of the post-discovery trading intensity measure is over 12 times that of its pre-discovery level. The implied trading activity is 0.85% of the total shares outstanding of the traded stocks. Our evidence also suggests that, after the discovery of an anomaly, hedge funds expand (unwind) their positions in the anomaly when their aggregate AUM increases (decreases). A one standard deviation increase in the aggregate AUM of all hedge funds leads to an increase in their quarterly trading intensity in the anomaly by up to 0.8% of the total shares outstanding. These effects are economically significant, especially given recent evidence that hedge fund transactions are most effective, among all investors, in affecting asset prices (Dong, Kang, and Peress, 2020; Koijen, Richmond, and Yogo, 2022). We also separately analyze the effects on the long and short legs of the anomalies. Consistent with the model prediction, we find that the discovery of an anomaly affects hedge fund trading in both deciles 1 and 10 of the anomaly, but in opposite directions.
Our interpretation suggests that the discovery effect should be stronger for anomalies that attract more attention from arbitrageurs. To test this, for each anomaly, we use the Google citation count of the original study that discovered the anomaly as a proxy for this attention. The idea is that anomalies that are highly cited by both academic and practitioner journals are more likely to be robust and attract more attention from arbitrageurs.
After the discovery, arbitrageurs start exploiting the opportunity, reducing the expected anomaly return. As shown by the solid line in Panel A [Figure 1], the post-discovery expected anomaly return is lower than that in the pre-discovery case (i.e., the solid line is below the dashed line). […]
The plot also shows that the effect of discovery is stronger when arbitrageurs have more wealth. For example, in the case W0a = 5, the discovery reduces the expected anomaly return from 5.5% to 4%. The discovery effect disappears when W0a = 0. One can think of this W0a = 0 case as representing the traditional modeling approach, where discovery does not change the set of investors who are aware of the anomaly.
Panels B and C demonstrate the effects of arbitrageurs’ existing investment opportunity (i.e., asset e). If arbitrageurs’ existing strategy is more attractive (i.e., μe is higher, or σe is lower), they will allocate less capital to exploit the new anomaly and so its expected return will drop less. As shown in Panels B and C, after the discovery of an anomaly, its expected return is increasing in μe and decreasing in σe.
Figure 2[:] Panel A plots the correlation coefficient between r1,1 − r2,1 and re,1. Before the discovery, as illustrated by the dashed line, the correlation is 0. In contrast, the post-discovery correlation, shown by the solid line, is positive. The only exception is the case W0a = 0, where the correlation is zero, the same as in the pre-discovery case. Again, one can view this special case as the traditional approach that abstracts away from discovery.
Figure 3[:] The dashed line in Panel A is for the pre-discovery correlation between assets 1 and 2. Since arbitrageurs are on the sidelines before the discovery, their wealth level W a 0 does not affect the correlation. Hence, the dashed line is flat. The post- discovery case is represented by the solid line. It is below the dashed line, suggesting that the discovery reduces the correlation between assets 1 and 2. It also shows that the larger the size of arbitrage capital, the larger the reduction in the correlation.”
Are you looking for more strategies to read about? Sign up for our newsletter or visit our Blog or Screener.
Do you want to learn more about Quantpedia Premium service? Check how Quantpedia works, our mission and Premium pricing offer.
Do you want to learn more about Quantpedia Pro service? Check its description, watch videos, review reporting capabilities and visit our pricing offer.
Do you want algorithmic access to the full Quantpedia database via the API? Subscribe to Quantpedia Pro, ask for an API key, and explore the in/out-of-sample statistics, source academic papers, and code snippets — ideal for quantitative research, systematic trading workflows, and AI model training.
Are you looking for historical data or backtesting platforms? Check our list of Algo Trading Discounts.
Or follow us on:
Facebook Group, Facebook Page, Telegram, Twitter, Linkedin, Medium or Youtube
Share onLinkedInTwitterFacebookRefer to a friend


