Quantpedia Update – 1st October 2016

1.October 2016

Two new strategies have been added:

#320 – Natural Gas Futures Trading Based on Informed Traders Forecasts
#321 – International Carry Investing on the Yield Curve

Two new related research papers have been included into existing strategy reviews. And two additional related research papers have been included into existing free strategy reviews during last 2 weeks.

Continue reading

Option Pricing Methods in the Late 19th Century

29.September 2016

We at Quantpedia consider ourselves a history freaks as we love books and papers related to a history of finance. The work of Dotsis is a perfect example of an interesting paper about a history of option pricing and shows how people were remarkably skilled in assessing price of options even without current high performance IT tools. Academic paper could be related to #20 – Volatiity Risk Premium Effect …

Authors: Ghoddusi

Title: Option Pricing Methods in the Late 19th Century

Link: http://papers.ssrn.com/sol3/papers.cfm?abstract_id=2831362

Abstract:

This paper examines option pricing methods used by investors in the late 19th century. Based on the book called “PUT-AND-CALL” written by Leonard R. Higgins in 1896 and published in 1906 it is shown that investors in that period used routinely the put-call parity for option conversion and static replication of option positions, and had developed no-arbitrage pricing formulas for determining the prices of at-the-money and slightly out-of-the-money and in-the-money short-term calls and puts. Option traders in the late 19th century understood that the expected return of the underlying does not affect the price of an option and viewed options mainly as instruments to trade volatility.

Notable quotations from the academic research paper:

"In this paper I show that option traders in the late 19th century not only had an intuitive grasp of the main determinants of option prices but they have also developed no-arbitrage pricing formulas for determining their prices. The option pricing formulas are described in a book called “PUT-AND-CALL” written by Leonard R. Higgins in 1896 and published in 1906.2 Higgins was an option trader in London and in his book he describes option pricing methods and option strategies used in the late 19th century in the City of London.

The pricing approach described in Higgins book could be summarized as follows: First, traders were pricing short-term ATMF straddles (30, 60 or 90 days to maturity. The prices of the ATMF straddles were set equal to the risk-adjusted expected absolute deviation (Higgins uses the term average fluctuation) of the underlying price from the strike price at expiration. The expectation of the absolute deviation was based on historical estimates plus a risk premium for future uncertainty as well as some other markups. Given the ATMF straddle prices as reference points Higgins is using a linear approximation formulae based on put-call parity to price slightly out-of-the-money (OTM) and slightly in-the-money (ITM) put and call options. I show that the approximation used by Higgins is analogous to a first order Taylor expansion around the ATMF straddle price.

Higgins’s book is an important reference in the history of option pricing because it provides a pricing framework based on empirical rules and approximation methods for determining option prices. Higgins’s method could be taught in introductory derivatives valuation courses before the Black and Scholes and the binomial model to help students appreciate the historical development of option pricing methods and the contribution of option market practitioners."


Are you looking for more strategies to read about? Check http://quantpedia.com/Screener

Do you want to see performance of trading systems we described? Check http://quantpedia.com/Chart/Performance

Do you want to know more about us? Check http://quantpedia.com/Home/About

Continue reading

Does Interest Rate Exposure Explain the Low Volatility Anomaly?

24.September 2016

Related to:
#6 – Volatility Effect in Stocks – Long-Short Version

Authors: Driessen, Kuiper, Beilo

Title: Does Interest Rate Exposure Explain the Low Volatility Anomaly?

Link: http://papers.ssrn.com/sol3/papers.cfm?abstract_id=2831157

Abstract:

We show that part of the outperformance of low volatility stocks can be explained by a premium for interest rate exposure. Low volatile portfolios have a positive exposure to interest rates, whereas the more volatile stocks have a negative exposure. Incorporating an interest rate premium explains part of the anomaly. Depending on the methodology chosen the reduction of unexplained excess return is between 20% and 80%. Our results provide evidence that interest rate risk is priced differently in the bond and equity market. Our results imply a strong implicit exposure of low volatility portfolios to bonds.

Notable quotations from the academic research paper:

"A relation between the low volatility anomaly and government bonds makes sense if volatility is thought of as an indicator of how far equity is removed from bonds in the capital structure. In this study our main finding is that the outperformance of low volatility stocks can be explained by differences in interest rate exposure. We find that low volatility portfolios have more exposure to this risk. Our results imply a strong implicit exposure to interest rate risk of low volatility portfolios. We estimate that the duration of the lowest volatility decile corresponds to a 30% weight to bonds. The duration of the highest decile corresponds to a short position of 100% short bonds.

Because of the differences in exposure, the risk premium that we estimate explains part of the excess return of a long short portfolio. We find a monthly compensation of interest rate risk in equities of 0.91%, with a standard error of 0.20%. The differences in interest rate exposure combined with the large estimated risk premium, results in a significantly reduced mispricing of low volatility stocks. We find these results to be robust for taking into account the time variance of the interest rate exposure.

For our study we use ten portfolios over the period from July 1963 to December 2014, defined by sorts on residual variance of individual US stocks using the Fama French 3 factor model. In section 3 we elaborate further on this. We define an interest rate factor as the return of an equal weight portfolio consisting of US government bonds with various maturities. In order to estimate the interest rate exposure we run time series regressions. Fama MacBeth regressions are employed to estimate the premium for the interest rate exposure. Combined these two enable us to evaluate the impact of this effect on the unexpected excess return of the long short portfolio. We use several different estimations of the premium in order to test the robustness of our findings."


Are you looking for more strategies to read about? Check http://quantpedia.com/Screener

Do you want to see performance of trading systems we described? Check http://quantpedia.com/Chart/Performance

Do you want to know more about us? Check http://quantpedia.com/Home/About

Continue reading

Quantpedia Update – 18th September 2016

18.September 2016

One new strategy has been added:

#319 – Combined Stock and CDS Momentum

Three new related research papers have been included into existing strategy reviews. And two additional related research papers have been included into existing free strategy reviews during last 2 weeks.

Continue reading

Carry Trade Returns and Political Risks

13.September 2016

Related to #5 – FX Carry Trade

Author: Kesse

Title: Exchange Rates, Carry Trade Returns and Political Risks

Link: http://papers.ssrn.com/sol3/papers.cfm?abstract_id=2813028

Abstract:

This paper elucidates the channels through which sovereign risk, exchange rates and currency risk premia are related. I show that the channels are different depending on whether a country is classified as emerging or an advanced economy. Generally, for emerging market economies, local sovereign risk factors, namely country-specific political risk and macroeconomic risk do play a significant role in the depreciation of the local currency relative to the U.S. dollar. Whilst there is no convincing evidence that local determinants of sovereign risk cause a depreciation of currencies of advanced economies before the 2007 financial crisis, I do find that political risk does matter for advanced economies in the post-crisis era. For both sets of economies, global factors also play an important role in the relationship between sovereign risk and exchange rates. Secondly, double-sorting 34 currencies into different portfolios based on the level of macro risk and political risk, I provide evidence that local determinants of sovereign risk are priced in the FX markets, i.e. they can forecast currency carry trade excess returns in the cross-section. Local political risk in particular seems to have become an important carry trade risk factor in the post-2007 financial crisis era. This is the first research to explain carry trade excess returns with local sovereign risk factors as against sovereign risk as a whole.

Notable quotations from the academic research paper:

"The measure of country political risk is derived from the political risk rating of the International Country Risk Guide (ICRG). It is forward-looking and reflects political risk as opposed to an aggregate or broad measure of country risk which also incorporates macro-economic factors. While ICRG's rating is mostly subjective assessments of various country experts, there is ample evidence in the literature that it correctly reects the adverse effects of political risk on investment values across countries

The political risk rating is composed of 12 subcomponents namely: government stability, socioeconomic conditions, investment profile, internal conflict, external conflict, corruption, military in politics, religious tensions, ethnic tensions, law and order, democratic accountability and bureaucratic quality. This measure ranges from 0-100 with higher scores reflecting low level of political risk. Following (Bekaert et al., 2014), I construct country political risk as the difference of the log inverse of the ICRG rating for a country and the log inverse of the equivalent rating for the U.S.A, i.e. log(1/pr^f ) – log(1/pr^us).

I find that for emerging markets, an increasing level of political risk generally leads to a depreciation of the currency. A rising level of the other country-specific component of sovereign risk, i.e. macroeconomic risk also generally leads to a depreciation of the local currency. Of the two country-specific risks, political risk seems to have the stronger effect on currency depreciation in terms of magnitude. Whereas I find no such effect of country-specific political risk and macroeconomic risk on exchange rates for developed economies in the pre-2007 financial crisis period, I do find that political risk does matter for advanced economies post-2007 crisis. For both sets of economies, increasing global risk aversion generally leads to a depreciation of the currency under all sub-samples.

Secondly, I investigated whether our local determinants of sovereign risk have the ability to explain currency carry trade excess returns. I do find that they indeed do. Portfolios double-sorted on country-political risk and macroeconomic risk produce excess returns and slopes that increase from low political risk portfolios to high political risk portfolios under all macro risk groups in the post-2007 crisis sub-period. The argument for political risk being priced is less convincing under the pre-2007 crisis sub-sample. Instead, there is a stronger case for macro risk being priced pre-2007 financial crisis whereas the argument for macro risk is weaker post-2007 financial crisis."


Are you looking for more strategies to read about? Check http://quantpedia.com/Screener

Do you want to see performance of trading systems we described? Check http://quantpedia.com/Chart/Performance

Do you want to know more about us? Check http://quantpedia.com/Home/About

Continue reading

Quantopian & Quantpedia Trading Strategy Series: Reversal during Earnings Announcements

9.September 2016

We are really excited that Quantopian & Quantpedia Trading Strategy Series continues with a second article focused on Reversal Effect during Earning Announcements (Strategy #307).

Click on a "View Notebook" button to read a complete analysis:
https://www.quantopian.com/posts/quantpedia-trading-strategy-series-reversal-during-earnings-announcements

Eric C. So of MIT and Sean Wang of UNC in their paper News-Driven Return Reversals: Liquidity Provision Ahead of Earnings Announcements show that abnormal short-term returns reversals take place during the period immediately surrounding earnings announcements. They surmise that this reversal results from market makers' response to a temporary demand imbalance, as they temporarily shift the stock's price to ride out the imbalance.

Quantopian's analysis by Nathan Wolfe confirms initial findings of So & Wang original academic paper. Nathan finds evidence of returns reversal during earnings announcements; while the paper tested using data from 1996 to 2011, Nathan used data from 2007 to 2016. The average reversal among all stocks in his data is 0.449%, compared to a result of 1.448% in the paper. He found that we can reasonably increase the reversal to 0.6% by selecting firms based on a minimum average dollar volume percentile, or based on a minimum market cap.

In order to ensure liquidity, the strategy limits its universe to those stocks in the Q500US which are at or above the 95th percentile of average dollar volume among all equities on the platform. One day before each earnings announcement for each company, the algorithm determines the stock's 5-day returns quintile among all equities. Since reversal is expected, the algorithm goes short on the stock if it's in the highest quintile and long if it's in the lowest quintile. Positions are usually held for one day.

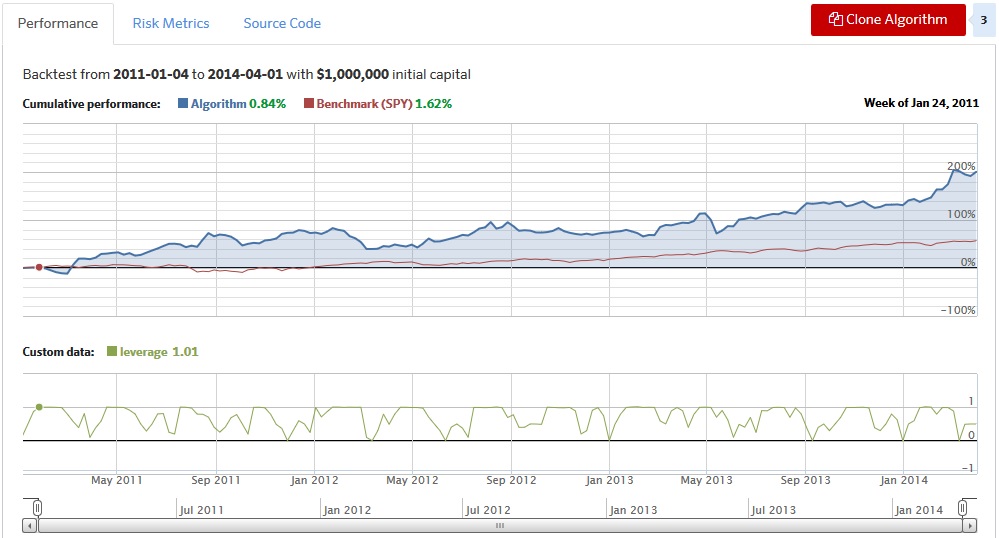
The final Quantopian OOS equity curve looks again really good:

Strategy's performance

Perfect work from Nathan!

You may also check first article in this series if you liked the current one. We are again looking forward to the next one …

Continue reading
Subscription Form

Subscribe for Newsletter

 Be first to know, when we publish new content
logo
The Encyclopedia of Quantitative Trading Strategies

Log in

QuantPedia
Privacy Overview

This website uses cookies so that we can provide you with the best user experience possible. Cookie information is stored in your browser and performs functions such as recognising you when you return to our website and helping our team to understand which sections of the website you find most interesting and useful.