Can We Explain Abudance of Equity Factors Just by Data Mining? Surely Not.

11.April 2019

Academic research has documented several hundreds of factors that explain expected stock returns. Now, question is: Are all this factors product of data mining? Recent paper by Andrew Chen runs a numerical simulation that shows that it is implausible, that abudance of equity factors can be explained solely by p-hacking …

Author: Chen

Title: The Limits of P-Hacking: A Thought Experiment

Link: https://papers.ssrn.com/sol3/papers.cfm?abstract_id=3358905

Abstract:

Suppose that asset pricing factors are just p-hacked noise. How much p-hacking is required to produce the 300 factors documented by academics? I show that, if 10,000 academics generate 1 factor every minute, it takes 15 million years of p-hacking. This absurd conclusion comes from applying the p-hacking theory to published data. To fit the fat right tail of published t-stats, the p-hacking theory requires that the probability of publishing t-stats < 6.0 is infinitesimal. Thus it takes a ridiculous amount of p-hacking to publish a single t-stat. These results show that p-hacking alone cannot explain the factor zoo.

Notable quotations from the academic research paper:

"Academics have documented more than 300 factors that explain expected stock returns. This enormous set of factors begs for an economic explanation, yet there is little consensus on their origin. A p-hacking (a.k.a. data snooping, data-mining) offers a neat and plausible solution. This cynical explanation begins by noting that the cross-sectional literature uses statistical tests that are only valid under the assumptions of classical single hypothesis testing. These assumptions are clearly violated in practice, as each published factor is drawn from multiple unpublished tests. In this well-known explanation, the factor zoo consists of factors that performed well by pure chance.

In this short paper, I follow the p-hacking explanation to its logical conclusion. To rigorously pursue the p-hacking theory, I write down a statistical model in which factors have no explanatory power, but published t-stats are large because the probability of publishing a t-stat ti follows an increasing function p(ti). I estimate p(ti ) by fitting the model to the distribution of published t-stats inHarvey, Liu, and Zhu (2016) and Chen and Zimmermann (2018). The p-hacking story is powerful: The model fits either dataset very well.

p-hacking model

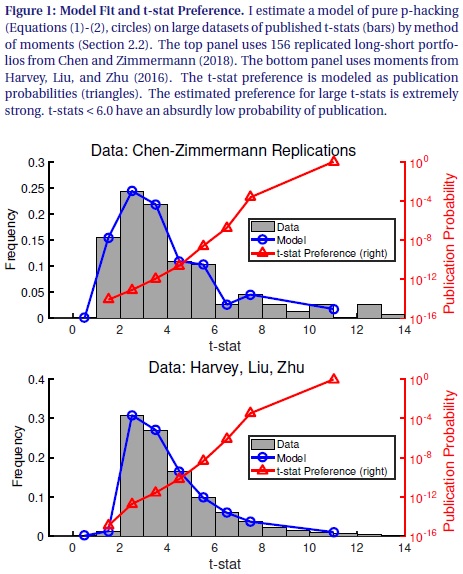
Though p-hacking fits the data, following its logic further leads to absurd conclusions. In particular, the pure p-hacking model predicts that the ratio of unpublished factors to published factors is ridiculously large, at about 100 trillion to 1. To put this number in perspective, suppose that 10,000 economists mine the data for 8 hours per day, 365 days per year. And suppose that each economist finds 1 predictor every minute. Even with this intense p-hacking, it would take 15 million years to find the 316 factors in theHarvey, Liu, and Zhu (2016) dataset.

This thought experiment demonstrates that assigning the entire factor zoo to p-hacking is wrong. Though the p-hacking story appears logical, following its logic rigorously leads to implausible conclusions, disproving the theory by contradiction. Thus, my thought experiment supports the idea that publication bias in the cross-section of stock returns is relatively minor."


Are you looking for more strategies to read about? Check http://quantpedia.com/Screener

Do you want to see performance of trading systems we described? Check http://quantpedia.com/Chart/Performance

Do you want to know more about us? Check http://quantpedia.com/Home/About


Follow us on:

Facebook: https://www.facebook.com/quantpedia/

Twitter: https://twitter.com/quantpedia


Continue reading

Three Insights from Academic Research Related to Momentum Strategy

4.April 2019

What are the main insights?

– momentum is not an anomaly in a risk-based asset pricing framework. Riskier assets tend to be in the loser portfolios after (large) increases in the price of risk. The risk of momentum portfolios usually decreases with the prevailing price of risk, and their risk premiums are approximately negative quadratic functions of the price of risk (and the market premium) theoretically truncated at zero.

– changes to market liquidity adds to the explanation of momentum crashes along with the market rebounds, this relationship is driven by the asymmetric large return sensitivity of short-leg of momentum portfolio to changes in market liquidity that flares the tail risk of momentum strategy in panic states

– momentum returns are highly related to market risk arising from return dispersion (RD) as momentum risk loadings and RD risk loadings are similarly priced in momentum portfolios

1/

Author: Souza

Title: A Critique of Momentum Anomalies

Link: https://papers.ssrn.com/sol3/papers.cfm?abstract_id=3341275

Abstract:

This paper offers theoretical, empirical, and simulated evidence that momentum regularities in asset prices are not anomalies. Within a general, frictionless, rational expectations, risk-based asset pricing framework, riskier assets tend to be in the loser portfolios after (large) increases in the price of risk. Hence, the risk of momentum portfolios usually decreases with the prevailing price of risk, and their risk premiums are approximately negative quadratic functions of the price of risk (and the market premium) theoretically truncated at zero. The best linear (CAPM) function describing this relation unconditionally has exactly the negative slope and positive intercept documented empirically.

2/

Authors: Butt, Virk

Title: Momentum Crashes and Variations to Market Liquidity

Link: https://papers.ssrn.com/sol3/papers.cfm?abstract_id=3314095

Abstract:

We document that the variation in market liquidity is an important determinant of momentum crashes that is independent of other known explanations surfaced on this topic. This relationship is driven by the asymmetric large return sensitivity of short-leg of momentum portfolio to changes in market liquidity that flares the tail risk of momentum strategy in panic states. This identification explains the forecasting ability of known predictors of tail risk of momentum strategy such that the contemporaneous increase in market liquidity predominantly sums up the trademark negative relationship between predictors and future momentum returns. Our results are robust using a different momentum portfolio and alternative measures of market liquidity that make a substantial part of the common source of variation in aggregate liquidity.

3/

Authors: Kolari, Liu

Title: Market Risk and the Momentum Mystery

Link: https://papers.ssrn.com/sol3/papers.cfm?abstract_id=3280559

Abstract:

This paper employs the ZCAPM asset pricing model of Liu, Kolari, and Huang (2018) to show that momentum returns are highly related to market risk arising from return dispersion (RD). Cross-sectional tests show that momentum risk loadings and RD risk loadings are similarly priced in momentum portfolios. Comparative analyses find that zero-investment momentum portfolios and zero-investment return dispersion portfolios earn high returns relative to other risk factors. Further regression tests indicate that zero-investment momentum returns are very significantly related to zero-investment return dispersion returns. We conclude that the momentum mystery is explained by market risk associated with return dispersion for the most part.


Are you looking for more strategies to read about? Check http://quantpedia.com/Screener

Do you want to see performance of trading systems we described? Check http://quantpedia.com/Chart/Performance

Do you want to know more about us? Check http://quantpedia.com/Home/About


Follow us on:

Facebook: https://www.facebook.com/quantpedia/

Twitter: https://twitter.com/quantpedia


Continue reading

Quantpedia Update – 28th March 2019

28.March 2019

Two new strategies have been added:

#423 – Industry Herding and Momentum
#424 – Long-Run Reversal in Commodity Returns

Two new related research papers have been included into existing strategy reviews. And four additional related research papers have been included into existing free strategy reviews during last few weeks.

Continue reading

Three Insights from Academic Research Related to Carry Trade Strategy

27.March 2019

What are the main insights?

– carry trade profitbility depends on the positive order-flow of sophisticated financial customers (hedge funds and asset managers)

– carry trade strategy is profitable, but it is hard to pick correct trading rules ex-ante

– future alpha of a high interest rate currency carry portfolio increases in a trough in a business cycle and in a state of high market uncertainty

1/

Authors: Burnside, Cerrato, Zhang

Title: Foreign Exchange Order Flow as a Risk Factor

Link: https://papers.ssrn.com/sol3/papers.cfm?abstract_id=3275356

Abstract:

This paper proposes a set of novel pricing factors for currency returns that are motivated by microstructure models. In so doing, we bring two strands of the exchange rate literature, namely market-microstructure and risk-based models, closer together. Our novel factors use order flow data to provide direct measures of buying and selling pressure related to carry trading and momentum strategies. We find that they appear to be good proxies for currency crash risk. Additionally, we show that the association between our order-flow factors and currency returns differs according to the customer segment of the foreign exchange market. In particular, it appears that financial customers are risk takers in the market, while non-financial customers serve as liquidity providers.

2/

Authors: Hsu, Taylor, Wang

Title: The Profitability of Carry Trades: Reality or Illusion?

Link: https://papers.ssrn.com/sol3/papers.cfm?abstract_id=3158101

Abstract:

We carry out a large-scale investigation of the profitability of carry trades, using foreign exchange data for 48 countries spanning a period from 1983 to 2016 and employing a stepwise test to counter data-snooping bias. We find that, while we can confirm previous findings that the carry trade is profitable over this long period when a specific carry-trade strategy is selected based on the whole data set, even after controlling for data snooping, when we split the sample into sub-periods, the best carry-trade strategy in one sub-period is generally not profitable in the next sub-period. This finding holds true even when we include learning strategies and stop-loss strategies. Our findings thus highlight the instability of carry trades over long periods and their limitation in the sense that it is hard to predict their performance based on several years of data and therefore to choose a profitable carry-trade strategy ex ante.

3/

Author: Sakemoto

Title: Currency Carry Trades and the Conditional Factor Model

Link: https://papers.ssrn.com/sol3/papers.cfm?abstract_id=3210768

Abstract:

This study employs a conditional factor model in order to investigate the time-varying profitability of currency carry trades. To that end, I estimate conditional alphas and betas on the popular dollar and carry factors through the use of a nonparametric approach. The empirical results illustrate that the alphas and betas vary over time. Furthermore, I find that the alpha of a high interest rate currency portfolio increases in a trough in a business cycle and in a state of high market uncertainty. However, the beta on the dollar factor decreases in these market conditions, suggesting that investors reduce the foreign currency risk exposure.


Are you looking for more strategies to read about? Check http://quantpedia.com/Screener

Do you want to see performance of trading systems we described? Check http://quantpedia.com/Chart/Performance

Do you want to know more about us? Check http://quantpedia.com/Home/About


Follow us on:

Facebook: https://www.facebook.com/quantpedia/

Twitter: https://twitter.com/quantpedia


Continue reading

A New Look on Shiller’s CAPE Ratio

20.March 2019

Robert Shiller and Farouk Jivraj discuss a validity of methodology for Campbell &Shiller's CAPE ratio calculation, share their opinion on future returns of US equities and give few novel ideas for CAPE's usage for asset allocation and country and sector picking:

Authors: Jivraj, Shiller

Title: The Many Colours of CAPE

Link: https://papers.ssrn.com/sol3/papers.cfm?abstract_id=3258404

Abstract:

Campbell & Shiller's [1988] Cyclically-Adjusted Price to Earnings ratio (CAPE) has both its advocates and critics. Currently, the debate is on the validity of the high CAPE ratio for US stock markets in forecasting lower future returns, with CAPE currently at 31.21. We investigate the efficacy and validity of CAPE from several different perspectives. First, we run multiple-horizon predictability regressions for CAPE versus its peers and find that CAPE consistently displays economic and statistical significance far better than any of its peers. Second, we explore alternative constructions of CAPE based on other proxies for earnings motivated by the work of findings by Siegel [2016] using NIPA profits. We find that original CAPE is still best when comprehensively and fairly reviewing the other proxies, even for NIPA profits. Third, we assess how to practically use CAPE in both an asset allocation and relative valuation setting. We demonstrate a novel use of CAPE for asset allocation programmes as well as discuss relative valuation exercises for country, sector and single stock rotation.

Notable quotations from the academic research paper:

"Campbell & Shiller's Cyclically-Adjusted Price to Earnings ratio (CAPE), is a well known to characterize the strong relationship between an inflation adjusted earnings-to-price ratio and subsequent longterm returns. As a result, it has now become an often cited measure of equity market valuation. With such a status, the current value of CAPE, 31.12 (as in 10/2017), is causing concern amongst investors and spurring debate among academics – it is currently in 96th percentile compared to its own history since 1881. Thus, the question of whether the US stock market is overpriced, is being hotly contested and CAPE is at the centre of this debate.

CAPE

Table 2 shows, that historically, at such a starting level, by deciles, we're in the worst possible bucket where on average subsequent annualised real returns over next ten years were a mere 0.9%, with the best case being a not bad 5.8% but the worst case being a very bad -6.1%

Table of CAPE ratio

Critics mainly focus on ways to claim that the observed CAPE ratios are too high and not valid for reasons such as statistical significance and/or changing accounting standard over the years.

Siegel (2016) proposed an alternative of National Income and Product Account (NIPA) corporate profits from the Bureau of Economic Analysis to be used in context of correcting the bias in CAPE. We therefore look closely at these claims but also compliment this alternative CAPE constrution using NIPA profits, with version using operating earnings, cash flow, sales and book value as other earnings related proxies.

Figures 4 to 6 report R^2 and averaged t-statistics for our predictability regressions. They should be reviews in tandem. Figure 4 demonstrates the ability of CAPE in forecasting returns better then E/P, NIPA/P and D/P at shorter horizons. E/P and NIPA/P eventually catch up and significantly so, as confirmed by their t-statistics in Figure 6. However it is clear, that CAPE is able to consistently predict subsequent returns significantly so from a 1Y horizon onwards.

Figure 6 perfectly highlights the small sample bias in long horizon regressions when comparing the R^2s of B/P, CF/P and S/P with those in figure 5. Whilst the R^2s may appear higher, especially at the longest horizons, Figure 6 shows that past a 5Y horizon, S/P is the only variable that is consistently significant.


R^2 of CAPE

R^2 of other ratios

t-stat of CAPE ratios

"


Are you looking for more strategies to read about? Check http://quantpedia.com/Screener

Do you want to see performance of trading systems we described? Check http://quantpedia.com/Chart/Performance

Do you want to know more about us? Check http://quantpedia.com/Home/About


Follow us on:

Facebook: https://www.facebook.com/quantpedia/

Twitter: https://twitter.com/quantpedia


Continue reading

Quantpedia Update – 14th March 2019

14.March 2019

Two new strategies have been added:

#421 – Earnings Response Elasticity
#422 – The Value Uncertainty Premium

Three new related research papers have been included into existing strategy reviews. And three additional related research papers have been included into existing free strategy reviews during last few weeks.

Continue reading
Subscription Form

Subscribe for Newsletter

 Be first to know, when we publish new content
logo
The Encyclopedia of Quantitative Trading Strategies

Log in