How to Analyze Individual Equity Curves
Introduction
One of the advantages of the Quantpedia Pro platform and its Portfolio Analysis toolkit is the ability to analyze not only multi-asset and multi-strategy portfolios but also individual equity curves. Users can upload virtually any return series or analyze assets already present in the database. The same analytical tools used for portfolio construction can therefore also be applied to single assets.
Given the current macro-driven environment, commodity markets—particularly crude oil—offer a relevant case study. The United States Oil Fund (USO) ETF serves as a practical proxy for oil price dynamics. By analyzing its equity curve through Quantpedia Pro, we can explore whether persistent patterns, behavioral effects, or structural inefficiencies exist and whether they can be transformed into systematic trading strategies.
Seasonality Analysis
Seasonality represents one of the simplest yet often persistent market anomalies. The Seasonality Report evaluates recurring calendar effects by analyzing average performance across different time segments, such as months or specific event windows.


Seasonal patterns are well documented across financial markets. For example, the Quantpedia study The End-of-Month Effect in Value, Growth and Real Estate Equity Spreads shows that returns tend to cluster around month boundaries, particularly in equity spreads such as value vs. growth or real estate sectors. This effect is often attributed to institutional rebalancing, capital flows, and behavioral biases related to reporting periods.
To further illustrate seasonal effects additional case studies can be constructed using Portfolio Analysis. For example the turn of the month effect can be analyzed using a long IYR and short SPY portfolio where significantly positive returns tend to concentrate just before month boundaries.


Similarly, another study, Pre-Holiday Effect in Commodities, highlights that markets tend to exhibit a positive bias before holidays. This phenomenon is commonly linked to reduced liquidity, optimistic sentiment, and position adjustments ahead of market closures.
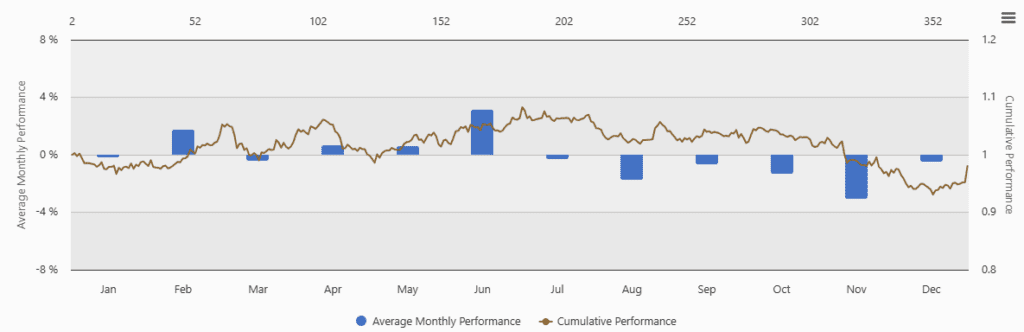
Once again, using gasoline ETF UGA, we can observe this Pre-Holiday effect in the data using the Seasonality Analysis report.


Together, these findings suggest that even simple calendar-based signals can capture persistent behavioral inefficiencies and may serve as a useful building block for systematic trading strategies.
Technical Analysis Report
Another way to analyze individual equity curves is through automated technical pattern detection. The Technical Analysis Report identifies classical price structures such as support and resistance levels, trend-lines, and patterns like double tops or bottoms based on historical price behavior.

The methodology is based on detecting local highs and lows within a defined window and constructing price structures that historically led to specific market reactions. These structures allow for a systematic evaluation of technical signals and transform discretionary technical analysis into rule-based strategies. This approach is further detailed in the Quantpedia study Technical Analysis Report Methodology: Double Bottom Country Trading Strategy, which demonstrates how classical chart patterns such as double bottoms can be formalized into objective, testable trading rules.
Trading Edge Analysis
The Trading Edge Analysis Report is designed to systematically identify short-term behavioral patterns following specific market events. As described in the Quantpedia methodology, the framework evaluates how assets behave after predefined conditions such as extreme returns, volatility shocks, or momentum bursts over short holding periods. The approach is fully rule-based and scans a wide range of signals to detect statistically significant patterns. This methodology is further detailed in the Quantpedia study Automated Trading Edge Analysis, which demonstrates how event-driven signals can be systematically tested and transformed into short-term trading strategies.
Quantpedia research updates further show that many of these short term effects persist across different markets. A common finding is that extreme price movements often lead to temporary inefficiencies. In particular large negative returns tend to be followed by short term rebounds while strong positive moves may lead to temporary pullbacks. These patterns form the foundation for systematic short term trading strategies.


The example above demonstrates how volatility-based signals can be translated into practical strategies. The results indicate that high-volatility regimes tend to produce stronger and more reliable trading signals, while low-volatility environments offer weaker or less consistent opportunities. This highlights the importance of focusing on extreme market conditions when searching for short-term trading edges.
Over time the report has been enhanced with additional event driven signals such as behavior after consecutive up and down days, reactions around 12 month highs and lows and new volatility based regime filters. The updates also introduce extended parametrization of signals together with additional charts and performance tables, allowing for a more detailed evaluation of short term market behavior. These improvements increase the robustness of the analysis and enable a more systematic identification of recurring effects such as mean reversion after extreme moves and short term momentum continuation and reversal, providing a more reliable foundation for constructing rule based trading strategies.
Trend and Reversal Analysis
While Trading Edge Analysis focuses on short-term behavior, the Trend and Reversal Analysis Report explores medium-term market tendencies. It evaluates how assets behave over longer holding periods, typically ranging from one month to one year, in order to identify momentum and reversal effects.
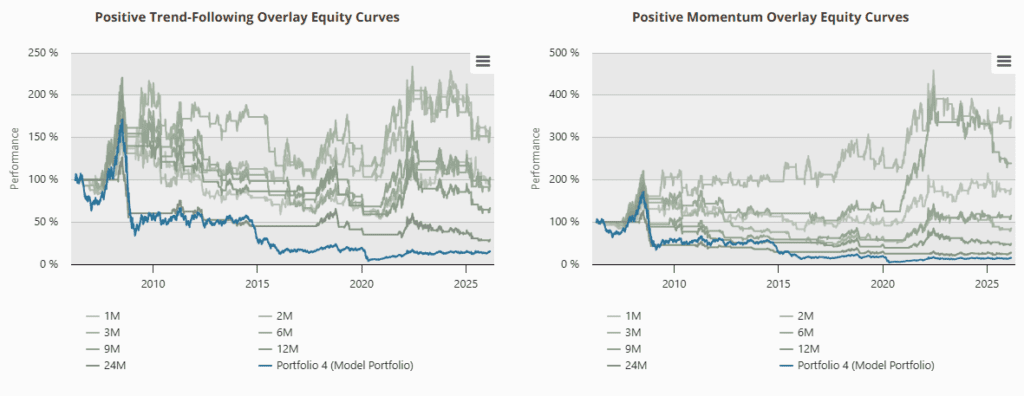
The results show that momentum-based overlays significantly outperform the baseline portfolio, particularly over intermediate lookback periods such as 2 to 6 months. This suggests that positive trends in the USO ETF tend to persist, supporting the presence of medium-term momentum effects. In contrast, pure trend-following rules appear weaker, indicating that momentum signals provide more robust performance improvements in this case.

The table further confirms that momentum strategies achieve higher returns and better risk-adjusted performance compared to the benchmark. This highlights the importance of incorporating momentum-based filters when constructing systematic strategies on commodity-related assets.
Conclusion
Analyzing individual equity curves provides valuable insight into market behavior and potential trading strategies. Quantpedia’s analytical reports allow researchers to systematically explore seasonality effects, technical patterns, short-term behavioral edges, and medium-term trends.
Together, these tools enable the transformation of raw market data into structured, rule-based strategies that can be tested, validated, and integrated into diversified portfolios.
Author: David Mesicek, Junior Quant Analyst, Quantpedia
Are you looking for more strategies to read about? Sign up for our newsletter or visit our Blog or Screener.
Do you want to learn more about Quantpedia Premium service? Check how Quantpedia works, our mission and Premium pricing offer.
Do you want to learn more about Quantpedia Pro service? Check its description, watch videos, review reporting capabilities and visit our pricing offer.
Do you want algorithmic access to the full Quantpedia database via the API? Subscribe to Quantpedia Pro, ask for an API key, and explore the in/out-of-sample statistics, source academic papers, and code snippets — ideal for quantitative research, systematic trading workflows, and AI model training.
Are you looking for historical data or backtesting platforms? Check our list of Algo Trading Discounts.
Or follow us on:
Facebook Group, Facebook Page, Telegram, Twitter, Linkedin, Medium or Youtube
Share onLinkedInTwitterFacebookRefer to a friend


