Best Performing Value Strategies – Part 2
Value trading strategies have come back into spotlight in recent years. After lackluster performance in years 2018, 2019, 2020, Value has staged a strong comeback in 2021 and also in 2022. With a long history of systematic equity Value strategies, many different variants of the strategy have emerged. In the first part of this article, we picked 16 US equity value trading strategies out of Quantpedia’s database of 750+ quantitative strategies and zoomed closely at them.
We focused the first part of this article more on tendencies and trends among these US Equity Value strategies. We found out, thanks to Quantpedia Pro’s screener abilities, several interesting insights, for example among others also:
- The 16 Value strategies are generally NOT much correlated to equities
- Strategies are almost totally uncorrelated to each other as well
- Strategies differ substantially in performance, risk, trading frequency and strategy details
- Not all Value strategies suffered during the problematic 2018-2020 period
- Best strategies do fluctuate. One needs to adapt constantly
- Some of the past years’ losers became recent winners
Today we will talk solely about specific top-performing equity value strategies. More specifically, about numbers #7 to #1 from Quantpedia’s ranking. We will also take a look at combining all the value strategies together into a diversified portfolio of value strategies. So, let’s go straight to the thing!
Top Performing Value Strategies
Transaction costs and bid-ask spreads are included in all of the charts and statistics below.
#7 Catching “Falling Knife” Stocks
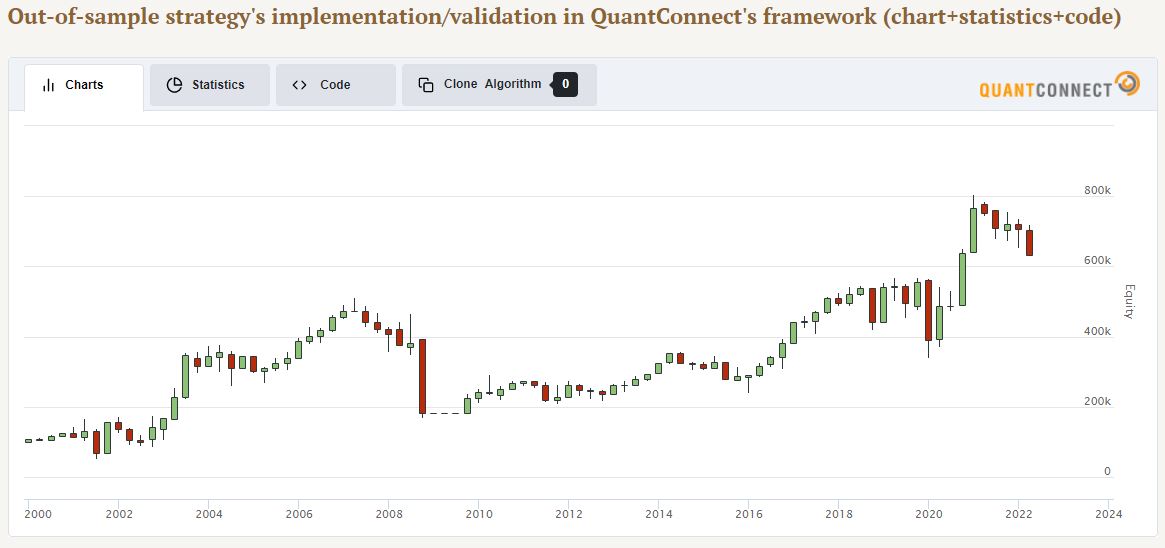
YTD performance: -12.3%
3-year performance: +4.1% p.a.
5-year Sharpe ratio: 0.3
# Instruments: Russell 1000 stocks with exclusions
Frequency: Monthly
Max Drawdown: -68.9%
Strategy idea: long stocks with negative relative performance and low debt/equity ratio
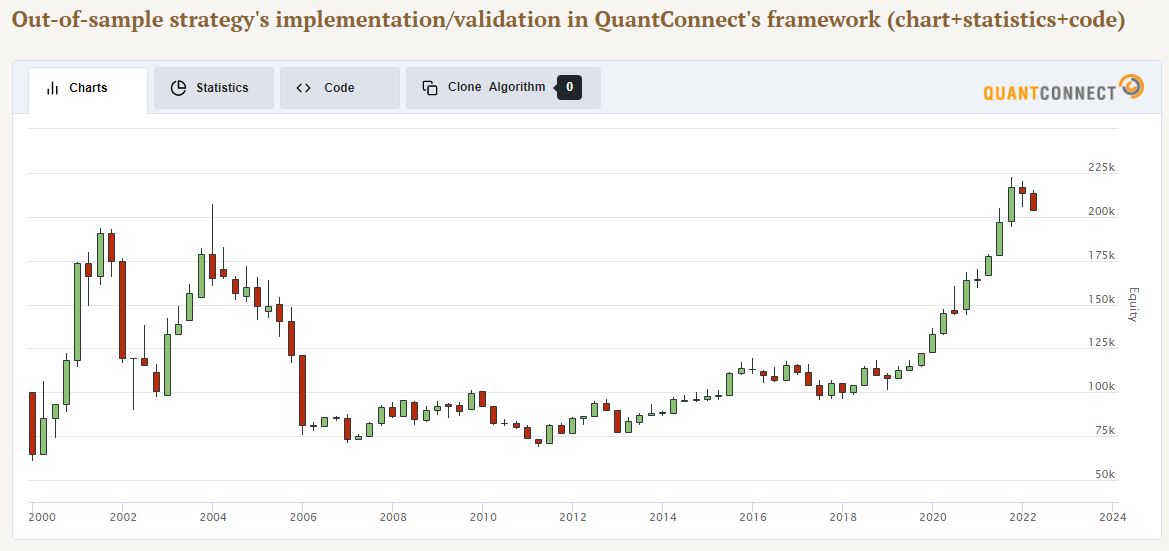
As the name of the strategy, Catching “Falling Knife” Stocks, suggests, this strategy looks at a slightly different approach to Value. In other words, the Catching Falling Knife strategy combines one of the measures of Value, debt-to-equity ratio, together with price action.
The strategy goes long on stocks which suffered large losses against the benchmark but still do have solid debt-to-equity ratio. As we may observe from the chart above (and charts below), this trading strategy behaves noticeably differently compared to already described strategies from part 1 of our article or the strategies that will follow today. This is one of the features of systematic equity Value strategies – there are various definitions of Value and a even a small change in a signal can result in considerable variance of outcomes.
Despite being volatile, Catching “Falling Knife” Stocks strategy managed to end in a positive territory during the past 3 years, and also over the last 5 years.
#6 Productivity of Cash Effect in the Stock Market
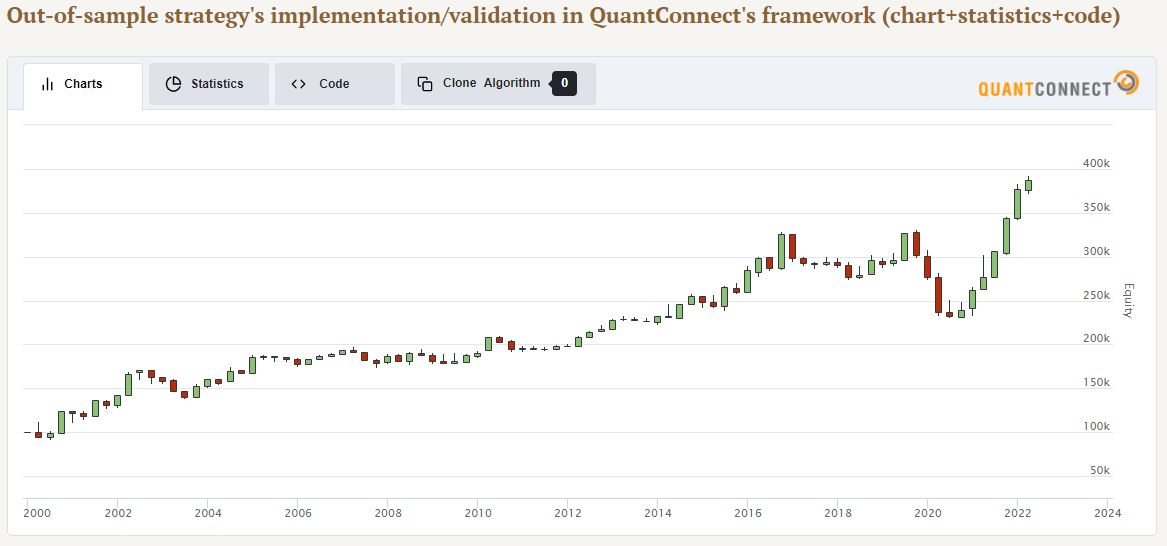
YTD performance: +12.4%
3-year performance: +9.7% p.a.
5-year Sharpe ratio: 0.47
# Instruments: 1000+ NYSE, AMEX and NASDAQ stocks
Frequency: Yearly
Max Drawdown: -30.4%
Strategy idea: long low productivity of cash stocks, short the opposite
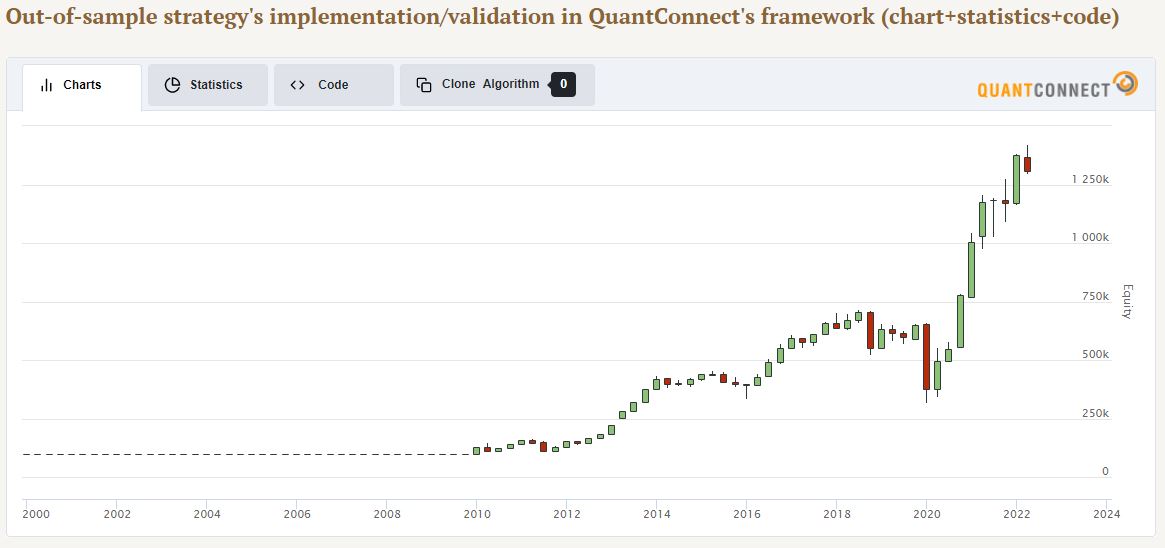
Yet another definition of US equity Value seems to be thriving since 2021, although it struggled in the years before. Productivity of cash can be described as a measure of a company’s valuation compared to its cashflow. If company’s productivity of cash is low, this may indicate a Value opportunity. Also, investors reward firms that have high cash productivity; the high productivity firms sell at a premium, and this also decreases future stocks’ performance.
Quantpedia’s Productivity of Cash Effect in the US Stock Market trading strategy has a solid track record of almost 20 years of stable and positive performance. While this Value investment strategy struggled in 2020, it has managed to more than just recover all of its Covid-19 losses recently.
#5 Net Payout Yield Effect
YTD performance: -8.9%
3-year performance: +13% p.a.
5-year Sharpe ratio: 0.63
# Instruments: 1000+ NYSE, AMEX and NASDAQ stocks
Frequency: Yearly
Max Drawdown: -54.7%
Strategy idea: long stocks with the highest net payout yield
In the past, the dividend yield was considered a strong predictor for equity returns. For example, The Gordon Growth Model used to determine the “true” value of a stock based on a future series of dividends that grow at a constant rate discounted to the present time. Net payout yield as a signal builds on top of the simple dividend yield strategies. Statistically and economically significant predictability is found at both short and long horizons when total payout yield is used instead of a dividend yield.
Net Payout Yield effect is a long only Value strategy that aims at beating the market. More specifically, the net payout yield is defined as the ratio of dividends plus repurchases minus common share issuances to market capitalization. The strategy uses the cash flow-based measure of repurchases.
When implemented as a long-only version, recent performance of the strategy closely tracks the performance of US equity market benchmark, however, with noticeable periods of outperformance or underperformance. This out( or under)-performance is naturally based on the profitability of the Net Payout Yield factor itself. Quantpedia’s Net Payout Yield effect made it to the top 5 Value strategies based on past 3-year performance.
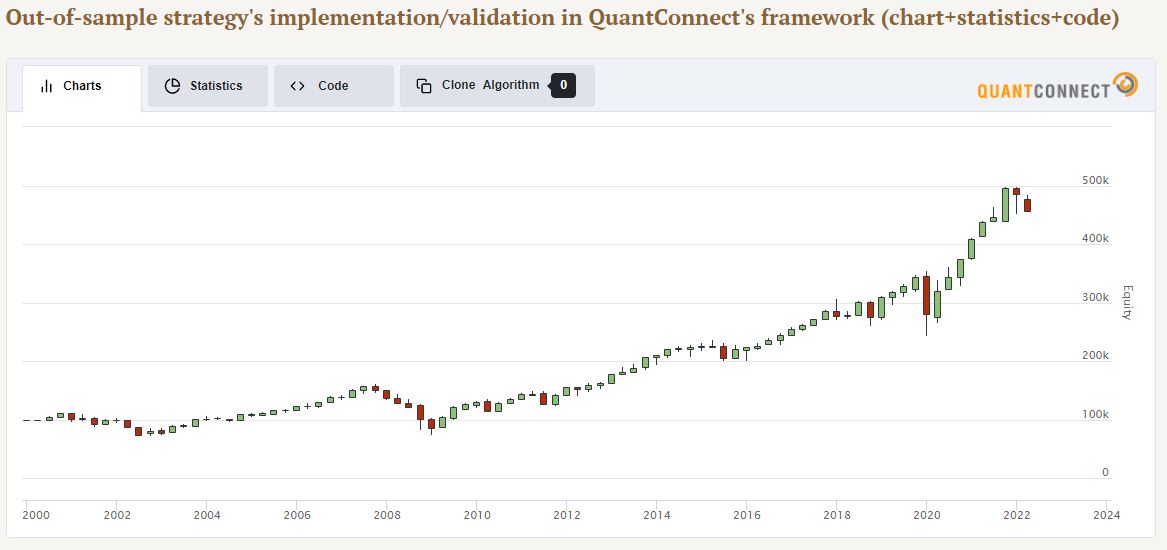
#4 Profitability Factor Combined with Value Factor
YTD performance: +10.5%
3-year performance: +17.1% p.a.
5-year Sharpe ratio: 0.68
# Instruments: 500 non-financial large caps
Frequency: Yearly
Max Drawdown: -37.8%
Strategy idea: long high profitability, low valued stocks, short the opposite
It is extremely difficult to find a well-performing strategy or a decent trading edge in the universe of large-cap stocks, which is extremely efficient. A strategy able to exploit pricing inefficiencies within these highly liquid stocks is thus very valuable. One usually needs to think out of the box and look at (in our case Value) strategies in a different way.
One of these different ways or approaches to quantitative Value strategies may be to combine them with a different type of strategies which, in tandem, may achieve superior performance compared to a single Value strategy alone. One needs to beware overfitting though, because with each added factor or combined strategy the complexity level rises. One of the fundamental factors closely related to Value is the Profitability factor. And that’s exactly the factor which seems to make a good combination with Value.
Profitability of the company can be defined in various ways and one of such ways is described in Quantpedia’s Profitability Factor Combined with Value Factor Strategy. This systematic equity Value strategy has a spectacular 3-year performance run, and despite general markets being in a red territory year-to-date, this Value strategy has managed to remain significantly profitable.
#3 Relative Value Factor in US

YTD performance: +23%
3-year performance: +19.9% p.a.
5-year Sharpe ratio: 0.51
# Instruments: 1000+ NYSE, AMEX and NASDAQ stocks with exclusions
Frequency: Monthly
Max Drawdown: -51.6%
Strategy idea: long low industry adjusted relative-value stocks, short the opposite
The Relative Value factor strategy takes a different approach at Value. The strategy introduces the factor model that identifies misvalued companies via a cross-sectional contemporaneous regression of the company’s relative value on industry classification and the valuation factors. Although being a bit more complex, it elegantly deals with some of the most common problems associated for example with the DCF valuation model. Full description of the strategy is available for all Quantpedia Premium subscribers.
One of the main advantages of this equity Value strategy is that it’s pretty unique and completely uncorrelated to all other value trading strategies. This adds a huge diversification benefit to any factor portfolio. Low correlation to traditional Value strategies proved to be working also during problematic years of 2018 to 2020, where the strategy, contrary to other Value strategies, didn’t lose any capital.
#2 Impact of intangible assets on B/M
YTD performance: -5.6%
3-year performance: +22.1% p.a.
5-year Sharpe ratio: 0.86
# Instruments: 1000+ NYSE, AMEX and NASDAQ stocks
Frequency: Yearly
Max Drawdown: -66.9%
Strategy idea: long high intangible-adjusted book-to-market stocks, short the opposite
As we already mentioned in Part 1 of our article, intangible assets are starting to play a more and more predominant role when it comes to company valuation. Thus, intangibles cannot be ignored also in the context of systematic equity Value trading strategies. We’ve covered one Value strategy modification based solely on intangibles as a strategy number #8 in our ranking. Quantpedia’s Impact of intangible assets on B/M strategy, however, doesn’t look at intangibles in isolation, it rather analyzes both of the metrics in conjunction. And this seems to be a profitable investment idea.
The strategy incorporates variables like growth of goodwill and unrecorded intangible assets such as technology, innovative business models, and brand names. It analyzes the so-called capitalizing unrecorded knowledge capital (Kcap) and organization capital (Ocap), with relation to aforementioned company’s goodwill.
Although quite volatile in the 2000s, the strategy seems to be thriving in recent years as it also made it to number #2 of our List of Best Performing equity Value strategies over the past 3 years. Moreover, this trading strategy isn’t only well performing, but also almost totally uncorrelated to all other Value strategies under the scope of our analysis.
#1 Long-Term PB Ratio Effect in Stocks Combined with Momentum
YTD performance: +10.9%
3-year performance: +26.7% p.a.
5-year Sharpe ratio: 0.67
# Instruments: 1000+ NYSE, AMEX and NASDAQ stocks with exclusions
Frequency: Monthly
Max Drawdown: -55.7%
Strategy idea: long high book-to-market and high momentum stocks
And the winner is… traditional Value combined with Momentum! We’ve already argued earlier in this article that combining different strategies (or blending them to take advantage of both of their trading edges) may be profitable. If done carefully and with caution not to overfit the strategy.
Academic research also shows that the combination of value stocks with a momentum filter is particularly fruitful and such strategy has significantly more favorable risk/return characteristics compared to basic value or momentum strategies. And the real life performance only confirms this. Although Quantpedia’s combined Long-Term PB Ratio Effect in Stocks Combined with Momentum strategy suffered during 2018-2020 a bit too, it has more than doubled the capital since then.
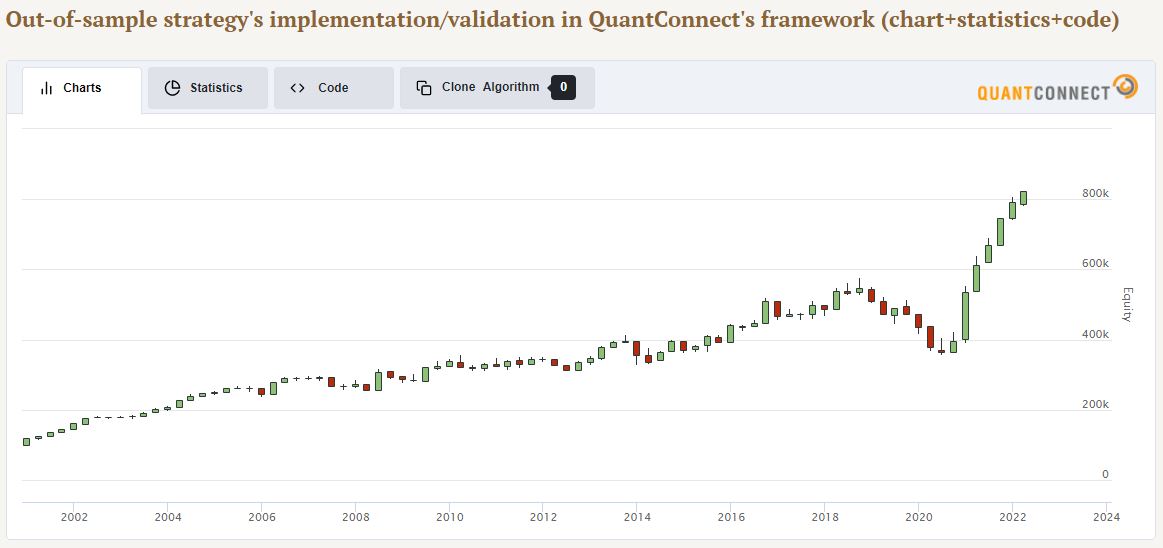
Portfolio of Top 10 US Equity Value Strategies
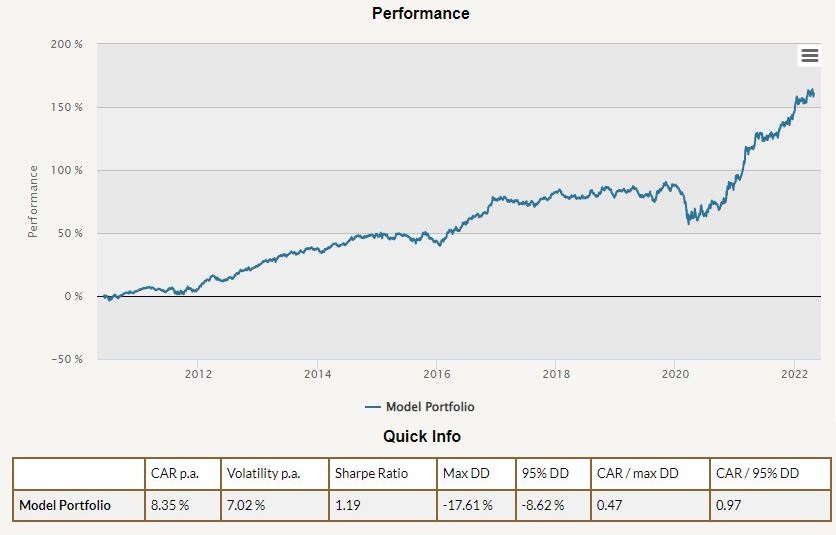
Some say that the whole is greater than the sum of its parts. It especially is, when it comes to trading strategies and their diversification. Correlation may sometimes be a positive miracle. And it didn’t harm when it comes to combining Value strategies either.
Below we present the chart and statistics for an equal weighed portfolio of Top 10 US Equity Value strategies – all presented in this article. We may observe quite appealing return-to-risk statistics. Indeed, it makes sense to diversify even strategies of the same type to achieve superior risk-adjusted performance. Value is no different.
Conclusion
In the first part of our article we quickly extracted 16 US Equity Value strategies out of Quantpedia’s database of 750+strategies, thanks to Quantpedia’s Screener functionality. Then we analyzed various properties of these Value strategies, including their risk and return. Additionally, Quantpedia Pro empowers you to conduct 30 different types of analyses on all these strategies in the matter of minutes.
We then continued by filtering out the 10 best performing US equity Value strategies over the past 3 years. We presented the logic behind each of the strategy and their recent and also long term risk and return. Part 1 of our article analyzed number #10, #9 and #8 of the ranking.
In the second part of our equity Value article, we continued with #7, #6, etc., all the way to #1 best performing equity value strategy. Finally we combined all the analyzed Value strategies together in an equal weighed portfolio.
Are you looking for more strategies to read about? Sign up for our newsletter or visit our Blog or Screener.
Do you want to learn more about Quantpedia Premium service? Check how Quantpedia works, our mission and Premium pricing offer.
Do you want to learn more about Quantpedia Pro service? Check its description, watch videos, review reporting capabilities and visit our pricing offer.
Do you want algorithmic access to the full Quantpedia database via the API? Subscribe to Quantpedia Pro, ask for an API key, and explore the in/out-of-sample statistics, source academic papers, and code snippets — ideal for quantitative research, systematic trading workflows, and AI model training.
Are you looking for historical data or backtesting platforms? Check our list of Algo Trading Discounts.
Or follow us on:
Facebook Group, Facebook Page, Telegram, Twitter, Linkedin, Medium or Youtube
Share onLinkedInTwitterFacebookRefer to a friend


