Active Dual Momentum GTAA Strategy
Our study explores a weekly-rebalanced dual-momentum-based Global Tactical Asset Allocation (GTAA) strategy applied to a diversified set of ETFs. The strategy selects assets based on relative momentum and applies an absolute momentum filter to avoid declining investments. Ultimately, a single combined strategy was created by merging two sub-strategies, incorporating both shorter- and longer-term momentum signals. Backtesting over an extended period demonstrates that this approach delivers attractive risk-adjusted returns, achieving attractive Sharpe and Calmar ratios, while maintaining lower drawdowns compared to a simple equally weighted benchmark.
Global Tactical Asset Allocation (GTAA) strategies (for example see our Pragmatic Asset Allocation, PAA), represent a dynamic approach to investing across multiple asset classes. Unlike traditional passive investing, which aims to replicate market performance, GTAA seeks to optimize the risk–return profile by adjusting allocations among equities, bonds, commodities, and cash based on prevailing market conditions. A well-known example is Meb Faber’s 2007 strategy, which uses simple trend-following rules and moving averages to select assets with the most favorable expected performance.
The goal of GTAA strategies is not necessarily to “beat” the stock market, but rather to achieve more stable, risk-adjusted returns compared to individual asset classes or traditional benchmarks. In PAA models, asset weights are optimized with respect to risk factors and correlations, minimizing portfolio volatility while maximizing expected return for a given level of risk.
Initially, our Pragmatic Asset Allocation strategy focused on a “conservative” slow moving optimization, seeking allocations that adhered to predefined risk limits. Our current objective, however, allows for higher activity – our aim is to construct more active strategy that dynamically responds to market signals and selects assets not only based on risk, but also on potential return, thereby extending beyond traditional PAA approach. At the same time, we do not want to develop a highly active, daily rebalanced tactical asset allocation strategy. The following article describes how we addressed the dual nature of this task: becoming more active on one hand, while avoiding excessive turnover on the other.
Methodology
In this work, we decided to adopt a dual momentum approach, as described by Antonacci. The principle is straightforward: we examine momentum over a selected period and choose a predetermined number of assets with the highest momentum from the pool. However, even assets that rank at the top can still have negative momentum.
To address this, we implement an additional selection criterion: we ultimately select only those assets whose momentum is positive. This absolute momentum filter helps avoid holding assets that are declining in value, providing a safeguard during market downturns when even the “best” performers from the pool could be losing money. For example, during a market crisis, we might select the top three performers from the pool, but still, two out of three could experience negative returns due to the broader global downturn. To address this, we implement an absolute momentum trigger, which helps to avoid holding assets that are declining in value, providing a safeguard against broad market reversals.
This approach is often applied using moving averages, but we opted for a simplified approach to keep the strategy dependent on as few parameters as possible. We use the rate of change (RoC) to calculate momentum, which reduces complexity and allows for a more transparent implementation.
As a result, our strategy depends primarily on two key parameters: the number of assets selected based on momentum and the length of the lookback window for the momentum calculation. In practice, a third implicit parameter exists—the composition of the investment universe itself, as there is a wide range of potential assets to choose from. It is important to recognize a hidden parameter in this approach—the selection of the investment universe itself. Many GTAA strategies do not explicitly address this, but it can introduce a significant bias depending on which assets are included. For example, including Bitcoin in 2015 would have had a large impact on performance, illustrating how universe selection can materially influence results.
For our strategy, the potential investment universe consists of SHY, IEF, UUP, GLD, USO, SPY, EFA, QQQ, and EEM ETFs. We sourced data from EODHD.com – the sponsor of our blog. EODHD offers seamless access to +30 years of historical prices and fundamental data for stocks, ETFs, forex, and cryptocurrencies across 60+ exchanges, available via API or no-code add-ons for Excel and Google Sheets. As a special offer, our blog readers can enjoy an exclusive 30% discount on premium EODHD plans.
We use weekly data for our strategy, which strikes a balance between trading too infrequently (e.g., monthly) and trading too often (e.g., daily). Weekly intervals are frequent enough to respond to market changes in a timely manner, yet not so frequent that they would lead to excessive trading or higher transaction costs. This approach allows the strategy to remain responsive while maintaining practical implementability. We employ weekly rebalancing at Wednesday’s close, the same methodology as in our previous dual momentum article about Gold and Bitcoin. Wednesday minimizes holiday-related market closure artifacts, as mid-week holidays are statistically less frequent than Monday or Friday observances, ensuring consistent execution across the backtest period. The data covers the period from February 21, 2007, to March 25, 2026.
Basic performance characteristics in each strategy characteristics table are presented as follows: the notation perf represents the annual return of the strategy, st dev stands for the annual standard deviation, max dd is the maximum drawdown, adjusted Sharpe r is calculated as the ratio of perf to st dev and adjusted Calmar r as the ratio of perf to max dd. For better visualization, the performance graph is displayed on a logarithmic scale with base 2.
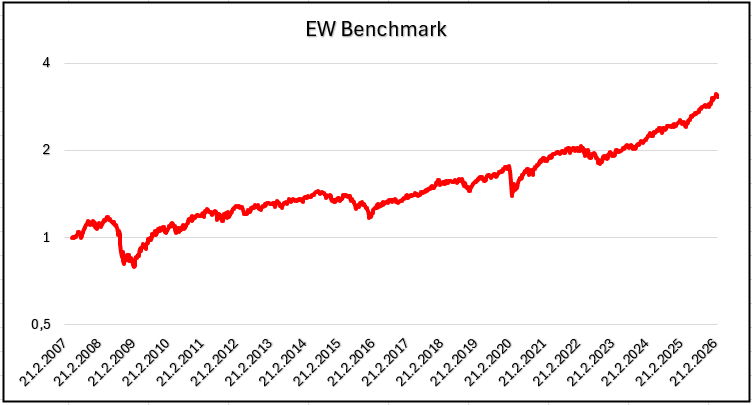
As a benchmark for our GTAA strategy, we use a classic equally weighted (EW) average approach of all 9 ETFs in the investment universe.

Analysis of Momentum Lookback Periods
We first investigated the robustness of the dual momentum strategy. We began by fixing the number of top-selected assets to three, representing one-third of the portfolio. For the momentum lookback periods, we initially considered shorter intervals, starting with 1-week momentum, then 2-week, up to 12-week periods. Subsequently, we examined longer lookback windows ranging from 15, 20, 25, … up to 50 weeks.
For each lookback period, we calculated the momentum of each ETF on a weekly basis and selected the top three performers. We then checked whether their RoC was positive or negative. If positive, we invested in the selected ETF for the following week with a weight of one-third, if negative, the corresponding portion of the portfolio was effectively invested in nothing (0% cash rate i.e., the weight remained formally one-third, but it did not contribute to exposure).
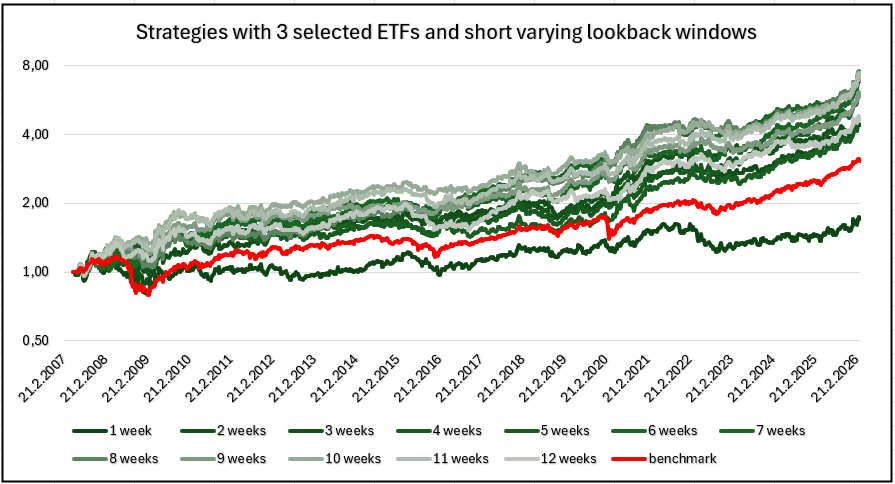
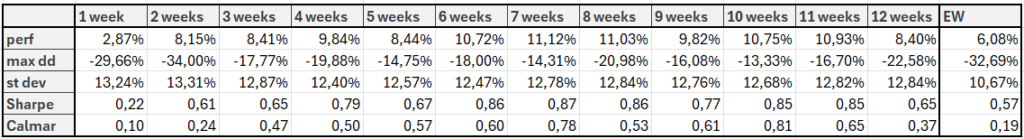


We can observe that every approach, except for the 1-week momentum, outperforms the benchmark, which is evident not only from the graph but especially from the performance metrics presented in the tables. Although the volatility of our approach is slightly higher than that of the benchmark, its performance is sufficiently higher that the Sharpe ratio is significantly improved, as same as the Calmar ratio, which is consistent with the smaller drawdowns observed.
We consider the 1-week momentum performs poorly because trends typically develop over longer periods. Very short-term momentum captures only fleeting price movements, making it less reliable for selecting assets that will continue to outperform in the following weeks. Overall, aside from the 1-week momentum case, the approach proves to be robust across different lookback periods.
Analysis of the Number of Selected ETFs
We then decided to fix the lookback period at 25 weeks, which corresponds roughly to half a year and is considered a standard duration for momentum strategies. For this period, we tested the robustness of the strategy with varying numbers of selected ETFs, from 1 to 9.
Each week, we calculated the 25-week momentum for every ETF, selected the top-performing assets according to the chosen number, and checked whether their RoC was positive. For those with positive RoC, we invested in the following week with a weight of 1 divided by the number of selected ETFs. For assets with negative RoC, the corresponding portion of the portfolio was effectively invested in nothing (0% cash), but still assigned a weight of 1 divided by the number of selected ETFs.

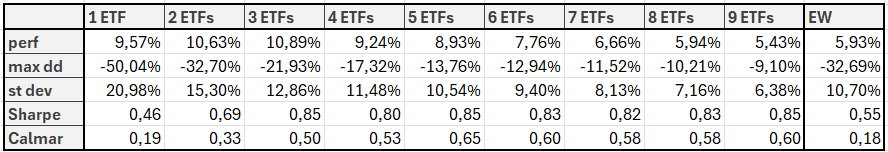
In this case, selecting only one ETF results in very high volatility, while a large number of ETFs tends to perform very similarly to the benchmark, even though the strategies still achieve better risk-adjusted ratios. Overall, strategies selecting 3 to 6 ETFs appear to be the optimal choice. They exhibit Sharpe ratios comparable to those of strategies with a larger number of assets, but achieve better overall performance.
Final Strategy
Ultimately, we chose the average approach for the final strategy. Specifically, we combined two sub-strategies: selecting 3 ETFs based on their 10-week momentum and 3 ETFs based on their 25-week momentum, with each sub-strategy assigned a weight of 50%, again rebalanced weekly. This choice was made based on the results to incorporate both shorter- and longer-term momentum signals, thereby balancing responsiveness with stability in the portfolio. Three ETFs were chosen because this number proved to be robust and effective in backtests. Selecting too few ETFs increases volatility, while selecting too many would make the portfolio behave like the benchmark and dilute the benefits of active selection.
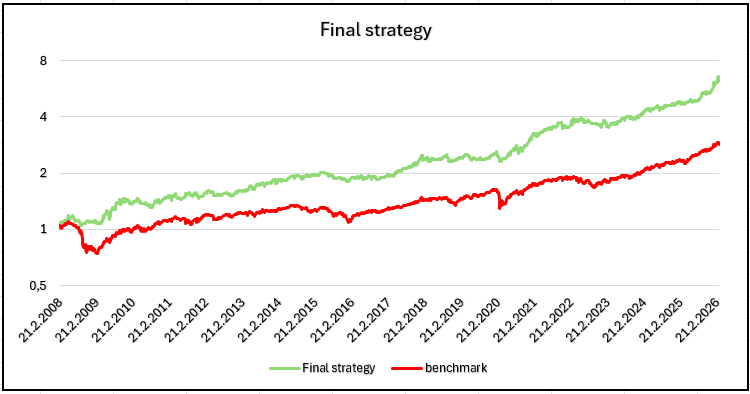

The backtest of this final strategy demonstrates that this average approach of the selected sub-strategies is highly effective. It not only outperforms the benchmark in every aspect, but also no other individual strategy achieved Sharpe and Calmar ratios as close to 0.9, which indicates the high efficiency of this combined approach.
Conclusion
The results of our analysis indicate that a dual momentum-based GTAA strategy can provide a robust and effective framework for tactical asset allocation. By incorporating both shorter-term (10-week) and longer-term (25-week) momentum signals with 3 selected ETFs, and applying an absolute momentum filter to avoid investing in declining assets, the final strategy achieves a strong balance between responsiveness and stability.
Backtesting demonstrates that the final average approach not only delivers attractive risk-adjusted returns, as reflected in the high Sharpe and Calmar ratios, but also results in lower drawdowns compared to the benchmark. This highlights the effectiveness of combining multiple momentum horizons and maintaining a disciplined, rules-based selection process.
Overall, our findings suggest that weekly rebalanced momentum-driven GTAA strategies, when carefully implemented with consideration for lookback periods, number of selected assets, and investment universe composition, can offer meaningful improvements in portfolio efficiency and resilience compared to simple equally weighted benchmarks.
Author: Sona Beluska, Junior Quant Analyst, Quantpedia
Are you looking for more strategies to read about? Sign up for our newsletter or visit our Blog or Screener.
Do you want to learn more about Quantpedia Premium service? Check how Quantpedia works, our mission and Premium pricing offer.
Do you want to learn more about Quantpedia Pro service? Check its description, watch videos, review reporting capabilities and visit our pricing offer.
Do you want algorithmic access to the full Quantpedia database via the API? Subscribe to Quantpedia Pro, ask for an API key, and explore the in/out-of-sample statistics, source academic papers, and code snippets — ideal for quantitative research, systematic trading workflows, and AI model training.
Are you looking for historical data or backtesting platforms? Check our list of Algo Trading Discounts.
Or follow us on:
Facebook Group, Facebook Page, Telegram, Twitter, Linkedin, Medium or Youtube
Share onLinkedInTwitterFacebookRefer to a friend


