Quantpedia’s Solution for Bear Markets

6.January 2019

Dear readers,

Equity markets have once again entered a high volatility regime at the end of the year 2018. Risk of an economic slowdown increases and investors and traders are looking for  trading strategies which can perform well in such uncertain times.

We at Quantpedia can help with that!

I am really excited to give you an opportunity to work with a new filtering field in our Screener, which you can use to find  strategies that can be utilized as a hedge/diversification to equity market risk factor during bear markets.

Come and find your new hedge!

Team of Quantpedia.com
 

Continue reading

ETFs Increase Correlation of International Equity Markets

4.January 2019

Everybody can see that international equity markets are highly correlated (and especially during past 10-15 years). A new interesting financial research paper shows that ETF arbitrage mechanism is one of the key channels through which U.S. shocks propagate to local economies leading to increased return correlation with the U.S. market:

Authors: Filippou, Gozluklu, Rozental

Title: ETF Arbitrage and International Correlation

Link: https://papers.ssrn.com/sol3/papers.cfm?abstract_id=3287417

Abstract:

Assets under management of exchange-traded funds (ETF) have been growing significantly, yet the majority of ETF trades still occur on U.S. exchanges. We show that investment decisions of both institutional and retail investors when trading international country ETFs are mostly driven by shocks related to U.S. fundamentals, measured by VIX, rather than local country risks. Investors react only to negative news about local economies. When U.S. economic uncertainty increases, investors leave the country ETF market and switch to Cash ETF products. We demonstrate that ETF arbitrage mechanism is one of the key channels through which U.S. shocks propagate to local economies leading to increased return correlation with the U.S. market both in time-series and cross-sectional dimensions. We find that countries with stronger ETF price-discovery and lower limits to arbitrage tend to have a higher comovement with the U.S. market.

Notable quotations from the academic research paper:

"Signi ficant innovations in financial products made international investments increasingly possible. Over the recent years, exchange-traded funds experienced a double-digit growth in assets under management. Nevertheless, the short-run interdependence of trading across major international ETFs and its association with local and global risk aversion remain understudied. While the majority of earlier studies focuses on direct eff ects of ETFs on the underlying securities in the basket that it tracks, we examine the indirect e ffect of ETF trading as a transmission mechanism of U.S. market shocks to foreign country equity markets.

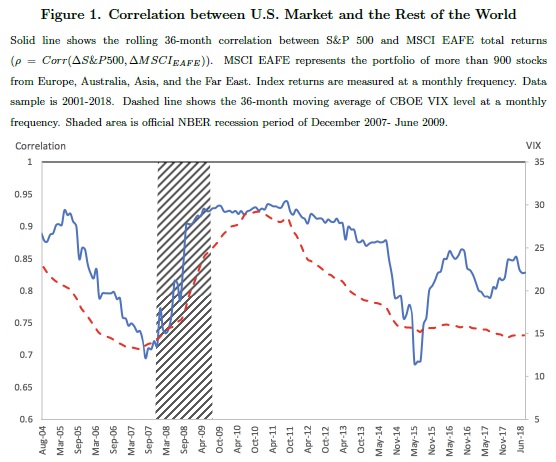
We provide a view that as the U.S. accommodates the largest share of ETF global trading volume, its market conditions directly impact the decisions of country ETF investors. We show that international ETF market participants trade based on shocks related to U.S. fundamentals rather than local ones, and propagate those shocks to local markets. The shock transmission is performed via ETF arbitrage. We argue that such arbitrage activity is one of the few mechanisms responsible for increasing correlation between the U.S. market and the rest of the world.

This high cross-country correlation limits the ability of investors to cheaply diversify U.S. risk via international ETF investments. In addition, ETFs often provide an easier access to less integrated emerging markets or to countries were direct investments are costly (e.g., Brazil). However, the transmission of U.S. shocks to those markets limits the diversi fication bene ts of emerging market strategies.

correlation

We fi rst test the hypothesis whether country ETF investors react to changes in the U.S. rather than local economic uncertainty, as measured by CBOE Volatility Index (VIX). To this end, we compute order imbalances of retail investors (e.g., Boehmer, Jones, and Zhang, 2017), and trades of di fferent size, capturing high frequency trading (HFT) and institutional trades. Focusing on a large cross-section of 41 countries, we find strong association between ETF order imbalances and U.S. VIX, indicating that international investment decisions are mainly driven by the latter measure, rather than its local counterparts. For example, an increase in the U.S. VIX results in a selling pressure in the country ETF market. Such result is robust to di fferent volatility regimes and is consistent across di fferent types of investors. Asymmetric response analysis confi rms that country ETF investors only react to positive changes in local VIX, which correspond to negative news in the local markets. Moreover, we observe that, when reacting to an increase in U.S. uncertainty, investors switch to safer assets such as cash equivalent ETFs. We also find that investors respond to changes in U.S. political uncertainty di fferently than to economic uncertainty – they leave the U.S. stock market and buy international country-level ETFs. However, they do not react to local political uncertainty and the economic eff ect of political risk is much smaller than of changes in U.S. VIX.

In order to access the impact of ETF arbitrage on correlation of country returns with the U.S. market, we regress daily innovations in such correlation on a proxy for ETF arbitrage during di fferent volatility regimes. We provide time-series evidence that during periods of high volatility in the U.S., an increase in the arbitrage activity by the authorized participant (AP) (as measured by net share creation/redemption) results in an increase in innovation in such daily correlation. We argue that during periods of high volatility in the U.S. market, it is harder for investors to distinguish between noise and fundamental component of the order flow. Consequently, based on wake-up call hypothesis investor may treat U.S. shocks as relevant to their own country and consume such shocks via ETF arbitrage.

We also explain cross-country variation in return correlation with the U.S. market. According to Ben-David, Franzoni, and Moussawi (2018), non-fundamental shocks must be reversed over time. This suggests that if all shocks transmitted from ETF market to local economies were non-fundamental, ETF arbitrage would not contribute towards increased correlation. In contrast, if the price deviation from the NAV is due to faster incorporation of fundamental information in ETF market, then arbitrage should a ffect returns of underlying index, and such e ffect should not be reverted. If such fundamental information is common both to U.S. and local market, one should observe a higher correlation between them.

Consistent with the literature, we argue that ETF transmits both fundamental and noise shocks to the underlying economies. We show that countries that have a higher degree of price discovery in their ETFs have on average a higher correlation with the U.S. market. In these markets fundamental information gets incorporated into ETF prices faster than in the Net Asset Value (NAV), and therefore, market makers closely follow and learn from changes in ETF prices. This is the case when derivative securities price the underlying assets, rather than the other way around. In addition, in order for fundamental shocks to get transmitted to underlying markets, the authorised participants (AP) must engage in arbitrage activity. We find that the lower the limits to ETF arbitrage the higher is the correlation between a country and the U.S. market. Neither the international trade channel nor the business cycles alter this result."


Are you looking for more strategies to read about? Check http://quantpedia.com/Screener

Do you want to see an overview of our database of trading strategies? Check https://quantpedia.com/Chart

Do you want to know how we are searching new strategies? Check https://quantpedia.com/Home/How

Do you want to know more about us? Check http://quantpedia.com/Home/About


Follow us on:

Facebook: https://www.facebook.com/quantpedia/

Twitter: https://twitter.com/quantpedia

Continue reading

FOMC Equity Drift Occurs in Periods of High Uncertainty

27.December 2018

A new research paper related mainly to:

#75 – Federal Open Market Committee Meeting Effect in Stocks

Authors: Martello, Ribeiro

Title: Pre-FOMC Announcement Relief

Link: https://papers.ssrn.com/sol3/papers.cfm?abstract_id=3286745

Abstract:

We show that the pre-FOMC announcement drift in equity returns occurs mostly in periods of high market uncertainty or risk premium. Specifically, this abnormal return is explained by a significant reduction in the risk premium (implied volatility and variance risk premium) prior to the announcement, but only when the risk premium is high, e.g., when it is above its median. Likewise, the magnitude of the FOMC Cycle and other related patterns varies with uncertainty and risk premium. Market uncertainty measures are persistent and are not related to policy uncertainty or expectations. Markets become only marginally stressed in the days prior to the announcement and changes in uncertainty appear to be of lower frequency. We also explain why recent studies suggest that the pre-FOMC drift might have disappeared in the past decade, as this moderation is due to time variation that was also present in older data. Additionally, CAPM only works on FOMC dates when the risk premium is high, e.g., implied vol above its prior median level. The results are robust to different samples and measures of risk premium and uncertainty.

Notable quotations from the academic research paper:

"We show that pre-announcement return drift is associated with significant declines in risk (premium) during times of high risk (premium). Implied volatility and the variance risk premium decrease in the hours before the announcement in an almost perfect mirror image of the increase in market prices. Moreover, we show that the magnitude of the return drift and the decline in risk depends on the level of market implied volatility, or other related variables, days or even weeks prior to the announcement.

Just to exemplify, the average pre-FOMC drift when implied volatility is above its prior median is 109 basis points (bps), while it is only 9.7 bps when it is below its median. In the bottom 20% of implied volatilities, the drift is close to zero or even negative, depending on the specification. Lucca and Moench [2015] also showed the importance of the VIX in their analysis, but here we show that this and other market uncertainty variables are actually essential for a better understanding of the pre-announcement return drift and all FOMC announcement related patterns. Figure 2 replicates a figure in Lucca and Moench [2015] that shows stock market performance around FOMC releases. Here we show that the pre-announcement drift is much stronger in periods of high risk premium and uncertainty.

We also provide clear evidence of investor relief, i.e., a decline in implied volatility or other risk measures, hours before the announcement using intraday information. Panel B of Figure 2 also shows that uncertainty is going down as a mirror image of the realized return. The magnitude of this pre-announcement investor relief also depends on the level of market uncertainty, as it tends to go down more when it is high. Considering the squared value of the VIX as our priced risk proxy, we show that, during high volatility periods, implied variance declines by 103.5 bps in anticipation of the announcement, while during low volatility periods, it rises by insignificant 0.3 bps. Hence, high volatility periods present both higher realized equity returns and greater resolution of market uncertainty hours before pre-scheduled announcements.

FOMC return patterns"


Are you looking for more strategies to read about? Check http://quantpedia.com/Screener

Do you want to see an overview of our database of trading strategies? Check https://quantpedia.com/Chart

Do you want to know how we are searching new strategies? Check https://quantpedia.com/Home/How

Do you want to know more about us? Check http://quantpedia.com/Home/About


Follow us on:

Facebook: https://www.facebook.com/quantpedia/

Twitter: https://twitter.com/quantpedia

Continue reading

Are Equity Markets Manipulated?

13.December 2018

We present two interesting research papers written by Bruce Knuteson. He contemplates why the cyclically adjusted price to earnings ratio of the S&P 500 index has been oddly high for the past two decades. He states that persistently strong equity market in US (and therefore also its high valuation in a comparison to history) and also in other developed countries can be an outcome of intraday trading pattern of several huge quant equity long-short funds which aggressively buy in the morning and sell in the afternoon to expand their trading book (or alternatively to simply manipulate market – push prices of stocks in their portfolio up).

Authors: Bruce Knuteson

Title: Information, Impact, Ignorance, Illegality, Investing, and Inequality

Link: https://arxiv.org/pdf/1612.06855.pdf

Abstract:

We note a simple mechanism that may at least partially resolve several outstanding economic puzzles, including why the cyclically adjusted price to ear nings ratio of the S&P 500 index has been oddly high for the past two decades, why gains to capital have outpaced gains to wages, and the persistence of the equity premium.

Notable quotations from the academic research paper:

"In United States equity markets, bid-ask spreads early in the trading day are typically larger than spreads later in the trading day. The price impact of aggressive trades early in the trading day is therefore typically larger than the price impact of equally sized aggressive trades later in the day.

Market makers make wider markets early in the trading day. The market, viewed as an information aggregator, respects the information content of aggressive orders early in the day more than the information content of equally sized aggressive orders later in the day. A repeated sequence of intraday round trips – e.g., buying in the morning and selling in the afternoon, repeated over many days – can therefore be expected to result in net price impact in the direction of the morning trade.

If some market participant (M) performs the same round trip each day – e.g., aggressively buying in the morning and selling in the afternoon – M’s trading will, on average, nudge the market’s midprice in the direction of his morning trading. If M has a large, slowly varying portfolio, the mark to market gains resulting from M’s daily intraday round trip trades can exceed the cost M incurs by crossing the spread twice each day.

In light of the above, it is striking that the returns to the S&P 500 index over the fifteen years spanning 1993 to 2007, inclusive, all came at the start of the trading day. Indeed, Figure 1 of Ref. [M. J. Cooper,  M. T. Cliff,  and H. Gulen (2008), Return Differences Between Trading and Non-trading Hours:  Like Night and Day, URL http://ssrn.com/abstract=1004081] is so striking it calls for a simple explanation. We propose such an explanation. We propose some market participant M, tending to trade in one direction early in the trading day and in the other direction later in the day, has had a much larger long-term effect on United States equity prices than has so far been widely appreciated.

day vs night return"

And:

Authors: Bruce Knuteson

Title: How to Increase Global Wealth Inequality for Fun and Profit

Link: https://papers.ssrn.com/sol3/papers.cfm?abstract_id=3282845

Abstract:

We point out a simple equities trading strategy that allows a sufficiently large, market-neutral, quantitative hedge fund to achieve outsized returns while simultaneously contributing significantly to increasing global wealth inequality. Overnight and intraday return distributions in major equity indices in the United States, Canada, France, Germany, and Japan suggest a few such firms have been implementing this strategy successfully for more than twenty-five years.

Notable quotations from the academic research paper:

"The Strategy is very simple: construct a large, suitably leveraged, market-neutral equity portfolio and then systematically expand it in the morning and contract it in the afternoon, day after day. The Strategy works because your trading will, on average, move prices in a direction that nets you mark-to-market gains. Bid-ask spreads are wider and depths are thinner near market open than near market close, so aggressive trades early in the trading day move prices more than equally sized aggressive trades later in the day. An intraday round trip (e.g., aggressively buying in the morning and selling in the afternoon) thus nudges the market's midprice in the direction of your morning trading. A reasonable level of daily round-trip trading combined with a suciently large portfolio will therefore produce expected mark-to-market gains exceeding the expected cost of your daily round-trip trading.

Figure 1, which shows cumulative overnight and intraday returns over the past 25 years in six major stock market indices: the S&P 500 index and the NASDAQ Composite index in the United States, Canada's TSX 60, France's CAC 40, Germany's DAX, and Japan's Nikkei 225 [20]. The return pattern in the S&P 500 index was rst pointed out over a decade ago. Similar return patterns have been identi ed in major indices of other developed countries. The only plausible explanation so far advanced for the highly suspicious return patterns in Figure 1 is someone using the Strategy.

day vs. night in other countries

"


Are you looking for more strategies to read about? Check http://quantpedia.com/Screener

Do you want to see an overview of our database of trading strategies? Check https://quantpedia.com/Chart

Do you want to know how we are searching new strategies? Check https://quantpedia.com/Home/How

Do you want to know more about us? Check http://quantpedia.com/Home/About


Follow us on:

Facebook: https://www.facebook.com/quantpedia/

Twitter: https://twitter.com/quantpedia

Continue reading

A Portfolio of Leveraged Exchange Traded Funds vs. Benchmark Asset Allocation

5.December 2018

A new interesting financial research paper gives an idea to build a diversified portfolio of leveraged ETFs (scaled down to have the same risk as a benchmark asset allocation built from a non-leveraged ETFs) to beat benchmark asset allocation. However, caution is needed as the most of the outperformance is due to inherent leveraged position in bonds because excess ratio of cash in portfolio (which is the result of using leveraged ETFs instead of non-leveraged ETFs) is invested in a short to medium term bonds:

Authors: Trainor, Chhachhi, Brown

Title: A Portfolio of Leveraged Exchange Traded Funds

Link: https://papers.ssrn.com/sol3/papers.cfm?abstract_id=3272486

Abstract:

Leveraged exchange traded funds (LETFs) are marketed as short-term trading vehicles that magnify the daily returns of an underlying index. With the proliferation of LETFs over the last 10 years, a diversified portfolio that mimics the returns of a 100% investment can be created using only a fraction of the investor’s wealth. Results suggest a portfolio created with LETFs outperforms a portfolio using traditional ETFs by approximately 0.6% to 1.4% annually by investing the excess wealth in a diversified or short to mid-duration bond portfolio. Downside risk is reduced using LETFs because the majority of the LETF portfolio is invested in a relatively safe bond fund.

Notable quotations from the academic research paper:

"Leveraged exchange traded funds (LETFs) were first listed in 2006 by Proshares, although leveraged mutual funds have been around since 1993. Although Proshares introduced +/- 2x products, Direxion upped the leverage ante with +/- 3x funds in late 2008. Because LETFs are designed to return a daily multiple, the constant daily leverage results in uncertain realized leverage over longer periods of time. In general, realized leverage tends to fall over time due to the volatility of returns.

With the expanded scope of the LETF market, it is now possible to create a diversified portfolio of LETFs that mimic a typical investor’s portfolio. By using 2x or even 3x funds, only a fraction of the investor’s portfolio is needed to attain the same exposure an investor has using standard ETFs and/or mutual funds. The downside is the higher expense ratios of LETFs, their internal financing costs, general leverage decay, and trading costs due to needed rebalancing to maintain the correct exposure. The upside is the excess wealth available that can be invested in relatively safe assets, and if the return to the invested excess wealth exceeds the higher cost of LETFs, returns should be enhanced.

This study shows a portfolio using 2x or 3x LETFs outperforms a portfolio using standard ETFs based on the same underlying indexes. This is possible since a 2x needs only 50% while a 3x needs only 33% of the wealth to create the same exposure to the underlying indexes. Even in the low interest environment from 2010-17, a portfolio of 2x LETFs outperforms a portfolio of standard ETFs by 0.9% annually. A portfolio of 3x LETFs outperforms by 1.8% annually.

Simulated LETF returns since 1946 show a portfolio of 2x LETFs can be expected to outperform a standard portfolio by 0.6% while a 3x LETFs outperforms by 1.4% after expenses. The caveat to this strategy is LETF portfolios must be rebalanced as their initial positions deviate from “optimal” asset allocations even faster than standard portfolios. A 10% barrier threshold keeps the risk exposure within reasonable bounds while keeping 2x rebalancing requirements to roughly each quarter and 3x to approximately monthly.

performance table

A critical determinant of the success of this strategy is the magnitude of returns to the capital not invested in the LETFs. This study assumes excess capital is invested in a short-term bond ladder and if the return to this ladder exceeds the borrowing cost from the implied leverage of LETFs and their higher expense ratios, LETF portfolios outperform. Historically, this occurs the majority of the time with 0.6% to 1.4% average annual outperformance with a simultaneous reduction in downside risk."


Are you looking for more strategies to read about? Check http://quantpedia.com/Screener

Do you want to see an overview of our database of trading strategies? Check https://quantpedia.com/Chart

Do you want to know how we are searching new strategies? Check https://quantpedia.com/Home/How

Do you want to know more about us? Check http://quantpedia.com/Home/About


Follow us on:

Facebook: https://www.facebook.com/quantpedia/

Twitter: https://twitter.com/quantpedia

Continue reading

A Turn of the Month Strategy in Asset Allocation

26.November 2018

A new research paper related mainly to:

#41 – Turn of the Month in Equity Indexes

Authors: McGroarty, Platanakis, Sakkas, Urquhart

Title: A Seasonality Factor in Asset Allocation

Link: https://papers.ssrn.com/sol3/papers.cfm?abstract_id=3266285

Abstract:

Motivated by the seasonality found in equity returns, we create a Turn-of-the-Month (ToM) allocation strategy in the U.S. equity market and investigate its value in asset allocation. By using a wide variety of portfolio construction techniques in an attempt to address the impact of estimation risk in the input parameters, we show significant out-of-sample benefits from investing in the ToM factor along with a traditional stock-bond portfolio. The out-of-sample benefits remain significant after taking into account transaction costs and by using different rolling estimation windows indicating that a market timing strategy based on the ToM offers substantial benefits to investors when determining the allocation of assets.

Notable quotations from the academic research paper:

"Seasonality is a well-known characteristic of financial markets with much empirical literature noting various types of seasonality in stock returns. Simple seasonality-driven investment strategies have attracted significant interest from academics and investors over the last forty years.

Amongst the calendar effects, the turn-of-the-month (ToM hereafter) has been acknowledged as one of the strongest and persistent seasonality found in stock returns. The ToM effect is the tendency of the stock market returns to display particularly high returns on the last trading day of the month and the first three trading days of the next month.

This study contributes to the literature on calendar anomalies in several dimensions. We examine the out-of-sample portfolio benefits resulting from adding the ToM portfolio to (i) a traditional equity-bond mix, (ii) a market portfolio, (iii) a portfolio which consists of the market portfolio, the small size portfolio and the value portfolio, and (iv) a portfolio, which consists of the market, the small size, the value portfolio and the winner portfolio.

performance of selected strategies

We employ a wide variety of sophisticated and popular asset allocation techniques to provide robustness to our results. Specifically, we employ the mean-variance (Markowitz) portfolio optimization, portfolio optimization with higher moments, Bayes-Stein shrinkage, Bayesian diffuse-prior portfolio, Black-Litterman and another portfolio construction method that combines individual portfolio techniques, to ensure that our results are not just a peculiar artefact on one particular asset allocation technique. Finally, we assess the ToM for low, medium and high-risk averse investors, as its effectiveness in the portfolio might depend on the investor’s level of risk aversion.

Our empirical evidence suggests that the ToM portfolio adds value when included in different portfolios. Our results hold for different levels of risk aversion, portfolio techniques and estimation windows. Finally, our results are not eliminated by the including realistic transaction cost estimates, indicating that the creation and implementation of a ToM factor should be of great interest and potential value to investors.

allocation to turn of the month strategy"


Are you looking for more strategies to read about? Check http://quantpedia.com/Screener

Do you want to see an overview of our database of trading strategies? Check https://quantpedia.com/Chart

Do you want to know how we are searching new strategies? Check https://quantpedia.com/Home/How

Do you want to know more about us? Check http://quantpedia.com/Home/About


Follow us on:

Facebook: https://www.facebook.com/quantpedia/

Twitter: https://twitter.com/quantpedia

Continue reading

Subscribe for Newsletter

Be first to know, when we publish new content


    logo
    The Encyclopedia of Quantitative Trading Strategies

    Log in

    MORE INFO
    We boasts a total prize pool of $15,000
    Gain a Share of a Total Prize Pool of $15.000
    MORE INFO
    $15.000
    Gain a Share of a Total Prize Pool