Book Value in Modern Era
Undoubtedly, in the recent past, the value is under scrutiny. Many researchers have aimed to answer questions like is the Value factor dead? The recent underperformance of the academic value factor (HML) can be tricky to understand, especially when most well-known and influential investors are labelled as “value” investors. A novel research paper by Choi et al. (2021) adds to the literature with its valuable insights. The main topic of the paper is the thorough examination of the B/M ratio in value style investing. Despite the well-known fact of the economy shift towards intangible assets, value investing still seems to be anchored to the B/M ratio that underestimates the true value. For example, Fama and French’s well-known HML value factor is based on B/M, value indexes are based on B/M (such as Russell value indexes) and subsequently, ETFs and benchmarks too.
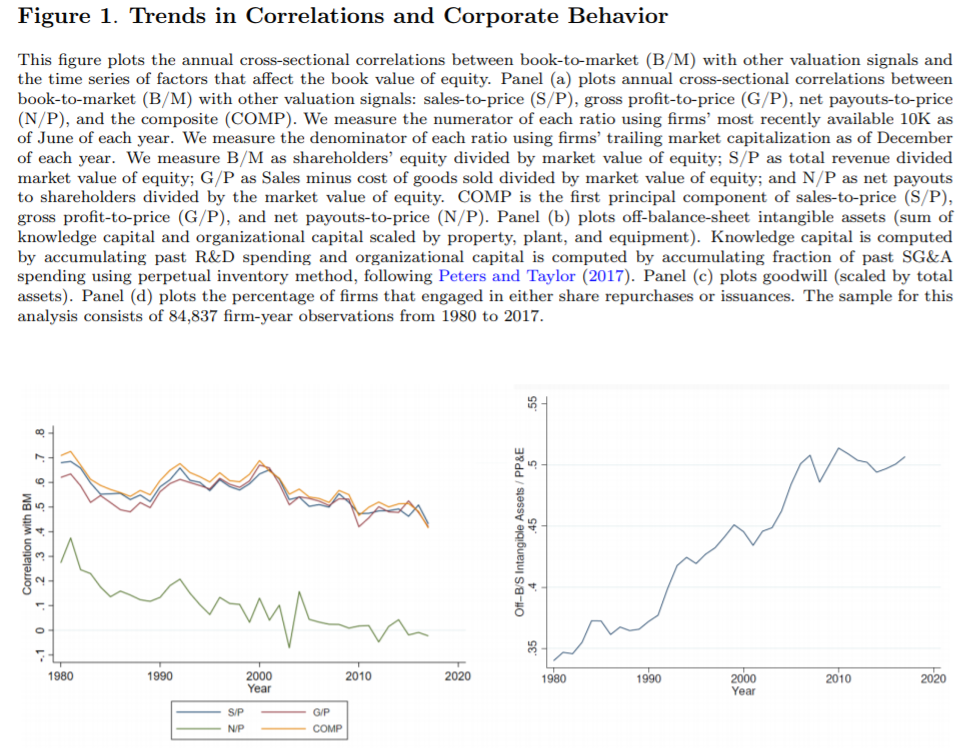
Additionally, the authors compare the B/M to other value metrics such as sales to price, gross profit to price, net payouts to shareholders to price and composite metric based on PCA. The correlation between B/M and other value measures is declining throughout the decades, which raises an important question. Are those B/M value investments even value investments? Should not we rethink value investing? In general, only time will tell if the value investing changes, but meanwhile, it seems that when the B/M and other metrics disagree, we should bet on the alternative metrics to unlock the long-short value performance.
Authors: Ki-Soon Choi, Eric C. So and Charles C. Y. Wang
Title: Going by the Book: Valuation Ratios and Stock Returns
Link: https://papers.ssrn.com/sol3/papers.cfm?abstract_id=3854022
Abstract:
We study the use of firms’ book-to-market ratios (B/M) in value investing and its implications for comovements in firms’ stock returns and trading volumes. We show B/M has become increasingly detached from common alternative valuation ratios over time while also becoming worse at forecasting future returns and growth in both an absolute and relative sense. Despite these trends, some major U.S. stock indexes and institutional funds continue relying on B/M when identifying value stocks and selecting index weights. Consistent with this reliance shaping market outcomes, we find firms’ stock returns and trading volumes comove with B/M-peers (i.e., firms with similar B/M) in excess of their fundamentals, particularly among stocks held by value-oriented funds. A shift in the economy toward firms investing in knowledge and organizational capital and increasing shareholder payouts contribute to these trends. Finally, we highlight simple adjustments to B/M that mitigate these issues.
As always we present several interesting figures:
Notable quotations from the academic research paper:
“We show that B/M has gradually detached from common alternative valuation ratios over time, and that B/M has become worse at forecasting future returns and fundamental growth in both an absolute and a relative sense. Second, in our main tests, we provide evidence that stocks continue to trade as if B/M outperforms other ratios as an indicator of firms’ future
performance, despite the opposite being true. Specifically, we show firms’ stock returns and trading volumes predictably comove along B/M in excess of fundamentals, particularly among stocks held by value-oriented funds. Together, our findings suggest some institutions have been slow to adapt to the declining relevance of book values for selecting value stocks and, in doing so, helping to shape the cross-section of stock returns and trading activity.
Dating at least as far back as Graham and Dodd (1934), academics and practitioners have used the B/M ratio to measure how cheaply firms’ net assets could be acquired. Influential studies in financial economics such as Fama and French (1992) likely contributed to the prominence of B/M by highlighting a robust positive relation between B/M and firms’ future
stock returns. Due to the time these influential studies were written, a notable feature is that they rely on vintages of data that are now several decades old. In recent decades, however, book values have become a less relevant valuation anchor. One reason is that, with the shift to a knowledge-based economy, public companies’ most valuable “assets” are often related to intellectual property, brand recognition, and customer loyalty, which are typically omitted from firms’ balance sheets. Thus, when omitting key “assets” for some firms, the ratio of book values to market prices (i.e., B/M) can provide a distorted view of the value proposition of buying firms’ net assets (Lev and Gu, 2016). Another distortive factor is the growing trend in shareholder payouts, for example due to share repurchases, which lower both book value and market capitalization.
| Algo Trading Data Discounts are available exclusively for Quantpedia’s readers. |
To assess the role of investors’ reliance on B/M, we identify cases where B/M significantly deviates from other relative value measures that we refer to as ‘benchmarks.’ We intentionally select specific ratios as benchmarks of comparison that serve a similar purpose as B/M, but whose numerators are less likely affected by the secular trends in the economy that motivate
our study. Specifically, our benchmarks include: sales-to-price, denoted S/P; gross-profitto-price, denoted G/P; net payouts to shareholders-to-price, denoted N/P; and a composite, denoted COMP. By identifying significant deviations between B/M and these benchmarks, we can study how investors price and trade stocks when facing conflicting value signals. Our empirical analysis begins by showing that the correlations between B/M and our
benchmarks steadily declined over time, consistent with B/M becoming a noisier signal of stocks’ value status. For example, the average cross-sectional correlation between B/M and COMP fell from approximately 0.7 to 0.45 during our 1980 to 2017 sample period. This trend of gradual detachment between the ratios coincides with a steady increase in firms’
off-balance-sheet intangible assets, goodwill, and stock issuances and repurchases.
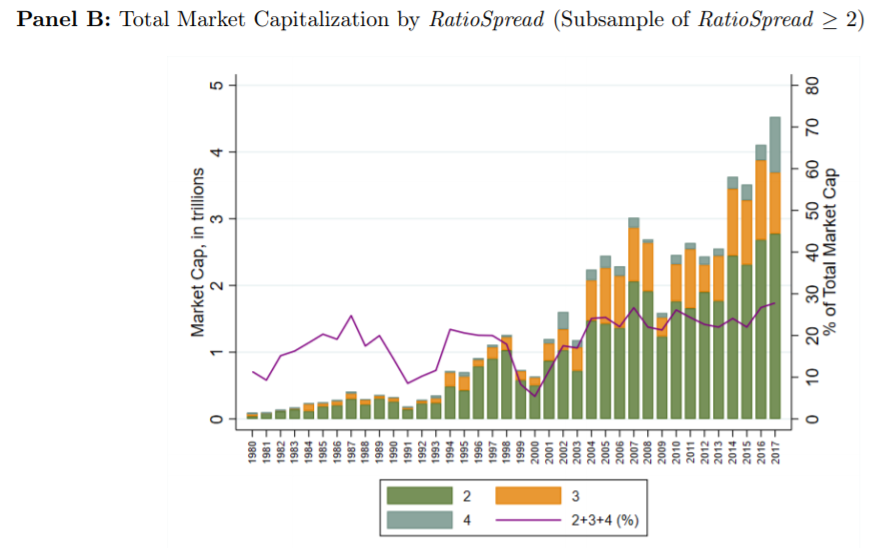
We also show that B/M has become worse at forecasting firms’ returns and fundamental growth in both an absolute and a relative sense. On an absolute basis, B/M has lost its ability to forecast stock returns in recent years, whereas the same is not true of our benchmark ratios.
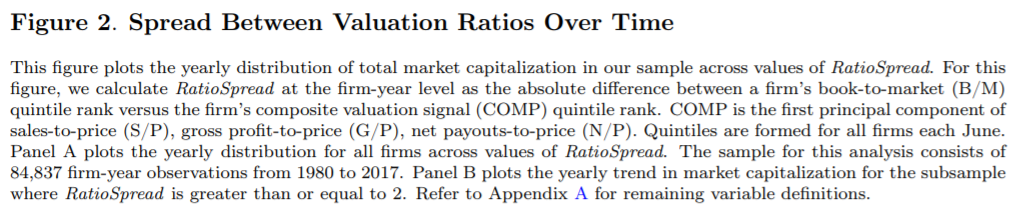
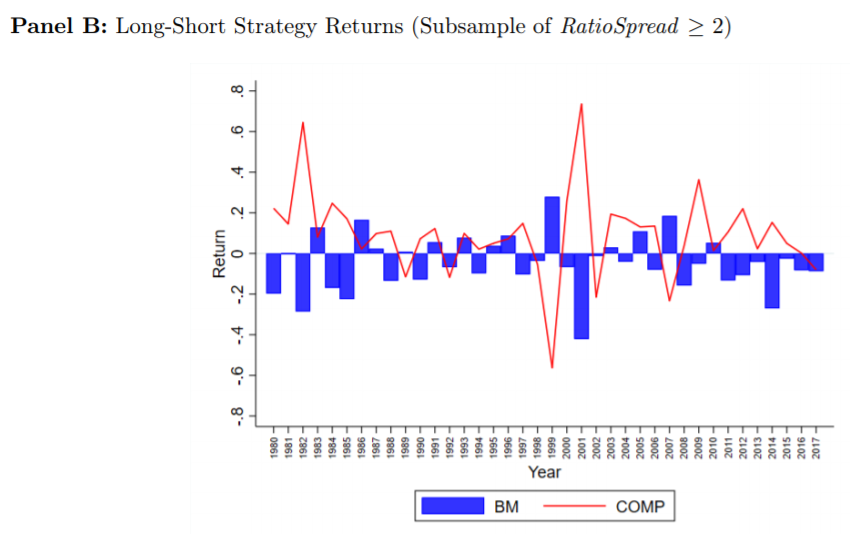
To assess relative performance, we identify cases where B/M substantially differs as a signal of value. In June of each year, we rank the cross-section of firms into quintiles based on B/M, and again independently rank firms into quintiles using our benchmarks. We then calculate the absolute spread in each firm’s B/M ranking relative to its ranking based on our benchmarks, denoted RatioSpread. Higher values of RatioSpread correspond to cases where firms appear as value firms in terms of B/M but as glamour firms in terms of our benchmarks, or as glamour firms in terms of B/M but as value firms in terms of our benchmarks. We show extreme values of RatioSpread have become increasingly prevalent over time. When RatioSpread is large, B/M performs predictably worse in forecasting future stock returns and growth in firms’ fundamentals. These findings illustrate that B/M has become a noisier measure of expected returns and growth, particularly in cases where it deviates from benchmark valuation ratios.”
Are you looking for more strategies to read about? Sign up for our newsletter or visit our Blog or Screener.
Do you want to learn more about Quantpedia Premium service? Check how Quantpedia works, our mission and Premium pricing offer.
Do you want to learn more about Quantpedia Pro service? Check its description, watch videos, review reporting capabilities and visit our pricing offer.
Do you want algorithmic access to the full Quantpedia database via the API? Subscribe to Quantpedia Pro, ask for an API key, and explore the in/out-of-sample statistics, source academic papers, and code snippets — ideal for quantitative research, systematic trading workflows, and AI model training.
Are you looking for historical data or backtesting platforms? Check our list of Algo Trading Discounts.
Or follow us on:
Facebook Group, Facebook Page, Telegram, Twitter, Linkedin, Medium or Youtube
Share onLinkedInTwitterFacebookRefer to a friend


