Boundaries of Time Series Momentum
Time-series momentum stands as one of the most reliable and heavily backtested anomalies in quantitative finance, serving as a foundational alpha source for modern managed futures and trend-following strategies. However, a recent academic paper by Matti Suominen and Erik Hjalmarsson, titled “Boundaries of Time Series Momentum,” uncovers a structural vulnerability that every practitioner must account for. The authors demonstrate that while equity market trends persist reliably during normal business cycles, they systematically break down and aggressively reverse when market valuations reach historical extremes. This phenomenon establishes clear macro “boundaries” where chasing the trend shifts from a highly profitable strategy to a severe drawdown risk.
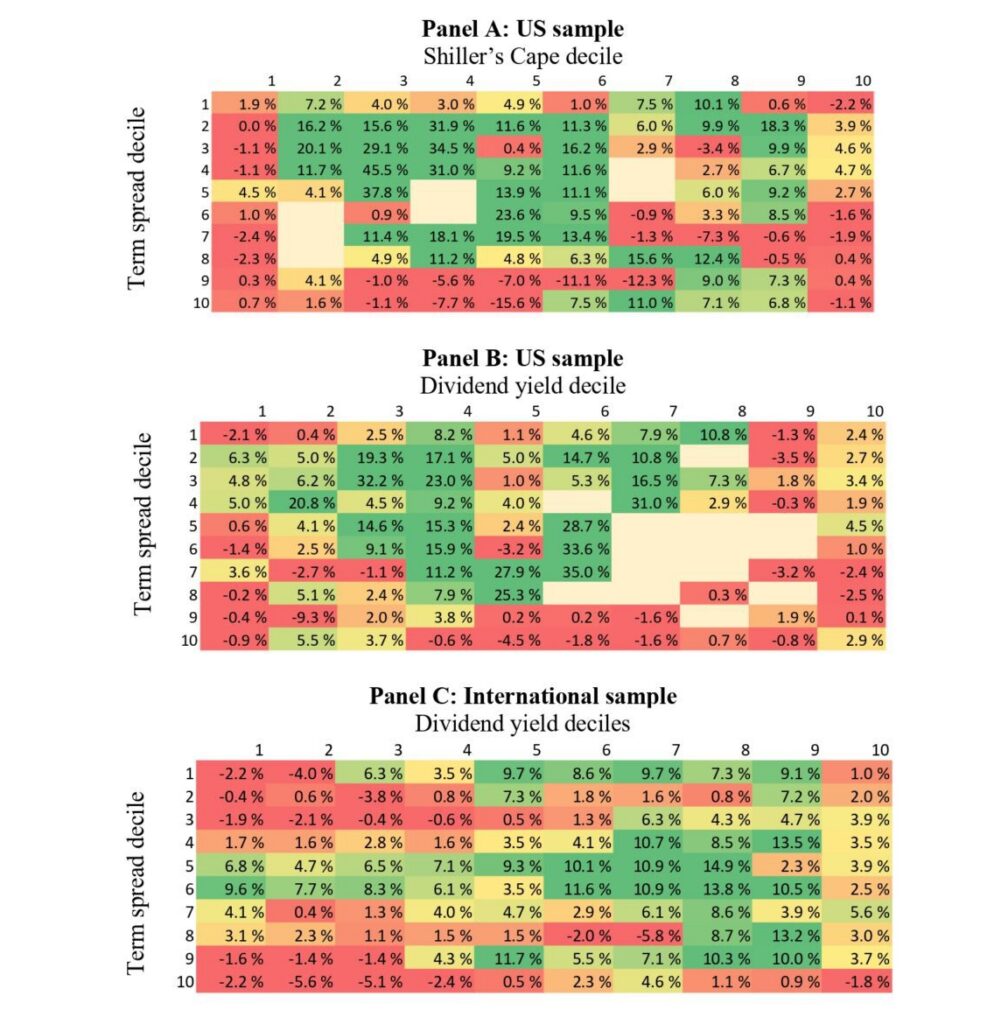
From a practitioner’s perspective, the paper provides a highly actionable framework by mapping momentum performance across three primary valuation anchors closely tied to the macroeconomy: Shiller’s CAPE ratio, aggregate dividend yields, and the government bond yield-curve slope. The core finding is that time-series momentum delivers stellar, robust returns during mid-valuation regimes—the steady expansionary phases of the macro business cycle. However, as these fundamental metrics stretch toward their 10- or 20-year historical extremes, market dynamics shift abruptly. At these boundaries, the underlying asset prices begin to reflect macroeconomic turning points, causing established trends to fracture and give way to sudden, sharp equity market return reversals.
For quantitative traders and portfolio managers, ignoring these macro boundaries introduces significant uncompensated risk. The statistical impact of integrating these valuation limits into predictive frameworks is stark: controlling for equity market return reversals near historical extremes increases the R² of a predictive regression of equity market returns by up to 110%, and boosts the R² of a predictive regression of time-series momentum returns by an astonishing 550%. This near-universal breakdown occurs consistently regardless of whether valuations are extremely high or low, and regardless of whether the prevailing momentum signal is positive or negative. The extreme valuation states coincide with environments where both the broader economy and central bank monetary policies become highly sensitive to past equity returns, effectively killing the continuation of the trend.
The critical takeaway for practitioners is that momentum is not a purely behavioral phenomenon to be traded in a silo; it is inextricably linked to fundamental valuation anchors and macro regimes. Systematic trend-followers can drastically minimize tail risk and optimize their alpha generation by implementing a regime-conditioned overlay that dynamically scales down risk exposure or prepares for reversals when CAPE, dividend yields, or term spreads pierce their 10- to 20-year historical boundaries. To build a more resilient strategy, lookback windows should be paired with macro-valuation filters, shifting your execution from a blind, purely reactive mathematical trend model to a value-aware, macro-regime-conditioned execution framework.
Authors: Matti Suominen and Erik Hjalmarsson
Title: Boundaries of Time Series Momentum
Link: https://papers.ssrn.com/sol3/papers.cfm?abstract_id=6867878
Abstract:
Shiller’s CAPE, dividend yield, and the government bond yield-curve slope are measures of value in equity and bond markets. We find that equity market time-series momentum performs well in mid-valuation regimes, but breaks down near historical valuation extremes, where the direction of the equity market commonly turns. Controlling for equity market return reversals-when valuation measures are near their 10-or 20-year historical extremes-increases the R 2 of a predictive regression of equity market returns by up to 110% and the R 2 of a predictive regression of time series momentum returns by up to 550%.
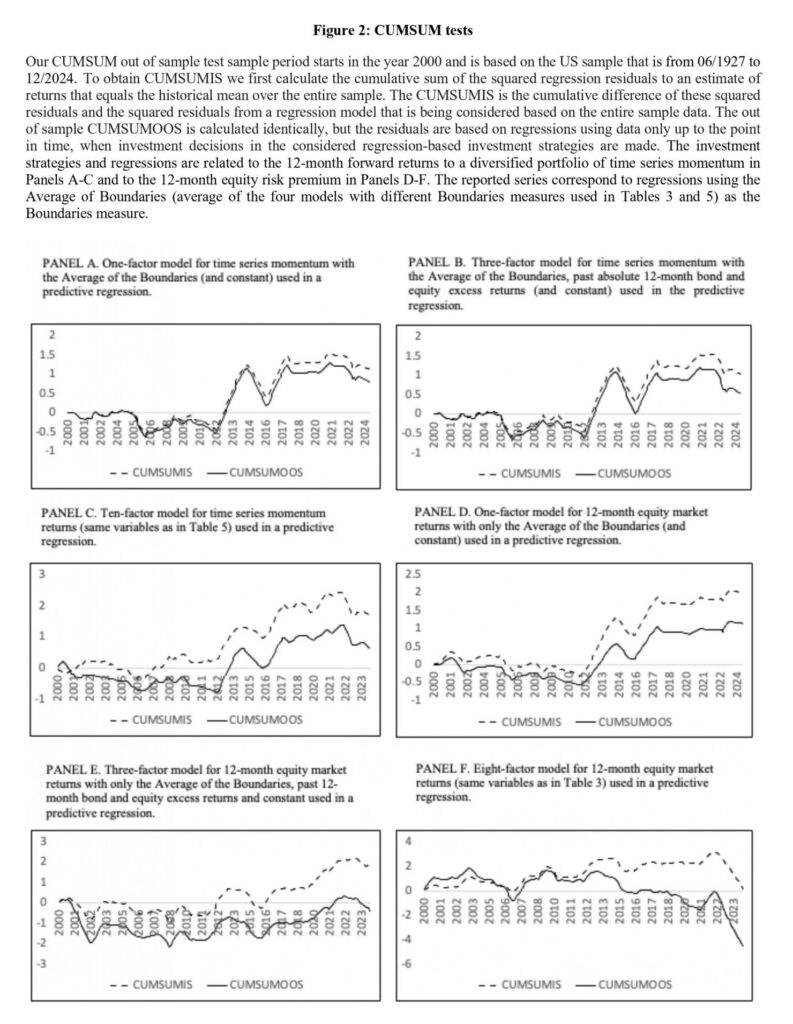
As always, we present several interesting figures and tables:

Notable quotations from the academic research paper:
“[Authors] document 12-month equity return reversals in extreme equity and bond valuation regimes (proxied by moving averages of the term spread and either CAPE or the dividend yield). Controlling for these reversals significantly increases return predictability in U.S. and international samples.
- Equity time series momentum performs best in mid-valuation regimes but breaks down near valuation extremes, where large absolute 12-month returns negatively predict momentum returns.
- [Authors] attribute this breakdown to greater sensitivity of macroeconomic conditions to past equity returns in extreme regimes: growth, recession risk, monetary policy (short-term yields), and long-term rates become more tightly linked to prior market returns, potentially causing reversals.
[Authors] show that moving averages of the term spread and either Shiller’s CAPE or dividend yield jointly predict the economic growth and equity returns at a 12-month horizon. Our main contribution is to show that when these valuation measures are near their historical extremes, time series momentum does not work. More precisely, using these ratios we define a variable Boundaries, such that when the Boundaries variable is low, equity market time-series momentum works, but when the Boundaries variable is high, momentum breaks down. The Boundaries variable is useful in predicting time series momentum returns as well as the equity market risk premium at a 12-month horizon also in out-of-sample regressions. These results are relevant for investors who can use the information to better time their equity market exposure and exposure to time series momentum strategies.”
Are you looking for more strategies to read about? Sign up for our newsletter or visit our Blog or Screener.
Do you want to learn more about Quantpedia Premium service? Check how Quantpedia works, our mission and Premium pricing offer.
Do you want to learn more about Quantpedia Pro service? Check its description, watch videos, review reporting capabilities and visit our pricing offer.
Do you want algorithmic access to the full Quantpedia database via the API? Subscribe to Quantpedia Pro, ask for an API key, and explore the in/out-of-sample statistics, source academic papers, and code snippets — ideal for quantitative research, systematic trading workflows, and AI model training.
Are you looking for historical data or backtesting platforms? Check our list of Algo Trading Discounts.
Or follow us on:
Facebook Group, Facebook Page, Telegram, Twitter, Linkedin, Medium or Youtube
Share onLinkedInTwitterFacebookRefer to a friend