Can Technology Sector Leadership Be Systematically Exploited?
The U.S. equity market has periodically been dominated by a few technology-driven stocks, most recently the so-called “Magnificent Seven.” Historically, similar dominance occurred during the Nifty Fifty era in the 1960s–1970s and the dot-com boom in the 1990s. These periods of concentrated leadership often led to temporary outperformance, but systematically capturing such gains has proven challenging. Our study investigates the potential to exploit technology sector dominance using momentum-based strategies across Fama–French 12 industry portfolios, analyzing whether long-only, long-short, and rolling-basis approaches can generate persistent alpha, and assessing the limitations of simple timing methods.
Introduction
We are once again in a period when the U.S. equity market is dominated by a small group of stocks — the so-called Magnificent Seven. This group consists of Apple, Microsoft, Alphabet, Amazon, Nvidia, Meta Platforms, and Tesla, seven technology-oriented giants that together account for more than a quarter of the S&P 500’s total market capitalization. Their influence on overall market performance has become extraordinary, driven by innovation in artificial intelligence, cloud computing, and digital platforms.
This level of concentration is not unprecedented. In the late 1990s, technology and telecom stocks led the market to extreme valuations before the dot-com correction. In the 1960s and 1970s, the Nifty Fifty represented a similar era of dominance by a handful of large-cap growth stocks. Even earlier, energy and industrial companies played a comparable role during postwar expansions.
Since the current leadership is again driven primarily by the technology sector, our main interest lies in understanding how dominant this sector truly is compared with the rest of the market and whether such dominance can be systematically exploited.
Methodology
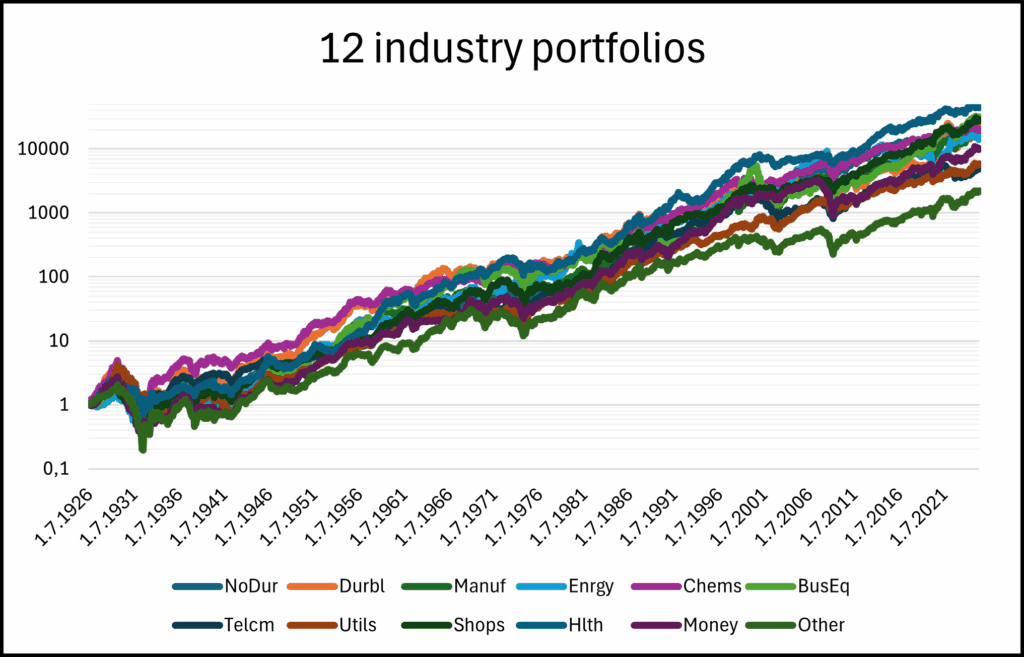
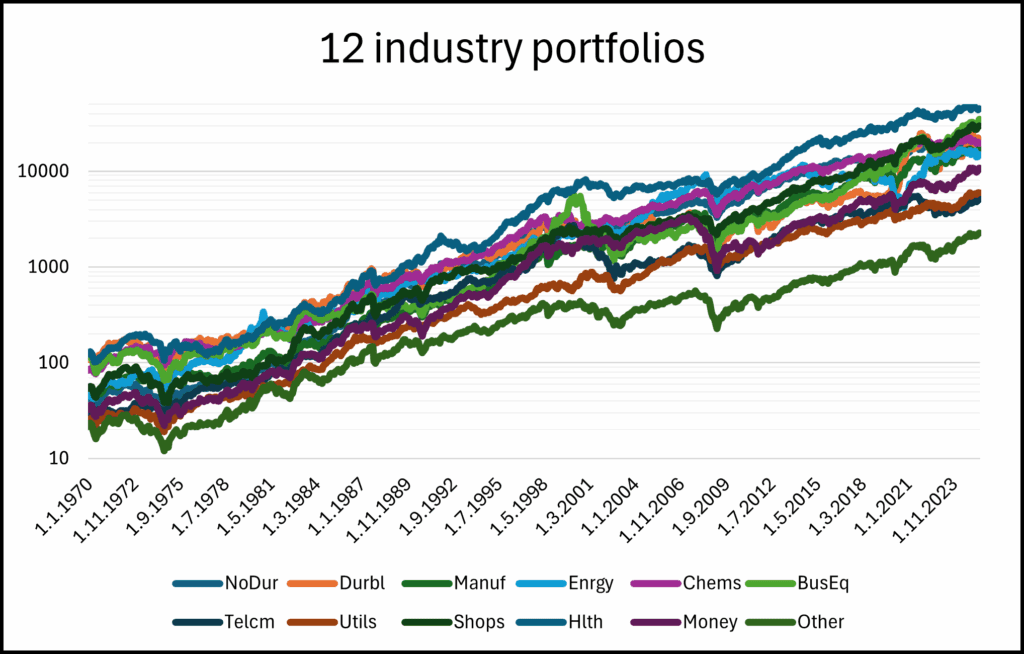
For this analysis, we utilized the dataset of 12 industry portfolios: Nondurable Goods (NoDur), Durable Goods (Durbl), Manufacturing (Manuf), Energy (Enrgy), Chemicals (Chems), Business Equipment (BusEq), Telecommunications (Telcm), Utilities (Utils), Shops (Shops), Health (Hlth), Finance (Money), and Other (Other), sourced from Fama-French. The dataset contains monthly observations for each portfolio from July 1926 to June 2025. Our proxy for the IT sector for the whole 100year period is the Business Equipment (BusEq) sector/industry.
To capture the potential of the technological sector’s growing trend, we focus on investing in this sphere separately, using several different approaches, before proceeding to an examination of all 12 industries.
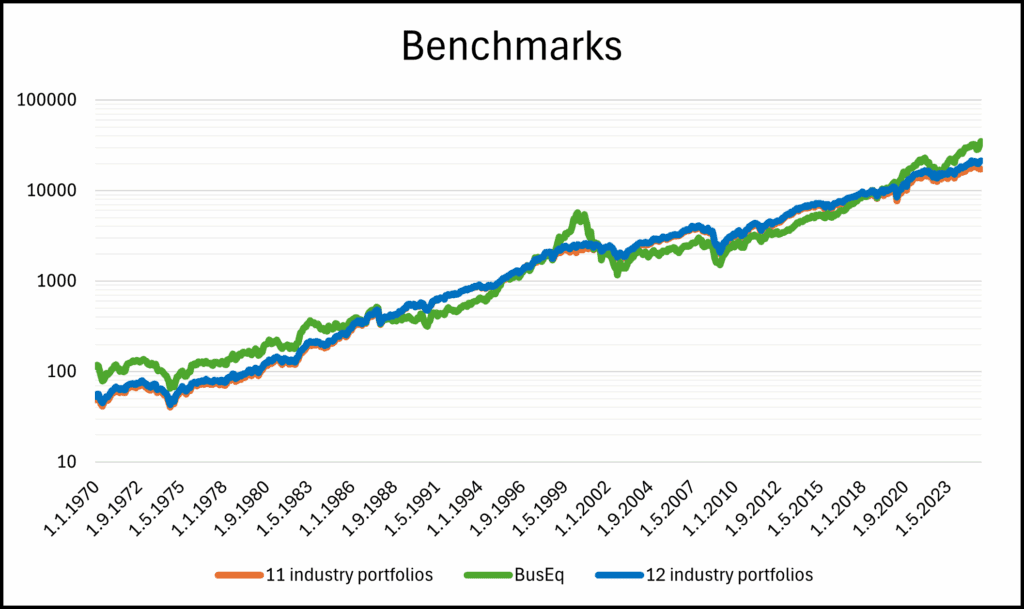
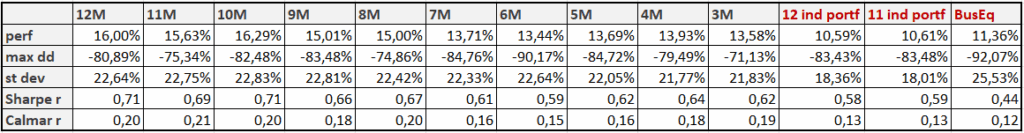
As a first step, we define the benchmarks, against which our trading strategies will be compared:
- the average of all 12 industry portfolios,
- the average of 11 industry portfolios excluding the technology sector – Business Equipment (BusEq),
- the technology sector (Business Equipment – BusEq) alone.
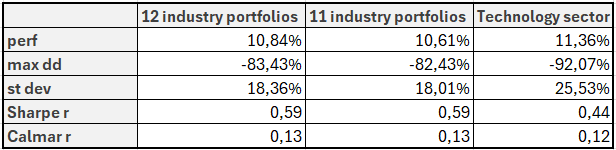
Basic performance characteristics in tables are presented as follows: the notation perf represents the annual return of the strategy, st dev stands for the annual standard deviation, max dd is the maximum drawdown, adjusted Sharpe r is calculated as the ratio of perf to st dev and adjusted Calmar r as the ratio of perf to max dd.
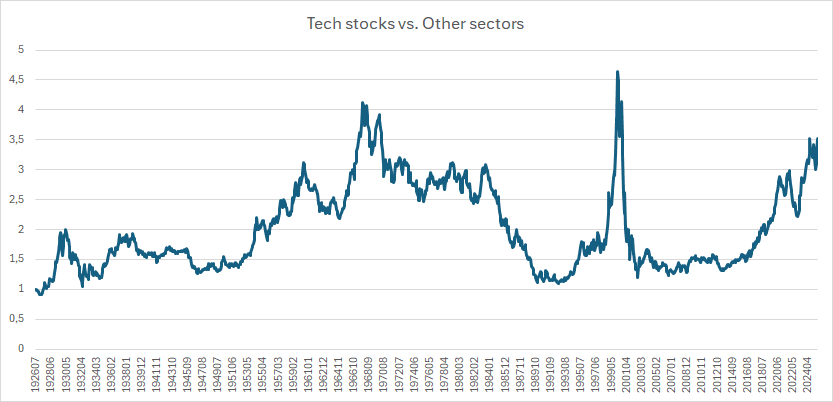
What we can learn about the performance of the technological sector if we study its performance against peers? Historically, we can identify 3 major periods of the technological revolutions. The first occurred in the 1970s, during the era of the Nifty Fifty and the rise of early computing giants such as IBM, driven by innovations like the first microprocessors. Business Equipment sector mainly included manufacturers of office and industrial machinery rather than modern IT firms. Despite innovations like the microprocessor, growth was limited by stagflation and high interest rates, leaving the sector’s performance in line with the broader market.
The second wave came in the 1990s, marked by the internet boom and the explosive growth of software and telecom companies leading up to the dot-com bubble. During the 1990s, equity markets have grown rapidly as inflation fell, monetary policy stabilized, and financial deregulation took hold. The expansion of index funds, derivatives, and computing technology improved market efficiency and fueled a long structural bull market through the 1990s, particularly in the technology sector. However, this period was followed by a noticeable decline in returns thereafter.
After the early-2000s downturn, the technology sector stayed subdued until around 2010–2012, when cloud computing, smartphones, and platform-based models reignited growth. Companies such as Apple, Amazon, Google, Microsoft, and Facebook drove a new wave of expansion through the 2010s. In recent years, artificial intelligence has added further momentum, reinforcing the dominance of large technology firms in global equity markets.
However, history shows that after each of these revolutionary periods, markets eventually returned to reality. The technology sector, following phases of exuberant growth, tended to experience substantial underperformance as valuations normalized and leadership rotated to other industries. Will the current bull market in AI stocks end the same?
Strategies
Our exploration of industry portfolios consist of several investment approaches with the aim of beating the benchmarks. We will present them one by one.
Moving average strategy
As a first step, we decided to design trading strategies based on a moving average. Firstly, we focused on the part of the market formed by the technology sector, or more precisely, on how much of its performance can be explained by the remaining industry portfolios.
For each month, we subtracted the average return of the other eleven portfolios from the return of the technology sector. In other words, we worked with the technology-vs.-rest spread.
We then constructed an equity curve from this spread and calculated its moving average. If the current value of the spread exceeded the average value of the equity curve over the specified period, the strategy took a long position in technology stocks and a short position in the 11 other sectors/industries for the following month. Otherwise, the positions were reversed, long in the 11 other sectors/industries and short in technology stocks. When the current value of the spread is above its moving average, it indicates that the technology sector’s recent performance exceeds its long-term trend, suggesting strengthening relative demand. In such situations, investors may be reallocating toward technology, which can signal the continuation of its outperformance in the near term. We tried this approach on different windows for the moving average, specifically from 3 months to 12 months. This procedure was repeated monthly. For better visualisation is graphical interpretation in logarithmic scale.
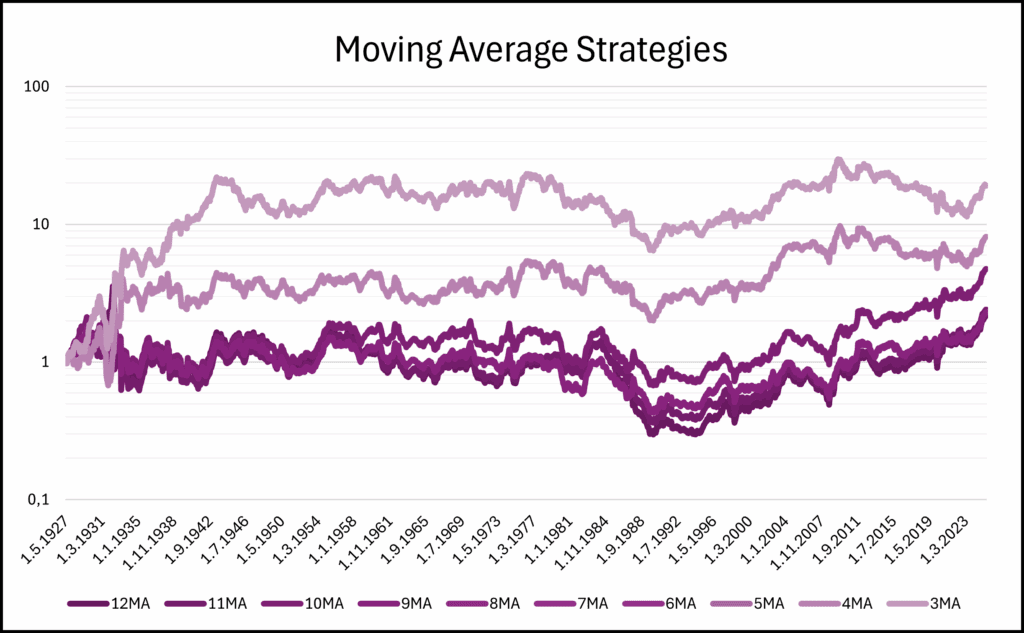
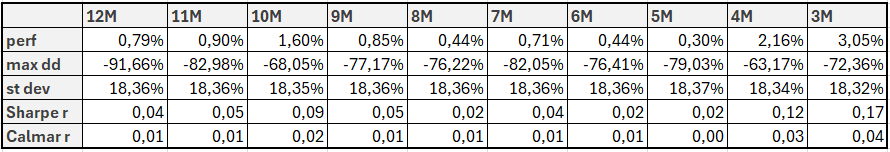
From both the graph in Figure 4 and Table 2, we can see that this approach is moderately profitable but extremely volatile. The periods without a clear trend are long, and the strategy tends to make money only when a technology bubble is inflating or bursting. Otherwise, its performance is rather weak and falls well short of our expectations, which is why we moved on to a different strategies.
Long-only momentum strategy
Next, we focused on a momentum-based approach. This time, we compared the momentum of the technology portfolio with the momentum of the average of the remaining 11 industry portfolios. If the momentum of technology was higher, we took a long position in technology for the following month. Otherwise, we went long in the average of the other industries. This procedure was repeated on monthly bases. Once again, we tested various momentum lengths, ranging from 3 to 12 months . For better visualisation, we use a logarithmic scale.
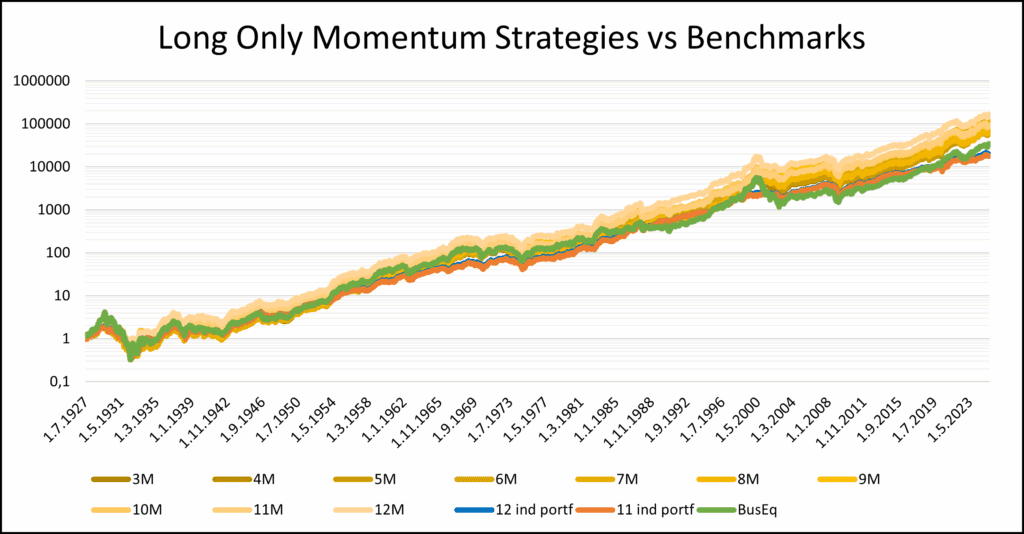
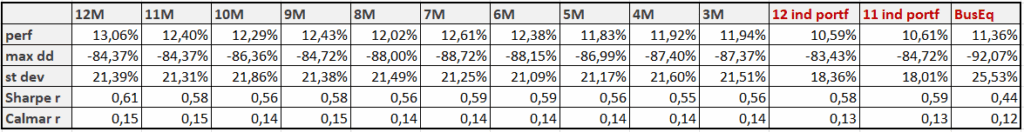
We can see that although the long-only strategies achieve higher performance, they mostly fail to outperform the benchmarks. The return-to-risk values are very similar across different settings, and except for the 12-month momentum, where we slightly outperform the benchmark, other MA lengths are unable to exceed benchmarks in both return-to-risk ratios simultaneously. Therefore, we decided to experiment further with momentum and developed a long–short strategy.
Long-short momentum strategy
In this case, we again compared each month the momentum of the technology portfolio with the momentum of the average of the remaining 11 portfolios. However, this time, if the momentum of technology was higher, we took a long position in technology and a short position in the average of the 11 portfolios. Otherwise, we reversed the positions, long in the average and short in technology. Graphical results are presented in logarithmic scale.
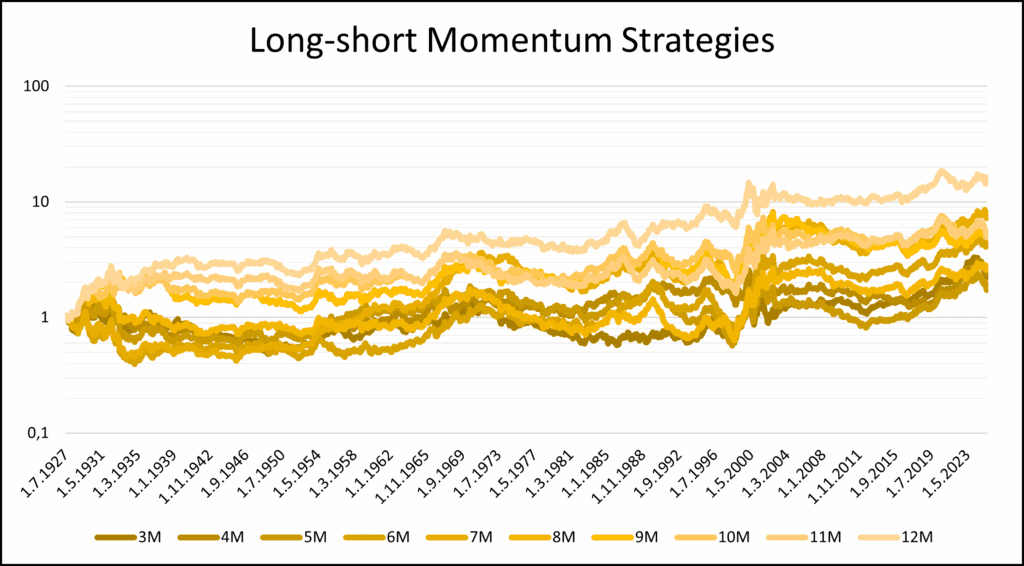
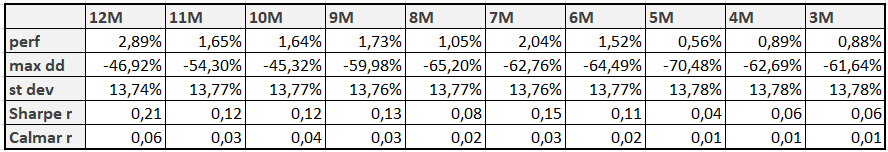
Compared to the moving average strategies shown in Figure 4 and Table 2, the results have improved slightly, but relative to the previous approach and especially to the long-only benchmarks, the performance is nothing spectacular. Therefore, we decided to take a different perspective, as it turned out that fixing the best-performing industry in advance is not an optimal approach. Technology is not always the strongest sector, and the periods when it performs well are relatively few. Moreover, this method also introduces a look-ahead bias. Therefore, it is better to design an algorithmic approach that selects the best-performing industry relative to the others each period, rather than assuming it will always be the technology sector.
Long-only rolling-basis strategy
This rolling-basis strategy is also momentum-based, but this time we compare the momentum of all 12 sectors/industries against each other. For the following month, we invest only in the sector with the highest momentum, effectively letting the data determine which sector is the best performer. As before, we set the momentum calculation window to range from 3 to 12 months and the process is repeated each month. For better visualization, we again use a logarithmic scale.
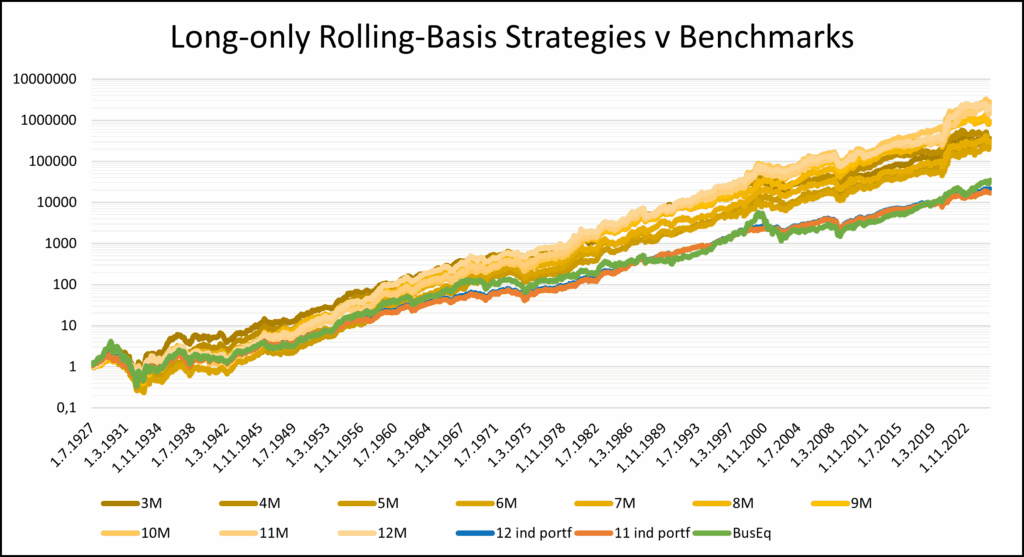
The results of this strategy suggest that this approach is more meaningful and that it indeed makes sense to “invest in the bubble.” However, the performance and ratios figures are only slightly better than the benchmarks. Therefore, we moved on to a different approach.
Long-short Rolling-Basis strategy
In this case, we also tested a long–short approach. Each month, we again compared the momentum of all portfolios, but this time we went long in the best-performing industry and short in the remaining ones with equal weights for the following month. We apply this approach primarily to observe the alpha, that is, the portion of performance attributable to strategy, rather than market movements. Again, we repeated this process each month, but this time we extended the momentum window, analyzing periods ranging from 1 month to 12 months. Again, graphical interpretation is in logarithmic scale.
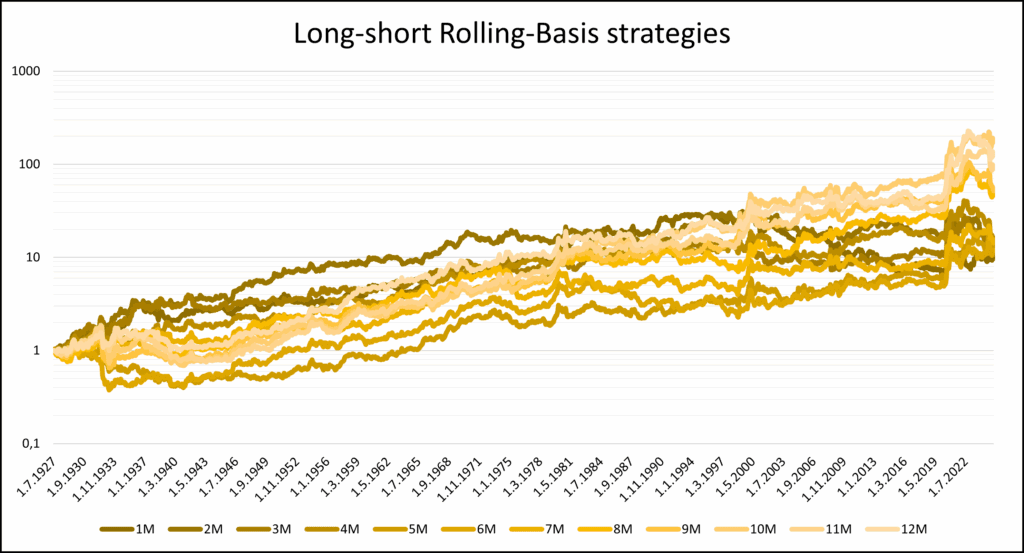
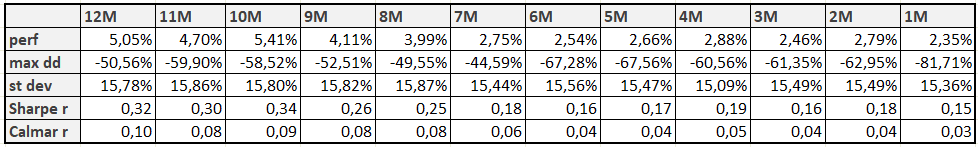
With this method, we can already observe a clear alpha, showing that longer horizons (8–12 months) are more effective than shorter ones in identifying the outperforming sector. In terms of performance and ratio metrics, the results don’t approach the benchmarks; however, we didn’t expect that, as all strategies are based on long-short and therefore all of the metrics are usually lower than long-only variants.
We came up with one last idea — to examine when this outperformance actually occurs, that is, when the best-performing industry starts to outpace the others. To explore this, we conducted a simple analysis by creating average equity curves of all long–short momentum strategies and then building a strategy, that is timing this aggregate performance equity curve.
Modified Long-Short Rolling-Basis strategies
In the final part, we decided to further refine the long–short rolling-basis approach and developed 3 new strategies. For each month, we identified the portfolio with the highest momentum across all time windows, from 1-month to 12-month momentum. In the following month, for each momentum horizon, we went long in the best-performing sector and short in the remaining ones, just as in the previous section. This time, however, we combined all these approaches simultaneously, applying them equally-weighted and aggregating them into a single composite strategy. Let’s label this strategy as “average mom“.
The second and third strategies are derived from the first one. After creating the equity curve of the “average mom” strategy, we first focus on its 12-month maximum. If, in a given month, the “average mom” equity curve reaches its 12-month high, we invest in the “average mom” strategy for the following month. Otherwise, we stay out of the market. As usual, this process is repeated each month. In this way, we created the “12M Mom Max” strategy.
The last tested strategy is very similar, but instead of focusing on the maximum, we look at the 12-month moving average. If, in the current month, the value of the “average mom” equity curve is above its 12-month moving average, we invest in the “average mom” strategy for the following month. Otherwise, we stay out of the market, repeating this process each month. We label this strategy “12M Mom MA“.
All 3 approaches are then plotted together alongside the benchmarks for comparison in logarithmic scale.
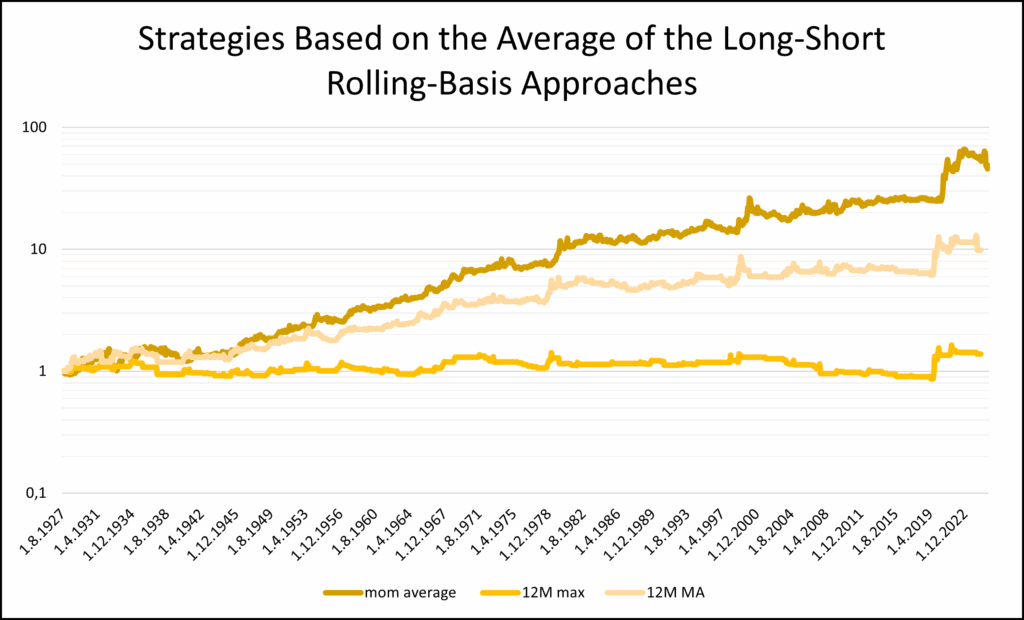
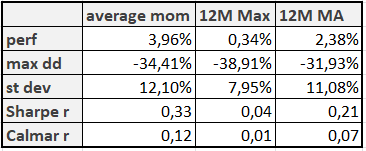
Reviewing the “average mom” strategy, we can observe that there was alpha up to the 1950s, but this is based on Fama–French data, and individual sectors at that time could not be easily traded, so this represents a theoretical alpha. From the 1950s onward, most of the alpha performance occurs in three distinct periods: the 1970s, 1990s, and 2020s, corresponding to new technological eras. Outside of these periods, the performance of the “average mom” is roughly flat. Unfortunately, trying to improve the “average mom” by using the new high or moving average filter approach doesn’t increase the performance of return-to-risk ratios. So, at the end, we can conclude that the simple “buy the best performing sector over the last 12-month period, short the rest, hold for 1 month” strategy is the best approach to exploit the cross-sectional sector performance dispersion.
Conclusion
Our analysis shows that technology-driven periods have dominated equity markets, but systematically exploiting them remains challenging. Simple moving-average and momentum strategies focused solely on technology can occasionally generate outperformance, yet they are highly volatile and often fail to surpass benchmarks. Rolling-basis approaches that select the best-performing industry each month provide clearer alpha, particularly over longer momentum horizons, but performance remains modest outside the major technological revolutions of the 1970s, 1990s, and 2020s.
Attempts to time these periods using simple heuristics, such as new highs or moving averages, proved difficult, underscoring the episodic and unpredictable nature of sector-driven outperformance. While momentum strategies can capture trends during technological waves, they should be implemented with caution as they tend to deliver alpha only over the longer horizons.
Author: Sona Beluska, Junior Quant Analyst, Quantpedia
Are you looking for more strategies to read about? Sign up for our newsletter or visit our Blog or Screener.
Do you want to learn more about Quantpedia Premium service? Check how Quantpedia works, our mission and Premium pricing offer.
Do you want to learn more about Quantpedia Pro service? Check its description, watch videos, review reporting capabilities and visit our pricing offer.
Do you want algorithmic access to the full Quantpedia database via the API? Subscribe to Quantpedia Pro, ask for an API key, and explore the in/out-of-sample statistics, source academic papers, and code snippets — ideal for quantitative research, systematic trading workflows, and AI model training.
Are you looking for historical data or backtesting platforms? Check our list of Algo Trading Discounts.
Or follow us on:
Facebook Group, Facebook Page, Telegram, Twitter, Linkedin, Medium or Youtube
Share onLinkedInTwitterFacebookRefer to a friend


SUBSCRIBE TO NEWSLETTER AND GET:
- bi-weekly research insights -
- tips on new trading strategies -
- notifications about offers & promos -

Subscribe