Can We Use U.S. Government Shutdowns as a Signal for Investment Decisions?
In recent times, we have observed heightened volatility across financial markets. Concerns surrounding government shutdowns, as well as the uncertainty they create, do little to calm these fluctuations. Rather than being purely disruptive, however, such events raise an intriguing question: could these episodes of political and economic uncertainty actually be leveraged to our advantage in investment strategies? In this article, we will examine several asset classes and attempt to assess whether this phenomenon provides a sufficiently relevant signal for investment decisions.
How we define a shutdown
A government shutdown occurs when Congress fails to pass or the president refuses to sign a spending bill to fund the federal government’s operations. This results in a funding gap that can cause several government functions to be temporarily disrupted. Government shutdowns are often resolved by Congress passing continuing resolutions, which provide short-term funding while negotiations for a long-term solution continue.
For our analysis, we utilize data from 11 U.S. government shutdowns (as mentioned in Wikipedia). As the starting point of each shutdown, we consider the first business day on which the shutdown occurred. In cases where the shutdown began on a weekend or federal holiday, we take the first business day following its onset. Similarly, the end of each shutdown is classified based on the first business day on which operations resumed, ensuring consistency in our measurement of shutdown durations.
Motivation
The motivation for examining government shutdowns as a potential signal for financial market behavior stems from their expected impact on corporate operations. During a shutdown, certain federal agencies suspend or limit their activities, which in turn can constrain the normal interactions between businesses and government bodies. For companies that rely on regulatory approvals, permits, or other governmental services, this slowdown can effectively increase operational costs and introduce delays in business processes. As a result, the anticipated profitability and overall valuation of affected firms may be negatively impacted. From a market perspective, these changes in fundamentals are likely to be reflected in stock prices, creating measurable shifts in asset values. By systematically studying these episodes, we aim to determine whether government shutdowns provide a consistent and actionable signal for investment strategies.
We intuitively expect a scenario similar to the following:
Assets and data
Initially, we planned to analyze a broad set of asset classes, including equities, bonds, currencies, gold, and commodities. However, after detailed examinations, we concluded that it is most meaningful to focus our study on equities and commodities.
Furthermore, to evaluate asset performance and assess statistical significance over time, we will employ our proprietary tool, 100yrs Portfolio Analysis. This tool allows us to simulate the historical development of a given asset over the past 100 years, providing a robust framework to analyze long-term behavior and generate insights on potential market signals associated with government shutdowns. For this reason, a portion of the data will be synthesized.
Results
For equities (SPY) and commodities (DBC), we examined windows ranging from five days before to five days after the start and end of each shutdown. Our observations are summarized in the following charts.
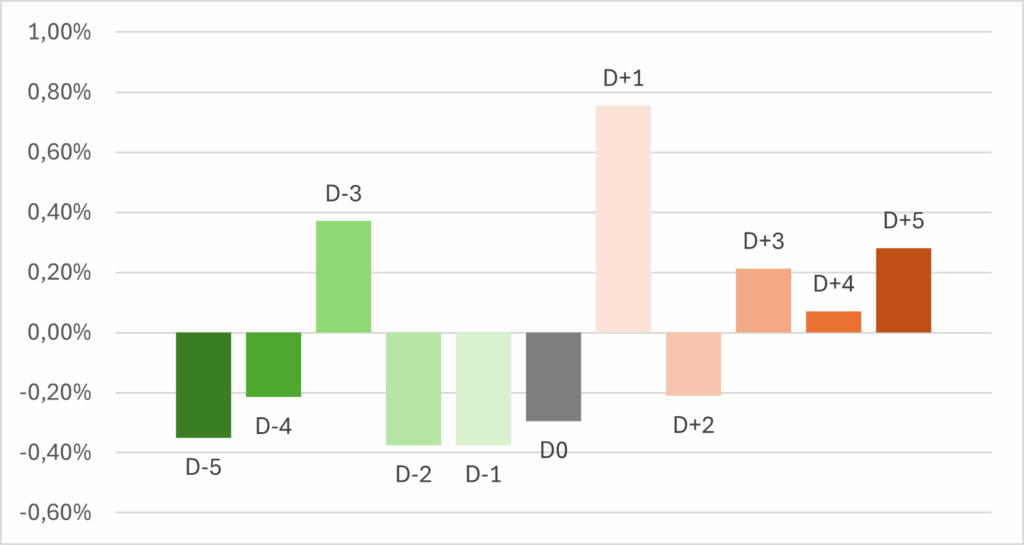
Table 1: P-values for tests of the statistical significance of daily deviations of SPY returns from the mean from 5 days before to 5 days after the start of a government shutdown.
| Event | D-5 | D-4 | D-3 | D-2 | D-1 | D0 | D+1 | D+2 | D+3 | D+4 | D+5 |
|---|---|---|---|---|---|---|---|---|---|---|---|
| Start | 0.262 | 0.616 | 0.202 | 0.050 | 0.338 | 0.383 | 0.162 | 0.457 | 0.455 | 0.927 | 0.334 |
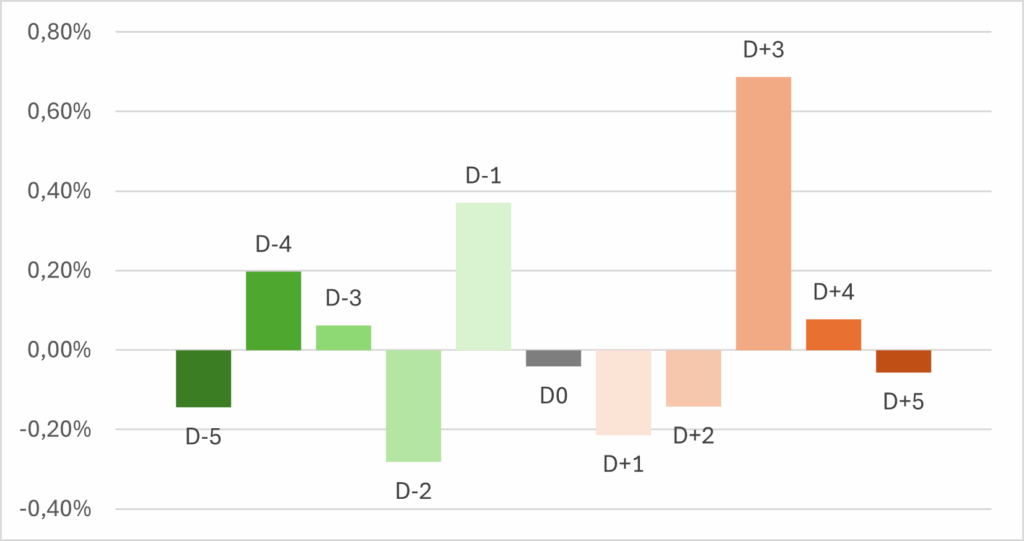
Table 2: P-values for tests of the statistical significance of daily deviations of SPY returns from the mean from 5 days before to 5 days after the end of a government shutdown.
| Event | D-5 | D-4 | D-3 | D-2 | D-1 | D0 | D+1 | D+2 | D+3 | D+4 | D+5 |
|---|---|---|---|---|---|---|---|---|---|---|---|
| End | 0.699 | 0.637 | 0.943 | 0.444 | 0.139 | 0.791 | 0.447 | 0.466 | 0.012 | 0.869 | 0.668 |
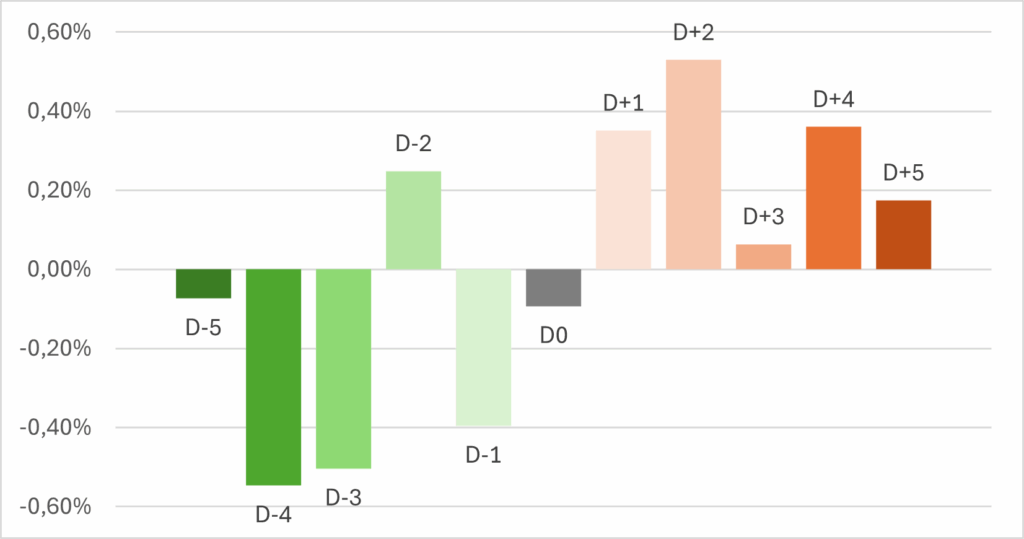
Table 3: P-values for tests of the statistical significance of daily deviations of DBC returns from the mean from 5 days before to 5 days after the start of a government shutdown.
| Event | D-5 | D-4 | D-3 | D-2 | D-1 | D0 | D+1 | D+2 | D+3 | D+4 | D+5 |
|---|---|---|---|---|---|---|---|---|---|---|---|
| Start | 0.656 | 0.183 | 0.309 | 0.711 | 0.016 | 0.677 | 0.298 | 0.095 | 0.939 | 0.397 | 0.420 |
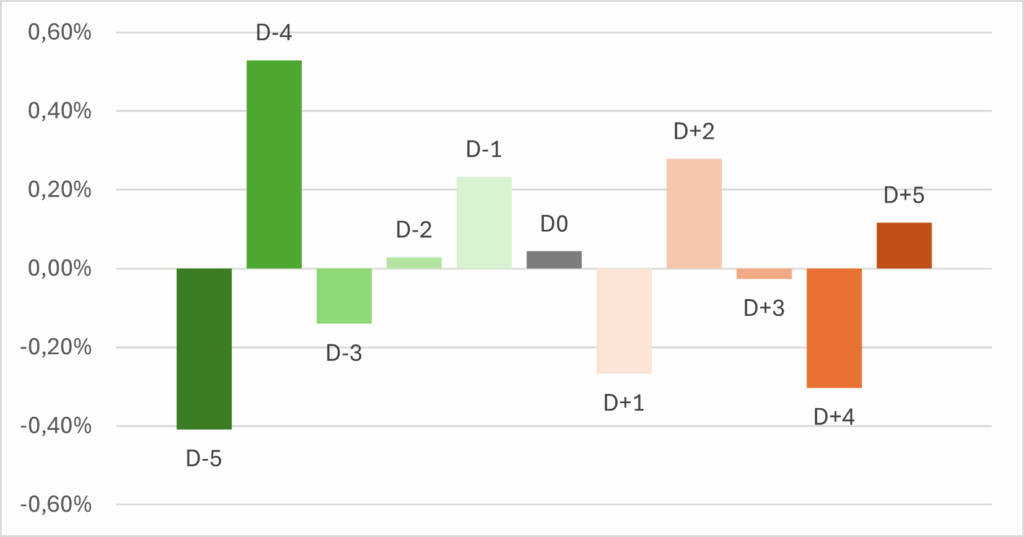
Table 4: P-values for tests of the statistical significance of daily deviations of DBC returns from the mean from 5 days before to 5 days after the end of a government shutdown.
| Event | D-5 | D-4 | D-3 | D-2 | D-1 | D0 | D+1 | D+2 | D+3 | D+4 | D+5 |
|---|---|---|---|---|---|---|---|---|---|---|---|
| End | 0.402 | 0.418 | 0.371 | 0.982 | 0.431 | 0.977 | 0.407 | 0.417 | 0.889 | 0.348 | 0.780 |
We observe two notable patterns. The first is a post-onset correction. For both asset classes, a strong up-day occurs on the day following the start of the shutdown. This behavior can be explained by the market’s adjustment process: when a shutdown begins, investors initially react to the immediate news, often anticipating the worst-case economic and operational disruptions. However, once more detailed information becomes available and the actual impact is assessed, market participants recognize that the situation may not be as severe as initially feared. This leads to a partial reversal of the initial reaction, manifesting as a correction in asset prices.
The second notable pattern is the pre-shutdown panic observed in both DBC and SPY. In the days leading up to a shutdown, we see a relatively consistent decline in prices. This behavior likely reflects market anticipations and risk aversion: investors, uncertain about the outcome of funding negotiations and potential disruptions to economic activity, adjust their positions in advance. Commodities and large cap stocks, being sensitive to broader economic and geopolitical risks, may experience selling pressure as participants seek to reduce exposure to perceived heightened uncertainty. This anticipatory behavior manifests as a gradual decline in prices prior to the official onset of the shutdown.
To assess whether these results carry any statistical significance, we compare the observed shutdown-related returns with returns drawn from the full 100-year simulated distribution of each asset. Because the variance of the underlying distribution is unknown, we rely on the sample variance from our simulations as an estimate. This allows us to conduct hypothesis testing at an appropriate significance level to evaluate whether the observed deviations from normal market conditions are meaningful.
Given that the current study is largely exploratory, we intentionally relaxed several formal statistical assumptions. Under this simplified framework, a few observations, specifically D–2 at the start of SPY and D–1 at the start of DBC, appear statistically significant at the 5% level. However, due to the large number of tests performed, these results are probably consistent with random Type I errors. In other words, we cannot confidently claim that these effects are truly significant.
While adjustment methods for multiple testing (such as Bonferroni or Šidák corrections) could be applied, we do not believe they would adequately address the core issue in this context. The combination of a relatively small sample of shutdown events and a large number of tested windows inherently limits the reliability of significance testing for these observations.
What else can go wrong?
A further limitation of our analysis is the inherently small sample size. The number of historical U.S. government shutdowns is very limited, and several of them occurred under economic conditions that differ substantially from today’s environment. With such a small dataset, statistical estimates become noisy, confidence intervals widen, and the power to detect meaningful effects is severely constrained. As a result, even patterns that appear visually consistent may lack the robustness needed for reliable inference.
Another challenge is the risk of forward-looking bias. Because we already know the exact dates and outcomes of past shutdowns, there is an unavoidable temptation, both consciously and unconsciously, to interpret market reactions using information that was not available to investors at the time. When the analysis relies on known historical endpoints, the risk arises that we implicitly condition on future events or evaluate patterns with hindsight. This can artificially strengthen perceived signals or exaggerate the consistency of observed market responses. Care must therefore be taken to structure the analysis so that only information available up to each event date is used when assessing market behavior.
Conclusion
Government shutdowns represent a distinct and highly visible type of political and operational disruption, and our analysis shows that they do have measurable effects on market behavior. Investor sentiment, risk perception, and short-term price dynamics all tend to shift in response to both the anticipation and the actual occurrence of a shutdown. These events can therefore appear, at first glance, to offer potential opportunities for tactical trading or short-horizon positioning.
However, harnessing shutdowns as a reliable source of excess return proves far more challenging. Their occurrence is irregular, their duration varies widely, and the economic context surrounding each episode differs substantially. The small number of historical shutdowns further limits statistical robustness, making it difficult to draw firm conclusions or construct strategies with sufficient confidence. Even patterns that seem intuitive or visually consistent often fail to remain significant once issues such as sample size, variance uncertainty, and multiple testing are taken into account.
We acknowledge that more sophisticated quantitative frameworks may be capable of extracting subtle signals from rare events like these. Such approaches, however, demand heavy assumptions and often struggle with interpretability, which undermines their practicality for investors seeking transparent and actionable rules.
If our objective is to design a simple, robust, and implementable strategy, government shutdowns do not appear to be the most suitable standalone indicator. Their rarity, unpredictability, and dependence on broader macroeconomic conditions make them an unreliable foundation for systematic decision-making. While shutdowns certainly influence markets, the evidence suggests that they are better viewed as contextual risk factors rather than as direct trading signals.
Author:
David Belobrad, Junior Quant Analyst, Quantpedia
Are you looking for more strategies to read about? Sign up for our newsletter or visit our Blog or Screener.
Do you want to learn more about Quantpedia Premium service? Check how Quantpedia works, our mission and Premium pricing offer.
Do you want to learn more about Quantpedia Pro service? Check its description, watch videos, review reporting capabilities and visit our pricing offer.
Do you want algorithmic access to the full Quantpedia database via the API? Subscribe to Quantpedia Pro, ask for an API key, and explore the in/out-of-sample statistics, source academic papers, and code snippets — ideal for quantitative research, systematic trading workflows, and AI model training.
Are you looking for historical data or backtesting platforms? Check our list of Algo Trading Discounts.
Or follow us on:
Facebook Group, Facebook Page, Telegram, Twitter, Linkedin, Medium or Youtube
Share onLinkedInTwitterFacebookRefer to a friend


