Community Alpha of QuantConnect – Part 1: Following numerous quantitative strategies
Introduction
Nowadays, social media are involved in fields that were unimaginable in the past. Among others, the world of finance, trading and investing is no exception. For example, Stocktwits is a strong community in this area, Seeking Alpha connects (non)professional analysts, and Twitter connects researchers, investors and traders as well. Quantitative based community is represented by the QuantConnect – Algorithmic Trading Platform, where quants can research, backtest and trade their systematic strategies. Additionally, similar to Seeking Alpha, there is a possibility to follow other quants/analysts through the open free market – Alpha Market.
The analysis sourced from Seeking Alpha was already researched by Farrell et al. (2020) and Dim (2021). The research suggests that there certainly is an added value, but it might not be wise to follow all analysts.
To our best knowledge, the literature on community/social media alpha is scarce, and this paper aims to fill this gap. In the first part, we evaluate the benchmark strategy that consists of all strategies in the alpha market that are equally weighted. Moreover, through multidimensional scaling and clustering analysis, we examine how well can significantly lower amount of strategies track the aforementioned benchmark. This could solve the problem of costly and inconvenient following of every strategy in the market. Overall, this approach can lead to a strategy that follows the benchmark with drastically reduced costs, and these strategies can be even more profitable and less volatile. This could be explained by reducing the dimensionality to only a few uncorrelated strategies, which in some sense could be understood as some sort of advanced portfolio construction method.
Note: This is Part 1 of a Four Part Series. Part 2 is available here, Part 3 is available here, and Part 4 is available here.
Data
The daily data were obtained from QuantConnect. The dataset is filtered to only out-of-sample live and deployed strategies and omits previous backtests to avoid the in-sample bias. The backtesting sample spans from April 2019 to May 2021. The number of strategies starts at 16 but grows rapidly to more than 200. Additionally, this number varies throughout the sample. Some strategies tend to be inactive for some time in the sample (they do not trade).
From maps to investable benchmark
One option of constructing an investable benchmark of many systematic strategies is surprisingly similar to creating a map when we only have the pairwise distances between cities.
Given the large set of strategies, investing equally in each strategy can be significantly costly and inefficient. The aim is to represent many strategies by only a few strategies that still represent the whole set. This is similar to a portfolio that wants to track the benchmark based on sampling. We solve this problem using pairwise correlations, from which we construct the dissimilarity matrix that we map to two-dimensional space. This dimensionality reduction of dissimilarity matrix has two benefits: implicitly preparing the clustering data, which we use to “sample” strategies and allows for interpretable visualizations. For dimensionality reduction, Multidimensional scaling is used. This multivariate analysis method is used to visualize (dis)similarity between objects. We would not dive deeper into the mathematics behind the method, and we would rather a classic example for the method’s usability from which we would get to the problem of benchmarks.
We start with creating a map having only pairwise distances that can be understood as a dissimilarity matrix. This example illustrates the reason why this method could be utilized in financial markets, and we will point to potential problems that can arise.
For our example, we utilize the dataset eurodist from R package cmdscale. The dataset includes 21 European cities and their distance. Using multidimensional scaling, we can create the map – visualize the cities such that the distances are preserved.
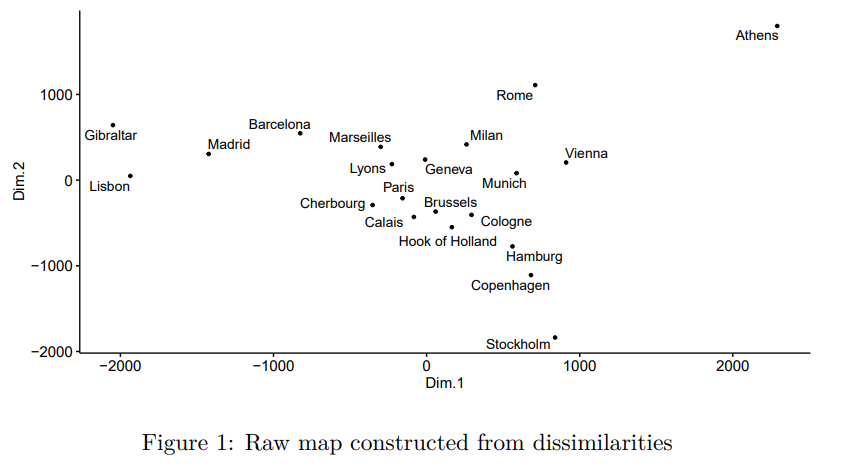
With a bit of imagination, the map is somewhat similar to the real one. The problem is that the south is reversed with the north – Stockholm can be a bit chilly and certainly is not in the Mediterranean area. The map also seems to be rotated in the wrong direction. Still, this does not mean that the method is bad – the method uses only distances. The dimensions Dim.1 and Dim.2 are not interpretable in the traditional way as we know the 2D map, but this is only a matter of rotation. Reversing “north” and “south”, and rotating the map by π/6 leads to a more believable map (the rotation is made by transforming the matrix by 2×2 rotation matrix that consists of sinus and cosine functions).
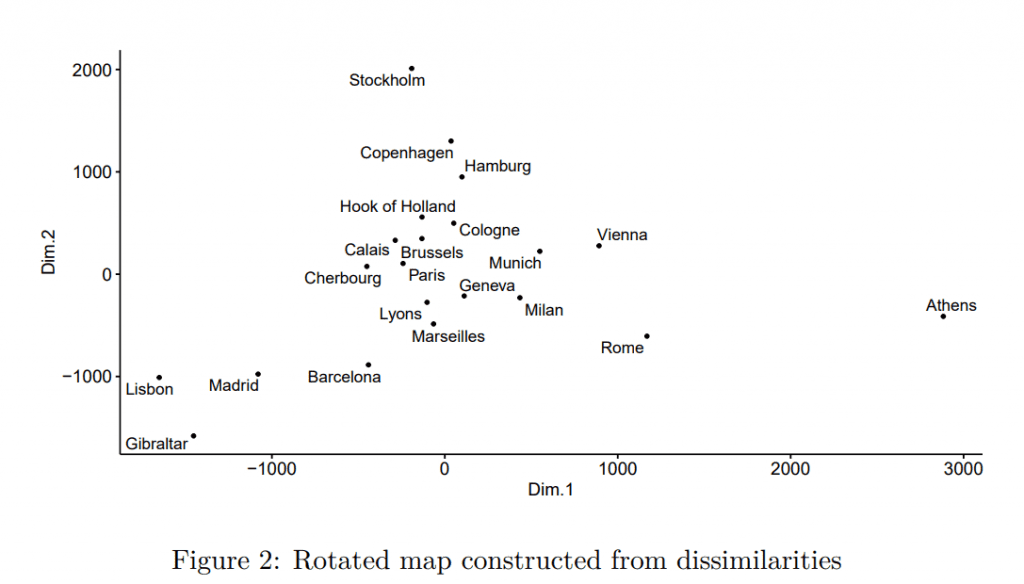
This map looks quite believable. With a practical understanding of multidimensional scaling, we can move to trading strategies. By now, it should be clear that if we would have some dissimilarity metric between strategies, we could make the “map”. We can visualize the strategies and see which are similar (related) and dissimilar (unrelated). Ideally, we would like to have a smaller set of investable strategies. Therefore, we would like to partition the set of strategies into smaller sets and ideally represent these smaller sets by only one strategy. In our European map, we would like to divide Europe into several regions and represent it by only one city. For example, Madrid could represent the Iberian Peninsula, Stockholm the Northern Europe, Athens as an outlier – south-east Europe etc.
Benchmark construction
For the purposes of the multidimensional scaling, we firstly define the dissimilarity matrix at time t by it´s i-th row and j-th column as:

where cor denotes the Spearman´s correlation, reti denotes the vector of returns for i-th strategy, and x is the lookback period.
Nextly, we perform the multidimensional scaling. This allows for visualizations as in the “maps” case, but most importantly, it reduces the dimension. As a result, each strategy is represented by two-dimensional points instead of return vectors. Throughout the paper, the x (lookback period) is equal to the 20 days.
The problem of the benchmark is caused by numerous strategies that QuantConnect’s Alpha market offers. On the one hand, it offers more possibilities, but it is inconvenient and costly to follow all strategies. We overcome this problem by clustering these strategies, which allows to represent all possible opportunities by only several clusters. Throughout the paper, we opt for the k-medoids method since it is simple, non-parametric and most importantly, each cluster is represented by the medoid – in our case, “the most central” strategy of the cluster. We aim to find clusters C1,…,Cl that minimize the following objective function:
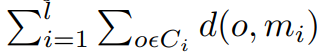
where mi is medoid that minimizes:

o represents objects in clusters, and d(i,j) is the dissimilarity of objects i and j. For the optimization, we utilize the golden standard – PAM method, and the dissimilarity is equal to the euclidean distances.
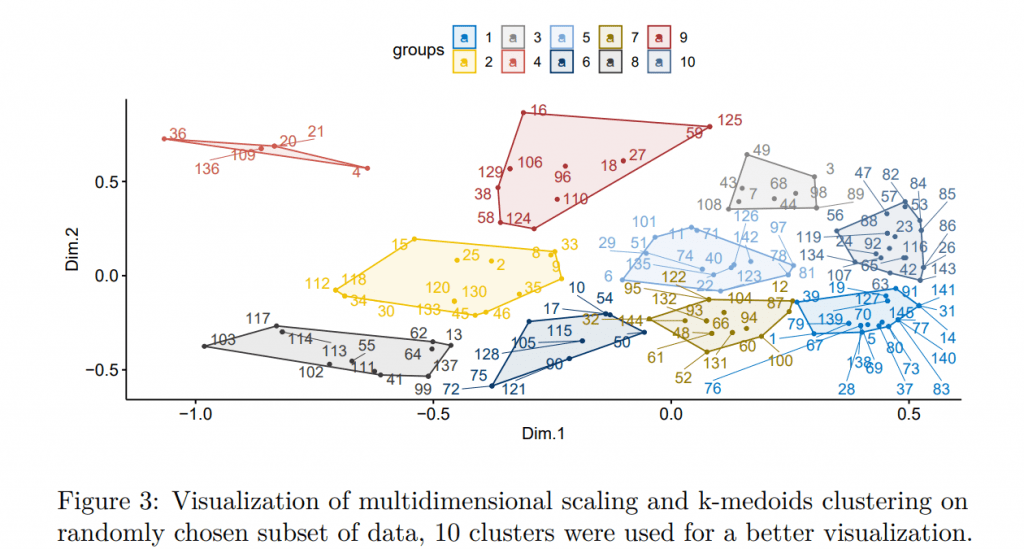
Thus, the clusters are directly investable, which would not be possible in the case of the k-means method, where the strategies are clustered around theoretical centroids. Another critical question is how to pick the “right” number of clusters. In the literature, many methods such as silhouette or scree plot were suggested. In our case, a larger amount of clusters should better track the original benchmark (1/N), and the same number of clusters as strategies would track it perfectly (it should converge to the benchmark with an increasing number of clusters). However, such an implementation could be costly and probably pointless. Since the number of desired strategies would be individual and based on available resources, we empirically study the increasing number of clusters and provide results in Table 1.
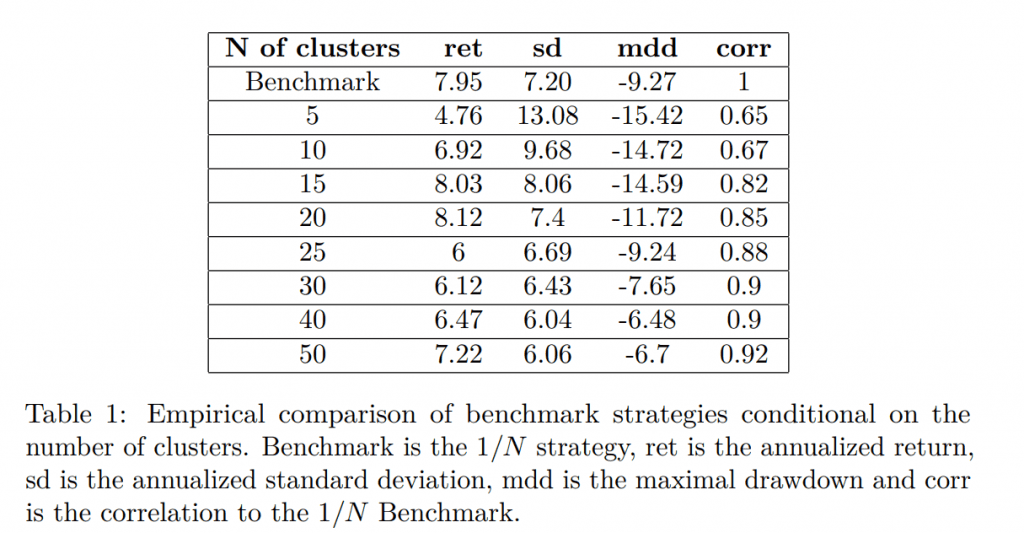
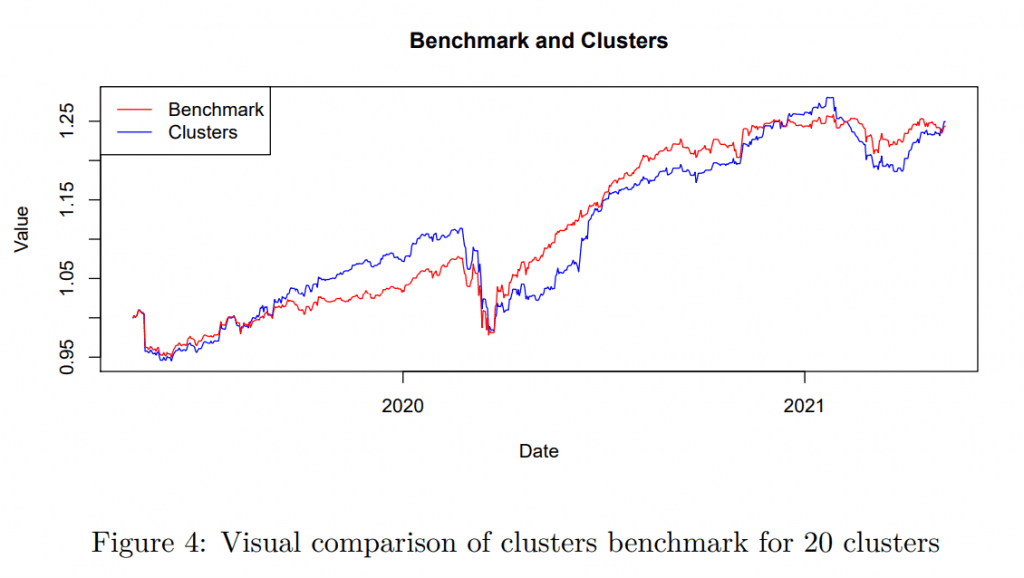
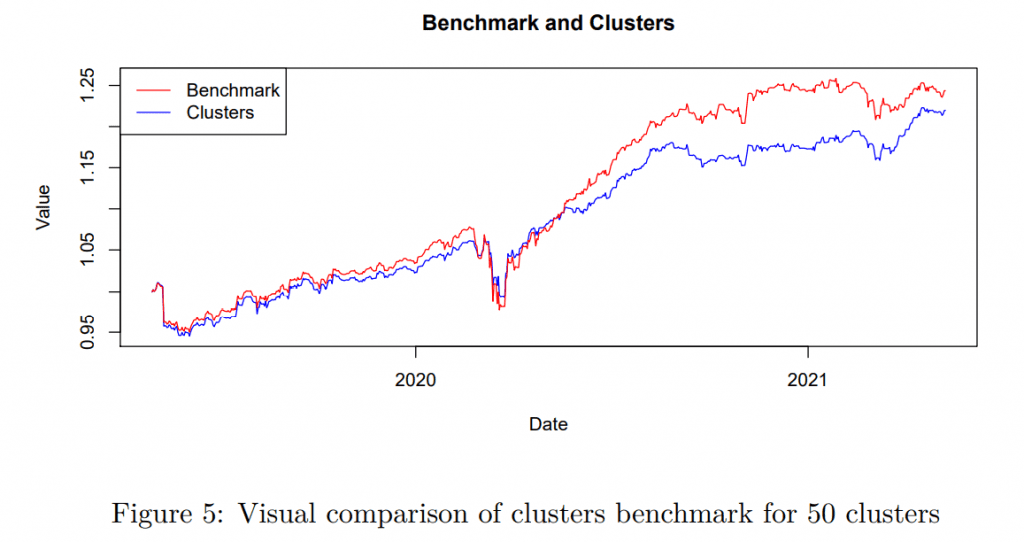
Obviously, using only a few clusters is detrimental to both benchmark tracking and performance. The strategies are not diversified enough. Interestingly, a larger amount of diversified (and by construction uncorrelated) clusters, represented only by one strategy, can perform fairly well, similar to the benchmark. There is a tradeoff between the number of strategies and the tracking abilities, but the results suggest that with a significantly lower number of strategies (and costs), we can track the community alpha reasonably well. Based on Figures 4 and 5 as the representative examples, there is a large comovement. We remark that the number of clusters can be lower if there are fewer strategies than the required number of clusters – in that case, the maximal possible number is used until there are enough strategies. However, this is only a minor and short-term problem at the beginning of the sample.
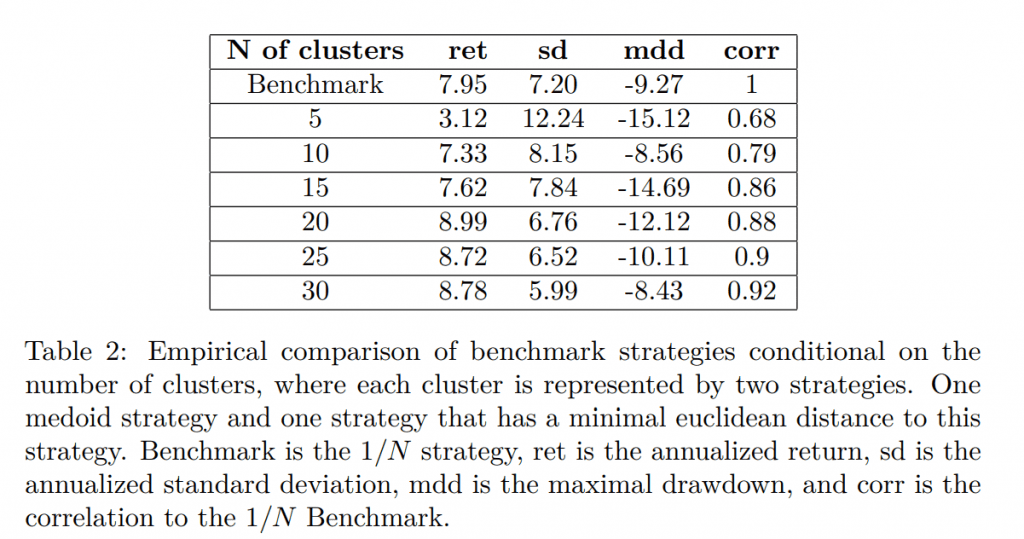
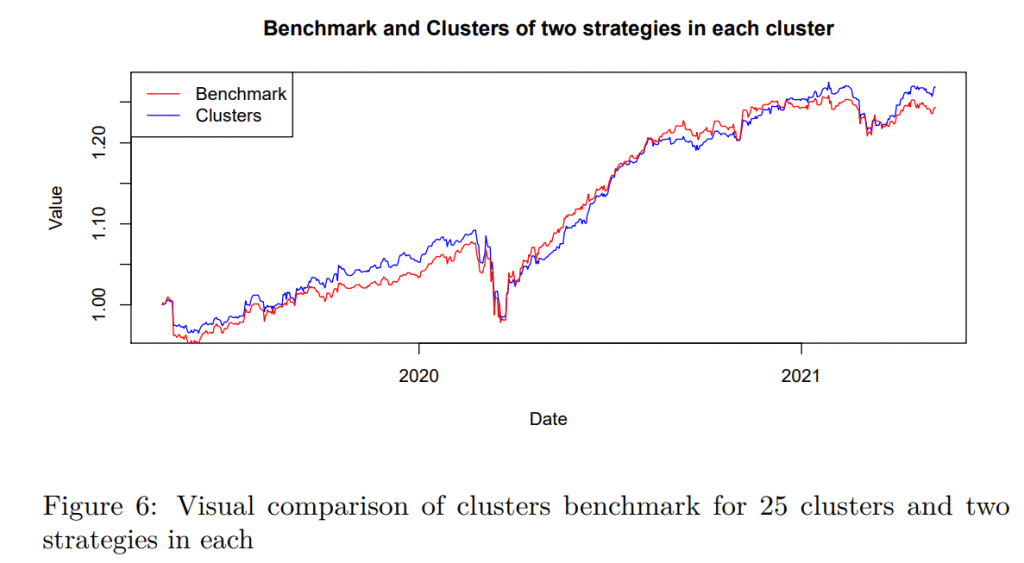
Furthermore, we explore additional version of the cluster benchmark. The reason is that one could easily argue that picking only one strategy (even though it is the most central one) is risky and undiversified. We overcome these concerns by including two strategies for each cluster, where the second strategy is chosen such that the euclidean distance to the medoid strategy is minimal. As a result, each cluster is represented by the two most central strategies. The shortened results are concluded in Table 2 and Figure 6 as a representative example. Interestingly, representing each cluster by two strategies (a more diversified approach) seems to track the benchmark better and can even outperform the benchmark based on return, but the edge is only small. However, the volatility is lower, resulting in better risk-adjusted-performance.
Short Conclusion
On average, the community alpha is quite profitable with low volatility and maximal drawdown, even though the coronavirus crisis is included in the sample. The only problem is the dimensionality – there are too many strategies, and their following can be significantly costly and inconvenient. We suggest reducing the dimensionality and finding the dissimilar strategies based on Spearman`s correlation through multidimensional scaling and clustering. This approach leads to investable clusters that represent the whole sample of strategies. Still, there is a need to include several clusters because the cluster strategies can be undiversified. However, with proper diversification among clusters, the cluster-based tracking strategy can be even more profitable in terms of risk-adjusted returns.
Stay tuned for the 2nd, 3rd and 4th part of this series, where we will step on the gas and explore factor meta-strategies built on top of the QuantConnect’s Alpha Market.
Author:
Matus Padysak, Senior Quant Analyst, Quantpedia
Are you looking for more strategies to read about? Sign up for our newsletter or visit our Blog or Screener.
Do you want to learn more about Quantpedia Premium service? Check how Quantpedia works, our mission and Premium pricing offer.
Do you want to learn more about Quantpedia Pro service? Check its description, watch videos, review reporting capabilities and visit our pricing offer.
Do you want algorithmic access to the full Quantpedia database via the API? Subscribe to Quantpedia Pro, ask for an API key, and explore the in/out-of-sample statistics, source academic papers, and code snippets — ideal for quantitative research, systematic trading workflows, and AI model training.
Are you looking for historical data or backtesting platforms? Check our list of Algo Trading Discounts.
Or follow us on:
Facebook Group, Facebook Page, Telegram, Twitter, Linkedin, Medium or Youtube
Share onLinkedInTwitterFacebookRefer to a friend


