Community Alpha of QuantConnect – Part 3: Adjusted Social Trading Factor Strategies
This blog post is the continuation of series about Quantconnect’s Alpha market strategies. Part 1 is here and Part 2 can be found here. This part is related to the factor strategies notoriously known from the majority of asset classes. We continue in the examination of factor strategies built on top of social trading strategies, but in this part, the investment universe is reduced based on the insights of the last part. So, without further ado, we continue where we have left last time.
In the previous section, we have established that extreme values of MIN, MAX and volatility predictors are connected with unfavourable performance. Therefore, we examine these predictors’ results when the most unfavourable quintile is omitted in each period. Results are in Table 5.
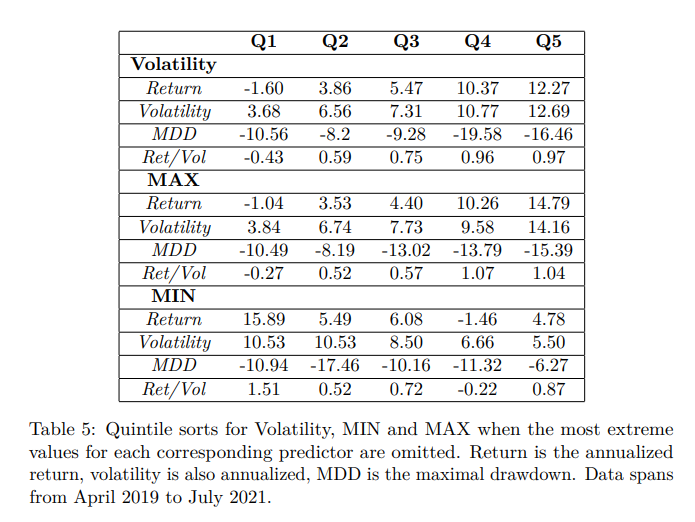
Clearly, omitting the unprofitable quintiles in single predictors helps the performance. However, how would the original predictors perform in a reduced investment universe based on extreme values of MIN, MAX or volatility each month? Secondly, how should we reduce the investment universe? There are two options; we either remove the strategy if it is in at least one of the extreme quintiles, or we remove the strategy only if it is in the extreme quintile of MIN, MAX and volatility at the same time.
We firstly examine all the predictors again when the strategy is excluded if it falls into one of the extreme quintiles, and we present the results in Table 6. Secondly, predictors are examined when the strategy is excluded if it falls into MIN, MAX and volatility extreme quintile at the same time. Finally, the results are presented in Table 7.

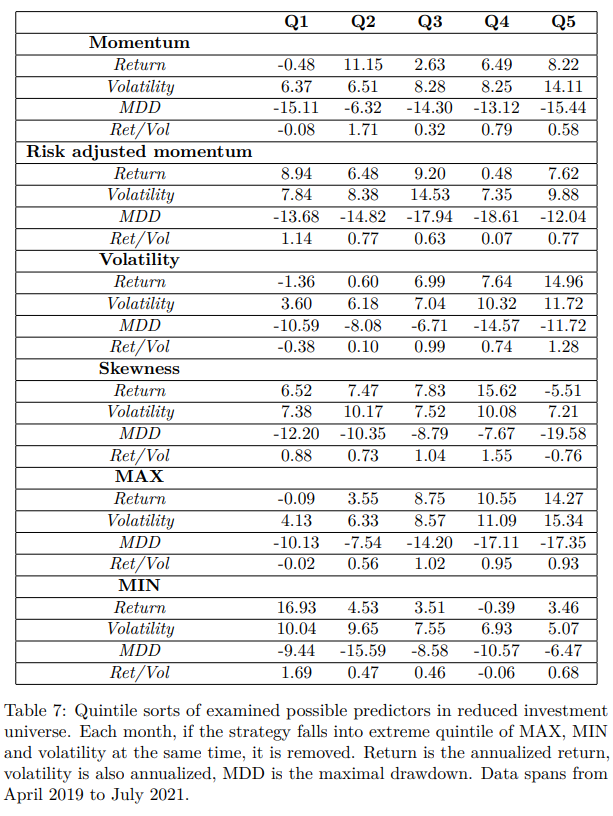
Focusing on the reduced samples, the momentum and risk-adjusted momentum predictors seem to be inconclusive. For momentum, the worst quintile underperforms others, but the performance of the second quintile is much better than that of the fifth quintile. It seems that there is “almost reversal”. The strategies that have performed the worst continue in doing so, but the ones in the second-worst quintile outperform others. For the risk-adjusted momentum, the performance of Q5 is stronger in both samples, but there also seems to be a reversal in Q1/Q2. The skewness stays the same – it indicates that omitting extremes and going long strategies in the middle would be profitable. The reduced investment universe seems to work even better regarding the most promising predictors so far – MIN, MAX and volatility. Overall, it appears that excluding strategies only if they fall into the extreme quintile of the MIN, MAX and volatility at the same time would be a better option.
To sum it up, momentum results seem to be mixed, and the performance does not rise from the worst quintile to the best quintile. Instead, more satisfying results are provided by variables that characterize the return distributions: skewness, volatility, MIN and MAX.
Stay tuned for the last part, which examines the combined/composite factor strategies based on the social alpha in the QuantConnect’s Alpha Market!
Author:
Matus Padysak, Senior Quant Analyst, Quantpedia
Are you looking for more strategies to read about? Sign up for our newsletter or visit our Blog or Screener.
Do you want to learn more about Quantpedia Premium service? Check how Quantpedia works, our mission and Premium pricing offer.
Do you want to learn more about Quantpedia Pro service? Check its description, watch videos, review reporting capabilities and visit our pricing offer.
Do you want algorithmic access to the full Quantpedia database via the API? Subscribe to Quantpedia Pro, ask for an API key, and explore the in/out-of-sample statistics, source academic papers, and code snippets — ideal for quantitative research, systematic trading workflows, and AI model training.
Are you looking for historical data or backtesting platforms? Check our list of Algo Trading Discounts.
Or follow us on:
Facebook Group, Facebook Page, Telegram, Twitter, Linkedin, Medium or Youtube
Share onLinkedInTwitterFacebookRefer to a friend


