Community Alpha of QuantConnect – Part 4: Composite Social Trading Multi-Factor Strategy
This blog post is the continuation (and finale) of series about Quantconnect’s AlphaMarket strategies. This part is related to the multi-factor strategies notoriously known from the majority of asset classes. We continue in the examination of factor strategies built on top of social trading strategies, but the investment universe is reduced based on the insights of the previous part. So, without further ado, we continue where we have left last time.
The previous results have established that MIN, MAX, and volatility can be used as predictors of subsequent performance of alpha strategies. Numerous research papers have identified that the several factors/styles used in a composite strategy perform better than an individual block (e.g., Rad et al. (2021)). Are these results also applicable in the alpha strategy universe?
Ideally, to diversify, assets should have a low correlation. Therefore, it is crucial to establish the correlation among strategies to identify any diversifying potential.
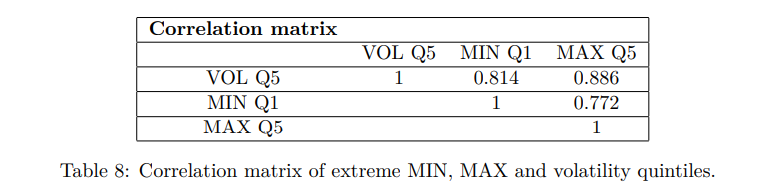
Unfortunately, the correlation among deciles is high, and our expectations of exciting multi-factor strategies should be modest. Despite the correlations, we perform multi-factor sorts to examine the performance or outline the possible approach that could be exploited in the future. The reason is that with the expansion of the alpha market and an increasing number of available strategies, the investment universe can exhibit greater variation that could be translated into more significant variations in factors.
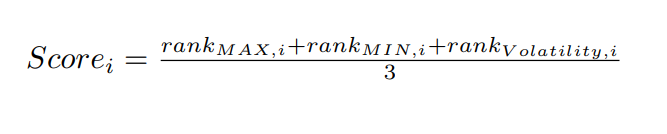
Every 20 days, alpha strategies in the reduced investment universe (if the strategy falls into the extreme quintile of MAX, MIN, and volatility at the same time, it is removed) are individually ranked based on each predictor. The values are multiplied by minus one for the MIN effect to ensure that the lowest MIN values get the highest ranks. The composite score for each alpha strategy i , based on the previous twenty days, is defined as follows:
In portfolio sorts, alphas are sorted into quintiles based on their composite score, and equally-weighted positions are held for subsequent 20 days. For comparison, we also examine the equally-weighted strategy of MIN, MAX, and Volatility predictors from Table 7: Q1 of MIN, Q5 of MAX, and Q5 of Volatility, and also the individual predictors with corresponding quintiles mentioned above. Results are summarized in Table 9.
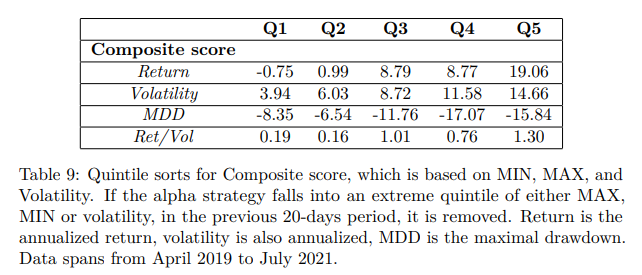
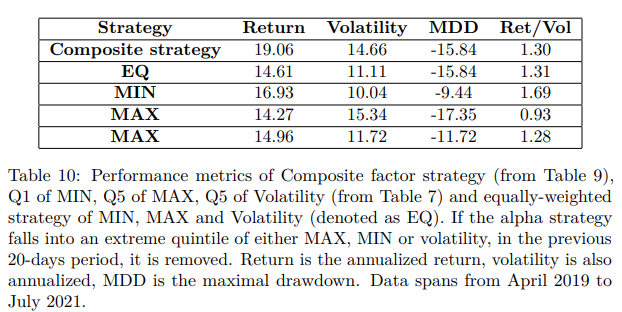
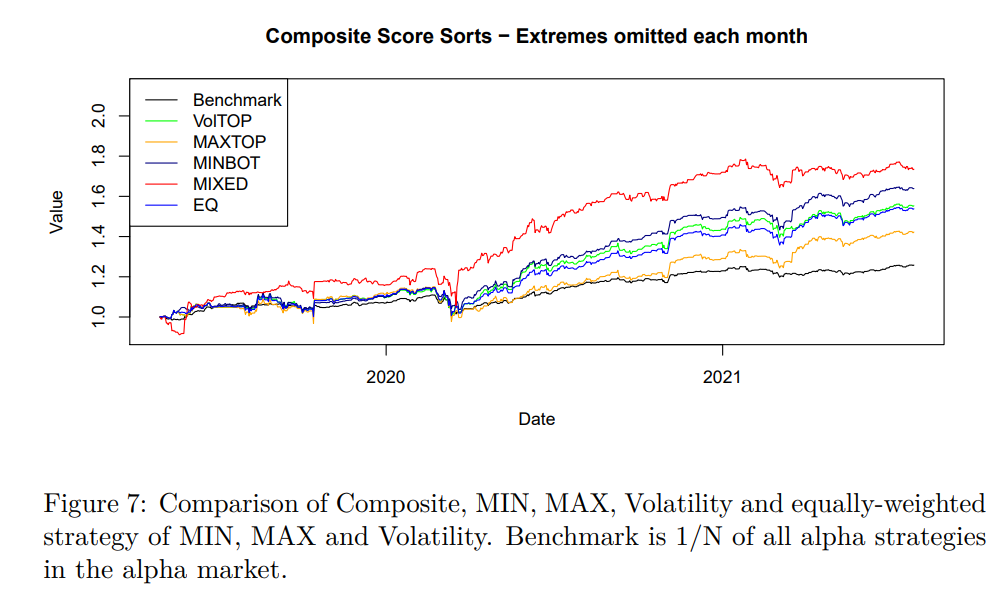
Although the return of the multi-factor strategy is the highest in the sample, the risk-adjusted return is lower than that of the MIN strategy, and the maximal drawdown is higher. Still, the multi-factor strategy based on composite rank is a better alternative to equally-weighting individual strategies. In summary, the backtesting sample is relatively short, and there certainly could be a potential in the multi-factor approach, but the differences in backtests are inconclusive. Therefore, a multi-factor or single-factor strategy could be viewed as an individual choice based on risk or return preferences.
Conclusion of the Social Trading Factor Strategies
Albeit the data sample is short (at least for now), the alpha market strategies dataset is full of exciting research opportunities. In Part 1, we have established how to follow the benchmark of these strategies since the 1/N implementation can be rather costly and impractical. We believe that you have found the methodology based on multidimensional scaling and k-medoids clustering compelling, and it might even be an inspiration in different asset classes.
In Part 2, we examined well-known predictors from other well-established asset classes. All predictors are return-based since some fundamental data is tough to obtain for alpha strategies. Nevertheless, the results are pretty intriguing. The alpha market is one of the few investment universes where the momentum does not seem to exist. Interestingly, there is also no factor momentum among MIN, MAX, and Volatility strategies. Weighting the individual strategies in composite strategy (in Part 4) based on their past momentum was worse than 1/N. The skewness effect that is gaining attention in recent times does not seem to have the same predictive power as in other classes. However, other characteristics of distribution such as volatility, MIN, and MAX daily return seem to predict in a way that is the exact opposite as in other asset classes. Alpha strategies tend to reward for the risk (volatility). The high MAX predicts the subsequent returns positively. The strategy with the lowest minimal returns tends to pleasantly surprise in the following period with economically significant positive returns.
The second part has also shown that when the distribution characteristics get too extreme (too volatile or daily returns are too low/high), the subsequent return is suboptimal compared to other quintiles. Therefore, in Part 3, we suggested reducing the investment universe and omitting the “outliers”. The results significantly improved.
Lastly, in Part 4, we have examined multi-factor strategies. The results are somewhat inconclusive for the moment, but we are keen to reexamine all the strategies based on the social alpha in QuantConnect’s Alpha Market “year after,” which could be an ideal out-of-sample test. We will certainly share the results, so stay tuned in.
Author:
Matus Padysak, Senior Quant Analyst, Quantpedia
Are you looking for more strategies to read about? Sign up for our newsletter or visit our Blog or Screener.
Do you want to learn more about Quantpedia Premium service? Check how Quantpedia works, our mission and Premium pricing offer.
Do you want to learn more about Quantpedia Pro service? Check its description, watch videos, review reporting capabilities and visit our pricing offer.
Do you want algorithmic access to the full Quantpedia database via the API? Subscribe to Quantpedia Pro, ask for an API key, and explore the in/out-of-sample statistics, source academic papers, and code snippets — ideal for quantitative research, systematic trading workflows, and AI model training.
Are you looking for historical data or backtesting platforms? Check our list of Algo Trading Discounts.
Or follow us on:
Facebook Group, Facebook Page, Telegram, Twitter, Linkedin, Medium or Youtube
Share onLinkedInTwitterFacebookRefer to a friend


