Cyber Risk and the Cross-Section of Stock Returns
In today’s fast world, where information flows freely and transactions happen at the speed of light, the significance of cybersecurity cannot be overstated. But it’s no longer just a concern for IT professionals or tech enthusiasts. The specter of well-documented hacks and phishing incidents casts a long shadow over investors, acting as powerful illustrations of how security breaches, vulnerabilities, and cyber threats can reverberate through financial markets. In this blog post, we’ll delve into the intricate relationship between cybersecurity risk and stock performance, uncovering how these digital hazards can influence financial markets.
Celeny and Maréchal (2023) paper presents a cyber risk measure implemented by a doc2vec model to estimate firms’ cyber risk based on their 10-K statements and then use this in various asset pricing tests. The results support the view that cyber risk is priced in the cross-section of stock returns. Indeed, a long-short strategy on cyber risk sorted portfolios has an economically significant alpha compared to traditional factor models and an average monthly excess return of 0.56% .Cyber risk captures a variation in average returns by controlling for market beta, firm size, and book-to-market value, and Fama-Macbeth regressions prove cyber risk has a significant premium: cyber risk factor helps to price stocks and is present in the five most likely factor models. Hence, the authors recommend that firms incorporate all available information about cyber risk in their newest 10-K statement. Interactions of cyber risk with the other sources of risks are also investigated by performing double sorts.
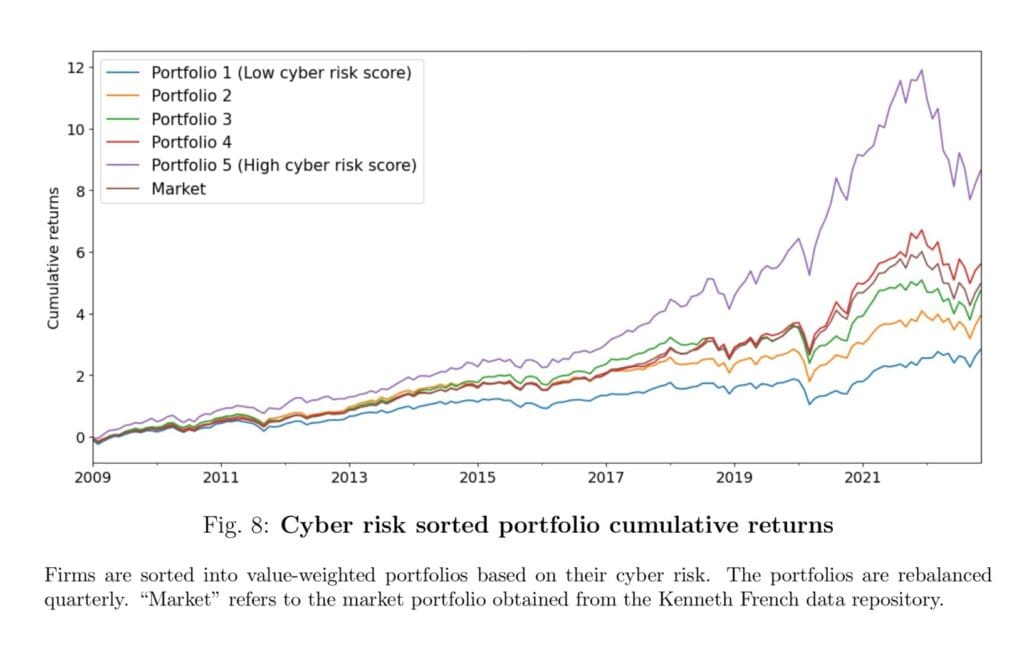
We would like to highlight Figure 8, which shows the evolution of the cumulative returns of the market and the five portfolios. You can observe that the higher the cyber risk of the portfolio, the higher the cumulative returns, and Portfolio 5 significantly outperforms the market, even if at the cost of higher risk.
Authors: Daniel Celeny and Loïc Maréchal
Title: Cyber risk and the cross-section of stock returns
Link: https://papers.ssrn.com/sol3/papers.cfm?abstract_id=4587993
Abstract:
We extract firms’ cyber risk with a machine learning algorithm measuring the proximity between their disclosures and a dedicated cyber corpus. Our approach outperforms dictionary methods, uses full disclosure and not only dedicated sections, and generates a cyber risk measure uncorrelated with other firms’ characteristics. We find that a portfolio of US-listed stocks in the high cyber risk quantile generates an excess return of 18.72% p.a. Moreover, a long-short cyber risk portfolio has a significant and positive risk premium of 6.93% p.a., robust to all factors’ benchmarks. Finally, using a Bayesian asset pricing method, we show that our cyber risk factor is the essential feature that allows any multi-factor model to price the cross-section of stock returns.
As always, we present several interesting figures and tables:
Notable quotations from the academic research paper:
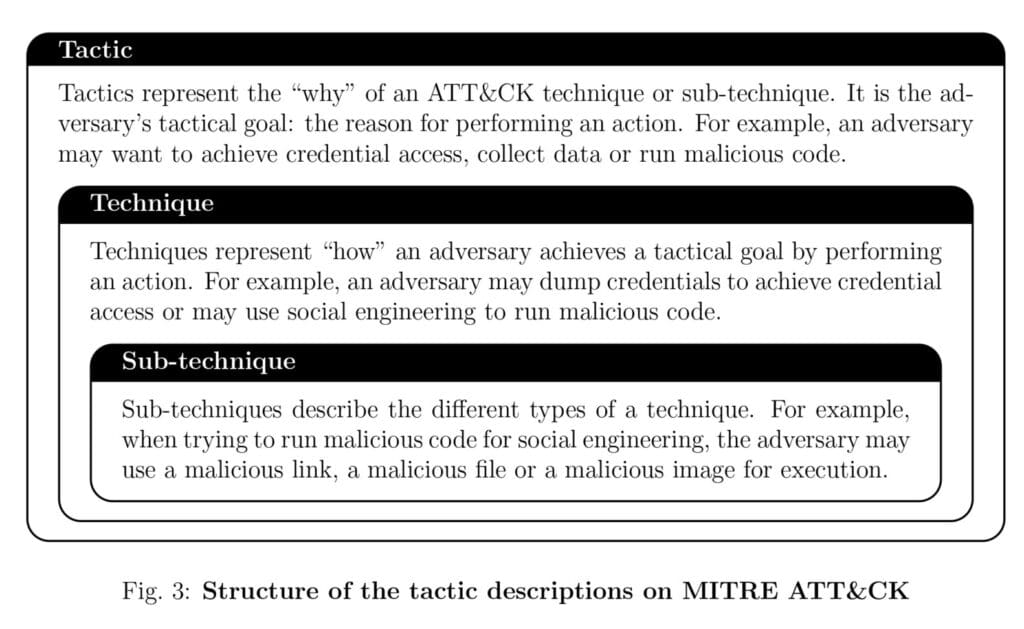
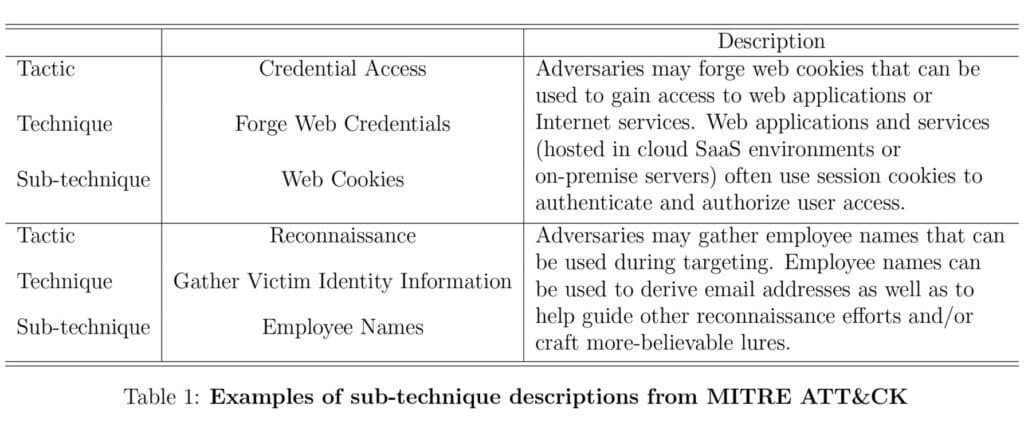
“In this paper, we develop a method to quantify the cyber risk of a company based on its disclosures and investigate whether this risk is costly to firms in the form of a market risk premium that shows up in their stock returns. To do this, we collect financial fillings, monthly returns, and other firm characteristics for over 7,000 firms listed on US stock markets between January 2007 and December 2022. We use a machine learning algorithm, the “Paragraph Vector”, in combination with the MITRE ATT&CK cybersecurity knowledgebase to score each firm’s filing based on its cybersecurity content.
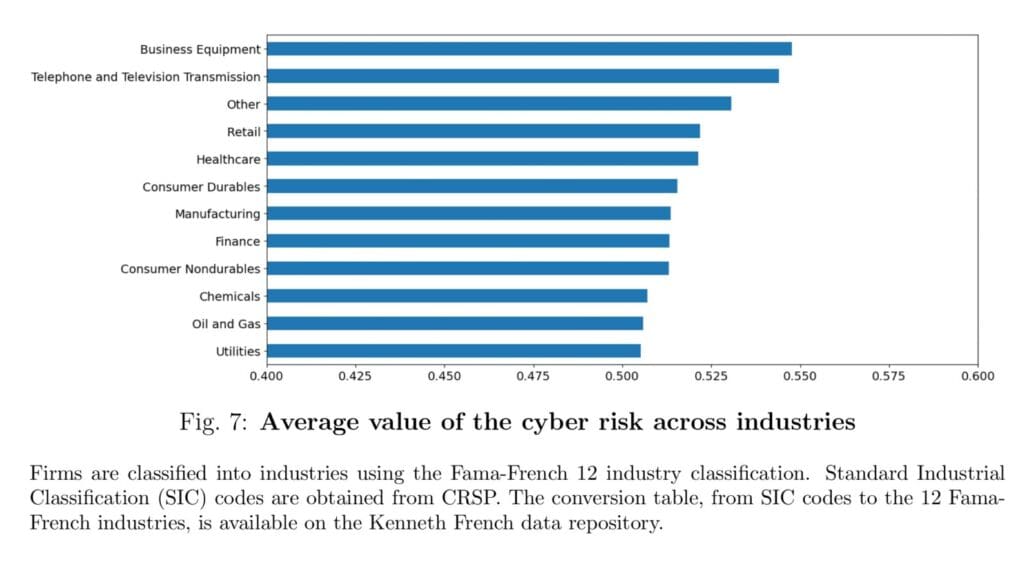
We find evidence that our cyber risk does not correlate with firm size, book-to-market, beta, and other standard firms’ characteristics known to help price stock returns. At the aggregated level, our measure shows a monotonic increasing trend, with a score moving from 0.51 to 0.54 out of one, whereas the cross-sectional distribution of that score is exceptionally narrow (standard deviation of 0.03). We compare our cyber risk measure across Fama-French 12 industries and find results supporting our intuition, with “Business Equipment” and “Telephone and Television Transmission” being the riskiest and “Oil and Gas” and “Utilities”, the safest.
We find that the cyber risk sorted long-short portfolio, which invests in high cyber risk stocks and shorts low cyber risk stocks, has an average annual excess return of 6.93% and is statistically significant at the 10 or 5% level even when controlling for common risk factors. This portfolio performs particularly well before the first mention of a cyber risk premium on SSRN in November 2020 by Florackis et al. (2023), with an average annual excess return of 11.88%, and is statistically significant at the 1% level. Double sorts confirm that cyber risk captures a variation in stock returns when controlling for other factors.
We use asset pricing tests and find that the cyber risk exposure generates a significant premium after controlling for market beta, book-to-market, size, momentum, operating profitability, and investment aggressiveness (see Fama and French, 2015). This performance shows up both in cross-section, with Fama and MacBeth (1973) regressions, and time series, with no significant joint alphas in Gibbons, Ross, and Shanken (1989) tests. Using the Bayesian approach of Barillas and Shanken (2018), we show that the optimal subset of factors pricing stock returns always includes our cyber risk factor.
The cyber risk score is based on the cosine similarities with the cybersecurity descriptions from MITRE ATT&CK. First, we compute the vector representation of every paragraph of every 10-K statement using the trained doc2vec model. We also compute the vector representation of every sub-technique description from MITRE ATT&CK. Next, we compute the cosine similarity of each paragraph from the 10-K statements with each of the MITRE descriptions. This gives 785 similarities for each paragraph from the 10-K statements. The cyber risk score of a paragraph is the maximum value out of those 785 similarities. Finally, we compute the score of a 10-K statement as the average score of the 1% of its highest-scoring paragraphs.
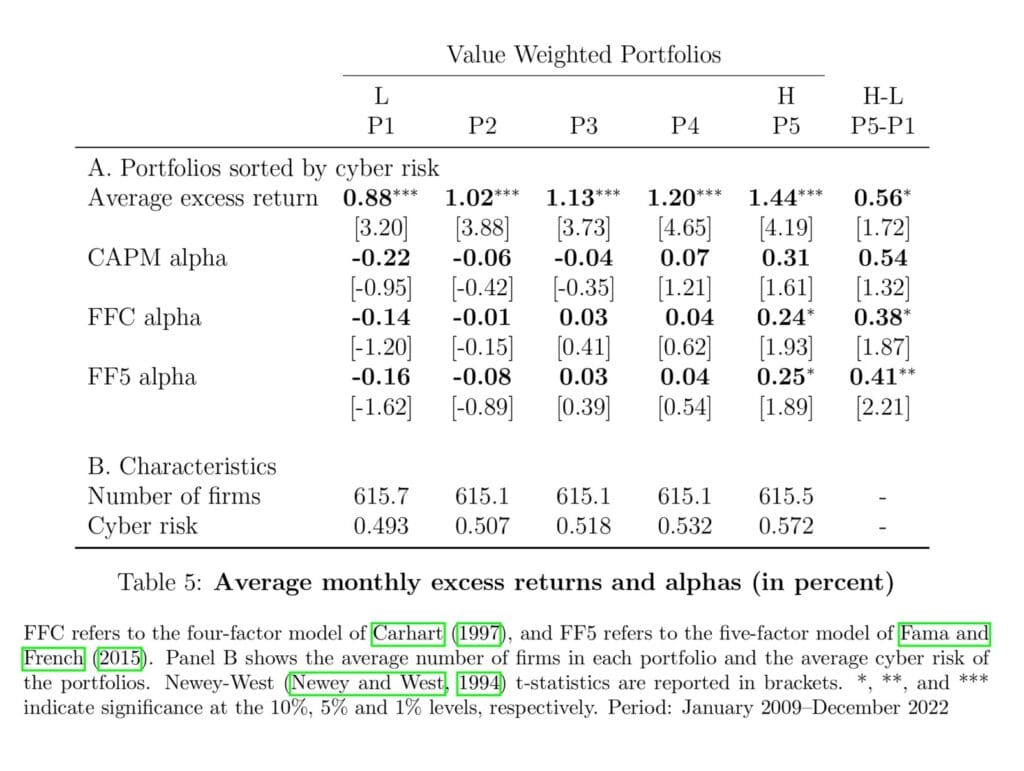
Table 5 presents the excess returns and alphas of the portfolios with respect to three standard factor models. The average monthly excess returns increase monotonically from 0.88% to 1.44%, from low to high cyber risk portfolios. The long-short portfolio, going long in Portfolio 5 and short in Portfolio 1, has excess returns and alphas that are statistically significant, even when controlling for the Fama and French (2015) five-factor model.”
Are you looking for more strategies to read about? Sign up for our newsletter or visit our Blog or Screener.
Do you want to learn more about Quantpedia Premium service? Check how Quantpedia works, our mission and Premium pricing offer.
Do you want to learn more about Quantpedia Pro service? Check its description, watch videos, review reporting capabilities and visit our pricing offer.
Do you want algorithmic access to the full Quantpedia database via the API? Subscribe to Quantpedia Pro, ask for an API key, and explore the in/out-of-sample statistics, source academic papers, and code snippets — ideal for quantitative research, systematic trading workflows, and AI model training.
Are you looking for historical data or backtesting platforms? Check our list of Algo Trading Discounts.
Or follow us on:
Facebook Group, Facebook Page, Telegram, Twitter, Linkedin, Medium or Youtube
Share onLinkedInTwitterFacebookRefer to a friend


