Dissecting the Performance of Low Volatility Investing
Low volatility investing is an appealing approach to compound wealth in the stock market for the long term. This particular factor investing style exploits the popular naive notion that lower (higher) risk must always equal lower (higher) overall returns. But in fact, this naive assumption is not true, as low-volatility investments often yield more than their high-volatility counterparts. While low-volatility investing has many advantages, it also results in some disadvantages. How to overcome them? Bernhard Breloer, Martin Kolrep, Thorsten Paarmann, and Viorel Roscovan, in their study Dissecting the Performance of Low Volatility Investing, propose a solution.
Low volatility strategies can reduce total risk and thus enhance a portfolio’s risk-adjusted return. The risk reduction comes mostly through asset allocation, whereas return enhancement comes through exposure to the low volatility anomaly – both are inherent parts of low-volatility investing. The active return of a low-volatility portfolio can be decomposed into the low-volatility anomaly and an allocation effect. The low volatility anomaly potentially delivers positive performance during bull and bear markets. On the other hand, the allocation effect is a function of market performance and will drag down performance if there is a positive market drift.
In the long run, the return of the low volatility anomaly can outweigh the drag of the allocation effect with more than 60% likelihood over a one-year period. Authors of the paper propose a solution – we can leverage a low-volatility portfolio to avoid the allocation effect and purely invest in the low-volatility anomaly,
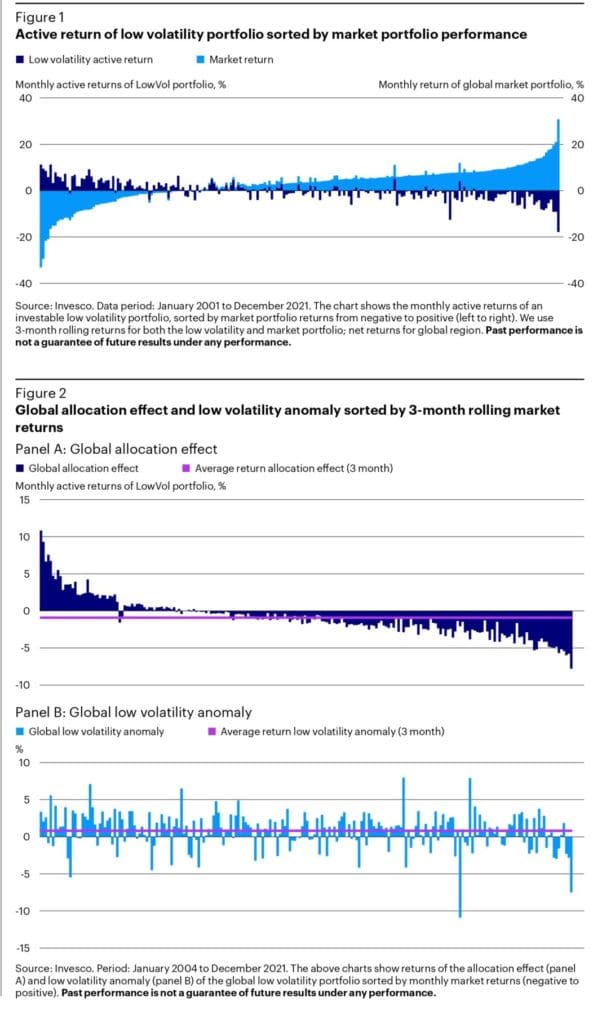
Figure 1 shows the active 3-month return of a global low-volatility portfolio, sorted by market returns. We can observe a(n) (a)symmetrical performance pattern – higher active returns in downward markets, with the tendency to lag in more bullish environments. Figure 2 shows the returns of the two return components: The allocation effect follows a pattern (panel A), while the low volatility anomaly outperforms independent of the market environment (panel B). Accordingly, the long-term return contribution of the low volatility anomaly is positive – yielding 28 bps per month.
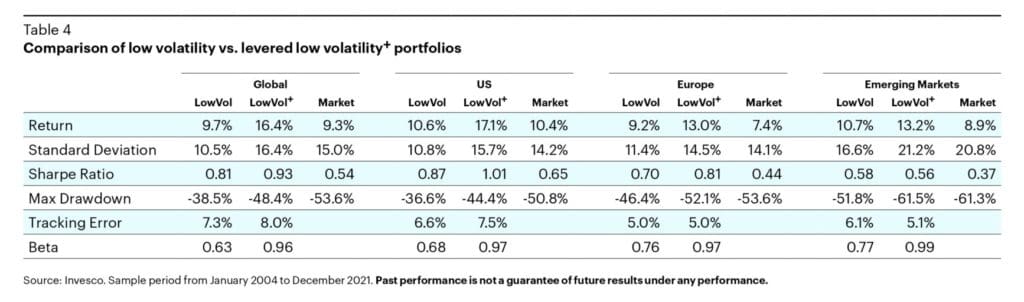
Having examined the drivers of the low-volatility portfolio, the question is how to circumvent the performance drag of the allocation effect while still profiting from the low-volatility anomaly. Once we are willing to give up protection and have access to leverage via equity futures, we can lever up a low volatility portfolio to the market risk level (beta = 1) and expect higher participation in up markets. Such a portfolio should exhibit higher expected returns at the cost of increased volatility, leverage, and market-equivalent drawdowns, as shown in Table 4.
Title: Dissecting the Performance of Low Volatility Investing
Authors: Bernhard Breloer, Martin Kolrep, Thorsten Paarmann, and Viorel Roscovan
Link: https://papers.ssrn.com/sol3/papers.cfm?abstract_id=4432075
Abstract:
A low volatility portfolio aims to exploit the fact that, in the long run, low-risk stocks yield higher risk-adjusted returns than higher-risk stocks. But the low volatility portfolio’s lower beta – via the allocation effect – may drag down returns at times. We dissect the performance into the low volatility anomaly and the allocation effect, analyze the relative importance of the two and show ways to minimize the allocation effect’s drag on performance.
As always, we present several exciting figures and tables:
Notable quotations from the academic research paper:
“Equation (2) suggests that, to earn the low volatility anomaly, the market portfolio needs to be levered down to the risk level of the low volatility portfolio by allocating a portion to the risk-free rate. […] The low volatility anomaly is thus the excess return earned against the market, adjusted to the risk level of the low volatility portfolio.
In the sample period, our low volatility portfolios have outperformed the market even before risk adjustment, delivering between 100 and 300 bps of excess returns on average per year, depending on the region. However, splitting the full observation period into three 7-year sub-periods reveals that the performance of low volatility portfolios differs significantly throughout the last two decades (see table 2). In the first two periods, from January 2001 to December 2007 (panel A) and January 2008 to December 2014 (panel B), low volatility portfolios delivered above market returns. Note that expecting market-like returns on average requires, by default, accepting some periods of returns below market, as we observe for the last sub-period from January 2015 to December 2021 (panel C) for most portfolios. Still, all portfolios, except for the US, show higher Sharpe ratios than the market. In summary, the performance of low volatility portfolios can vary over time. Thus, the weaker performance in recent years should be seen neither as an indicator of future returns nor as evidence for the low volatility premium having broken down.2
Low volatility strategies have performed below their long-term trend in recent years. Most of the time, the low volatility anomaly did not outweigh the negative impact of the allocation effect in strongly up-trending markets. Hence, we could ask what the breakeven return is that the low volatility anomaly must achieve to cope with the market return? To answer this, we look at the historical returns of the low volatility anomaly and calculate, for each region, the required return to compensate for the allocation effect. We consider three different time periods that impose different market premiums as well as betas of the low volatility portfolios against the market.5”
Are you looking for more strategies to read about? Sign up for our newsletter or visit our Blog or Screener.
Do you want to learn more about Quantpedia Premium service? Check how Quantpedia works, our mission and Premium pricing offer.
Do you want to learn more about Quantpedia Pro service? Check its description, watch videos, review reporting capabilities and visit our pricing offer.
Do you want algorithmic access to the full Quantpedia database via the API? Subscribe to Quantpedia Pro, ask for an API key, and explore the in/out-of-sample statistics, source academic papers, and code snippets — ideal for quantitative research, systematic trading workflows, and AI model training.
Are you looking for historical data or backtesting platforms? Check our list of Algo Trading Discounts.
Or follow us on:
Facebook Group, Facebook Page, Telegram, Twitter, Linkedin, Medium or Youtube
Share onLinkedInTwitterFacebookRefer to a friend


