Estimating Stocks-Bonds Correlation from Long-Term Data
There are a few concepts in the world of finance that are taken for granted, and one of them is the free lunch of diversification. Investors like to mix stocks and bonds into a simple allocation portfolio and hope for better outcomes than investing in just one asset. But the favorable return-to-risk profile of those asset allocation strategies relies on the low correlation between those two asset classes, which, as we will see from today’s contribution, we can’t take for granted. We hope the recent study sheds more light on this topic.
Molenaar, Senechal, Swinkels, and Wang (Jul 2023) examine the empirical relationship between stock and bond returns, using deep historical data from 1875 with various monetary regimes for various countries. Over the whole sample, the positive stock-bond correlation has been more common than a negative one, even though the latter has been observed mainly in the past two decades.
From the 60s, with independent central banks, a positive stock-bond correlation is observed during periods with (normally) high inflation and high actual returns on Treasury bills. Bond risk premiums derived from the term structure of interest rates are positively related to those based on the CAPM (Capital Asset Pricing Model) and, therefore, derived from the stock-bond correlation. This may indicate that the CAPM has a more robust empirical basis than within asset classes.
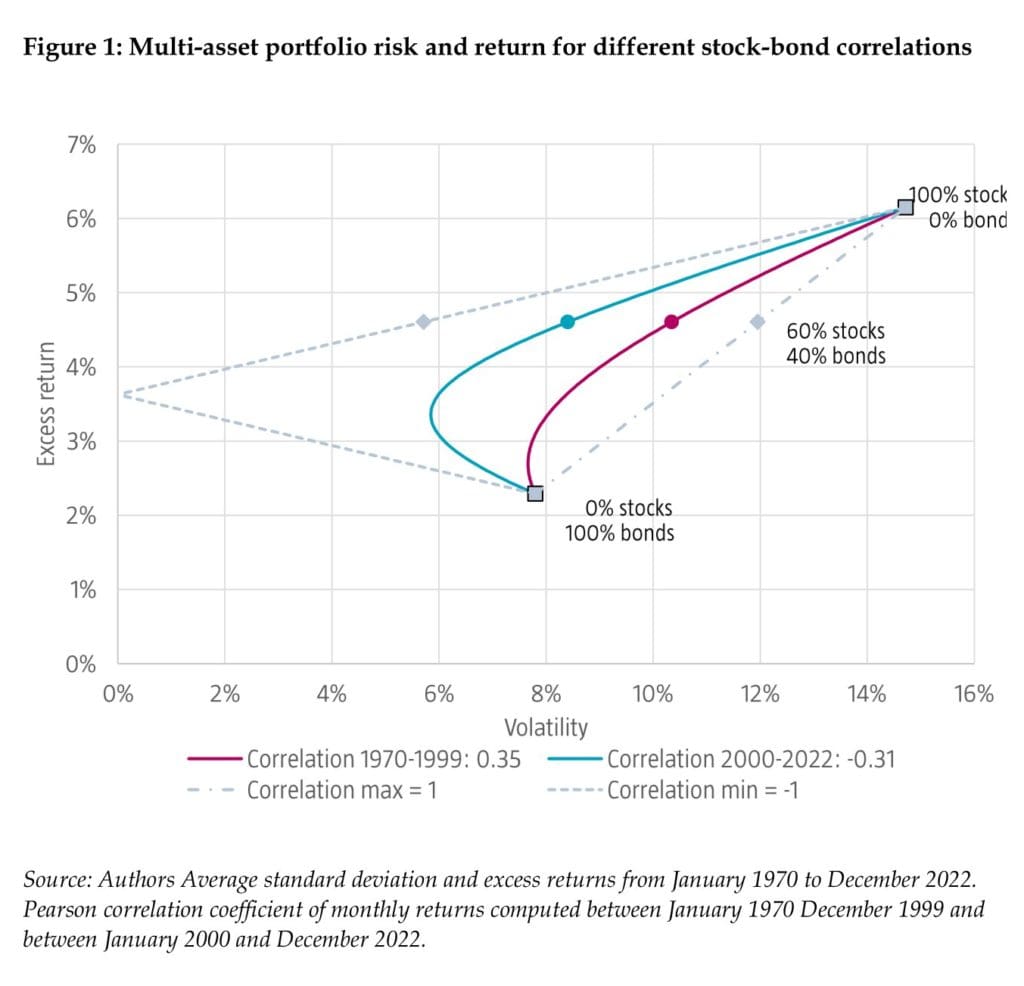
From the rich selection of clear pictures, we would like to point out Figure 1, which – keeping equity and bond mean returns and volatilities constant at the total sample values – shows that the correlation until the millennium leads to a volatility of 10.4% per annum for the 60/40 portfolio, whereas this reduces to 8.5% with the correlation realized in the post-1999 period.
These findings have important implications for multi-asset investors. Historical regimes with positive stock-bond correlation are associated with higher volatility risk of a 60/40 portfolio and lower Sharpe ratios. Changes in inflation and the actual return on Treasury bills could, through their effect on the stock-bond correlation, materially impact the risk of multi-asset portfolios and the risk premiums that investors can earn during those periods.
Authors: Roderick Molenaar, Edouard Senechal, Laurens Swinkels, Zhenping Wang
Title: Empirical evidence on the stock-bond correlation
Link: https://papers.ssrn.com/sol3/papers.cfm?abstract_id=4514947
Abstract:
The correlation between stock and bond returns is a cornerstone of asset allocation decisions. The correlation can move considerably over time, which can have a large impact on portfolio construction. Our empirical evidence points to inflation and real returns on short-term bonds, and the uncertainty surrounding inflation as important factors for understanding the sign and magnitude of the stock-bond correlation. Our historical analyses across countries suggest that our findings are robust. We apply these insights to analyze the implications of a shift in stock-bond correlation regime for the risk of multi-asset class portfolios and for bonds risk premia.
As always we present several interesting figures and tables:
Notable quotations from the academic research paper:
“The correlation between stocks and bonds is an essential driver of any asset allocation decision. It impacts not only the overall risk of a diversified multi-asset class portfolio, but also the risk premia one should expect to receive for taking risk in different asset classes. The obstacle one faces when estimating the correlation between stocks and bonds is that it fluctuates extensively across periods. Volatility of assets classes can vary widely inside of business cycle but remain relatively stable over longer horizons. Correlations between stocks and bonds, on the other hand can switch sign for very long periods. For example, the average correlation between stocks and bonds was 0.35 in the US between 1970 and 1999, then was -0.31 between 2000 and 2022.
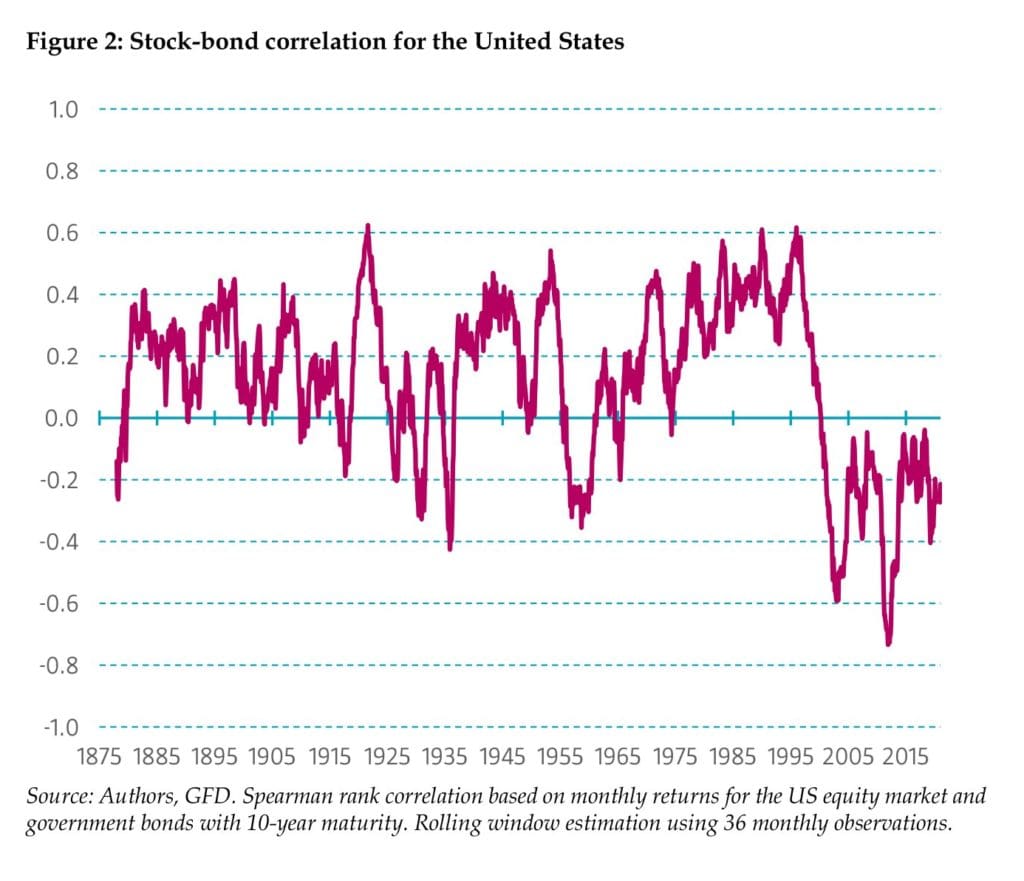
Today’s market participants have little experience, perhaps with exception of the last year, investing in an environment where the correlation between stocks and bonds is positive. Given that a shift in level or even the sign of the correlation between stocks and bonds can last for decades, short term data (i.e., 10 or even 20 years) is of little help to understand the drivers of co-movements between stocks and bonds. To resolve this, our analyses use multiple decades of historical data across multiple countries. Figure 2 contains the time- series of correlations for the United States using data starting in 1870. Researchers have several choices on how to calculate the stock-bond correlation. The effect of some of these choices are described in Appendix A, where we argue that using the Spearman rank correlation instead of the conventional Pearson correlation helps to obtain a more robust estimate of the stock-bond correlation.
Our findings can be summarized as follows. First, we observe that the stock-bond correlation varies considerably over time and across countries, both in magnitude and sign. Second, we observe that before the 1950s, realized real returns on short-term bonds and inflation had no discernable impact on the stock-bond correlation. Since the 1950s and the introduction of contracyclical monetary policies, we find remarkably similar patterns across developed markets: the stock bond correlation tends to be high during periods when inflation and real returns on short-term bonds, and the uncertainty surrounding them, are high. Third, we find that while the effect of correlation changes alone on multi-asset class portfolios is large, time-variation in stock and bond volatility can substantially reduce the impact of the stock-bond correlation. Fourth, bond risk premia are positively correlated with estimates of the stock-bond correlation as implied by the CAPM.
First, ceteris paribus, a higher variance of inflation should generate larger co-movements in bonds and equity prices. This is consistent with Brixton et al. (2023). The inflation level, the time-series variance of inflation, and forward-looking uncertainty around future inflation are positively related. Friedman (1977) states that higher inflation is accompanied by higher policy uncertainty. High inflation often leads to contra-cyclical monetary policy, inducing abrupt changes in economic policies or even political unrest, and thus wide uncertainty regarding future inflation.
Second, a higher variance of real interest rates should also generate larger co-movements in bonds and equity prices. We distinguish real interest rates and real economic growth. By doing so, the variance of real rates has a positive effect on the stock-bond correlation, but the variance of economic growth does not.
Finally, divergences in the risk premia of bonds and equities should reduce the correlation between stocks and bonds. Episodes of divergence between bond and equity risk premia have been more common in the years since 2000. During episodes of increased risk aversion (i.e., 2000, 2008, 2020) bond risk premia compress while equity risk premia expand. Such relation depends on bonds being considered as ‘safe haven’ assets. However, the assumption that sovereign bonds are ‘safe haven’ assets is not always correct.
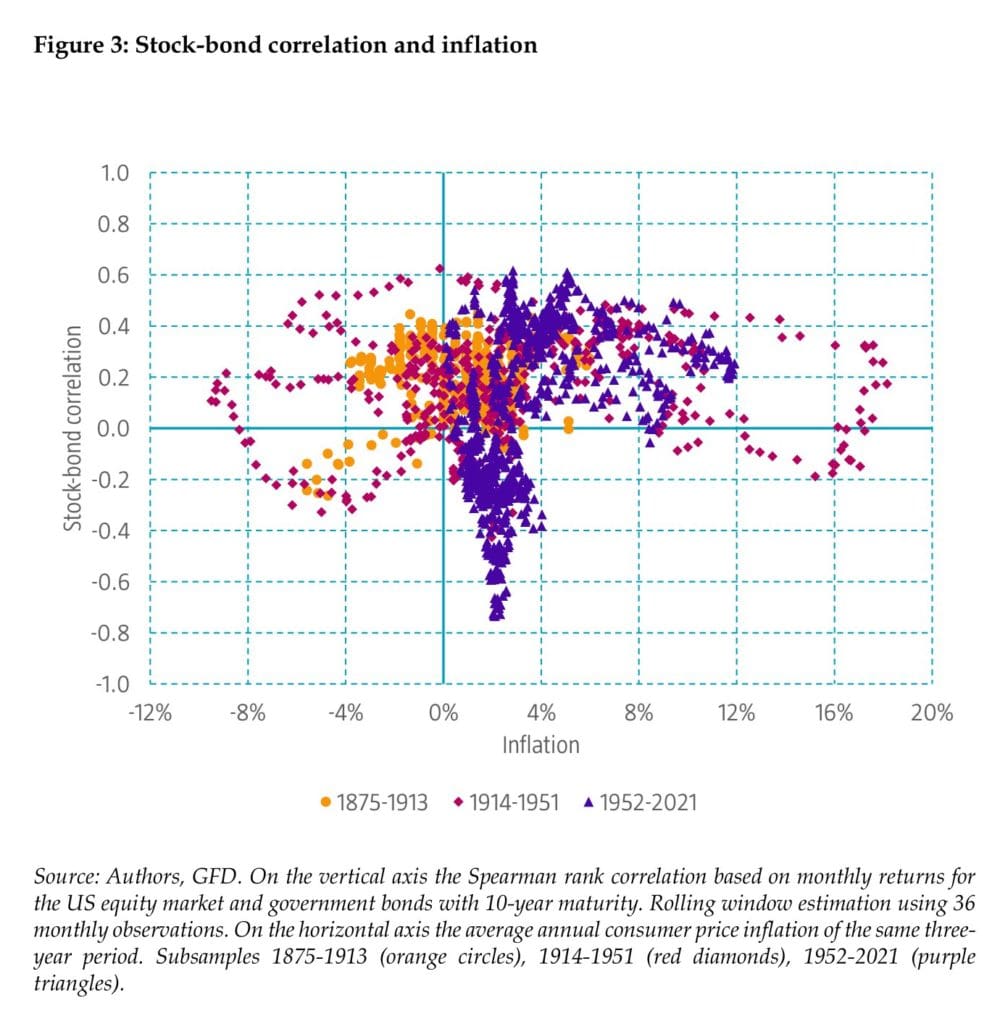
Figure 3 shows that the first subsample 1875-1913, the stock-bond correlation was mostly positive, with many of the correlations in the range 0.0-0.4. For deflationary periods, the stock-bond correlation tends to be in a narrower range of 0.2-0.4, although we see also some exceptions with a negative stock-bond correlation. For the second subsample 1914- 1951, there is even less relation between the stock-bond correlation and inflation. Even though there is a tendency for the stock-bond correlation to be positive, we see several periods, both inflationary and deflationary, that it is negative.
A higher correlation between stocks and bonds implies higher risk for multi-asset or balanced portfolios that many institutional and retail investors hold. Figure 11 shows the 36-month volatility of the 60/40 stock/bond portfolio on the vertical axis as a function of the stock-bond correlation measured over the same period on the horizontal axis. This empirical analysis complements the hypothetical portfolio analysis in Brixton et al. (2023).
Figure 12 shows that the bond risk premium tends to be higher when the correlation between stocks and bonds is higher. This is consistent with our earlier reasoning based on the CAPM that investors need to be compensated for bond risk when it comoves positively with equity market risk. However, an alternative explanation is that bond volatility tends to be higher in periods with a high stock-bond correlation, and the higher premium is caused by higher stand-alone bond volatility and is unrelated to the correlation with equity markets. The Friedman-Ball hypothesis states that increases in inflation should occur in conjunction with higher inflation uncertainty, which could lead to higher bond risk and therefore a higher bond risk premium unrelated to co-movements with equity markets.”
Are you looking for more strategies to read about? Sign up for our newsletter or visit our Blog or Screener.
Do you want to learn more about Quantpedia Premium service? Check how Quantpedia works, our mission and Premium pricing offer.
Do you want to learn more about Quantpedia Pro service? Check its description, watch videos, review reporting capabilities and visit our pricing offer.
Do you want algorithmic access to the full Quantpedia database via the API? Subscribe to Quantpedia Pro, ask for an API key, and explore the in/out-of-sample statistics, source academic papers, and code snippets — ideal for quantitative research, systematic trading workflows, and AI model training.
Are you looking for historical data or backtesting platforms? Check our list of Algo Trading Discounts.
Or follow us on:
Facebook Group, Facebook Page, Telegram, Twitter, Linkedin, Medium or Youtube
Share onLinkedInTwitterFacebookRefer to a friend


