Factor Trends and Cycles
Bearish trends or deep corrections in international equity markets starting in 2022 and rising interest rates worldwide brought investors’ attention back to not only once-proclaimed dead factor investing. When there’s again competition between risk-free assets and the proposition of uncertain returns, we often see flight to value and quality. Speculative (and even growth) investments yielding little to no positive cash flow without attractive steady earnings/revenue are often left behind as capital hides into stable names, which are often omitted when there are a lot of economic stimuli, such as during ZIRP or even QE. What’s puzzling is how to time those switches in regimes to take advantage to allocate funds to the best factors over the time.
From long-run and short run, during different market cycles, different factors behave differently. What’s fortunate is that it is pretty predictable to some extent. Andrew Ang, Head of Factor Investing Strategies at BlackRock, in his Trends and Cycles of Style Factors in the 20th and 21st Centuries (2022), used Hodrick-Prescott (HP) filter and spectral analysis to investigate different models to draw some general conclusions on most-widely used factors. We will take a look at a few of quite the most interesting ones of them. We would like to pick out some points especially interesting in the current market contest. Value factor was a very well-perceived factor during its initial discovery and inclusion into the famous Fama and French (1993) three-factor model but is still in decline after the 2000s, probably due to its overcrowded use and losing its edge. Conversely, the momentum factor is still enjoying decreased but draft presence, mainly from the trend-following (and, of course, MOMO) crowds. Still, on the other hand, it has the sharpest drawdowns during the high-volatility period, which is not weathered well by some PMs.
Andrew likes to distinguish the year 2001 as the breakpoint between the 20th and 21st centuries in case of a shift in perceiving how factors behave. So, what is gaining traction at current market conditions? The size and quality factor trends have increased in the 21st century. Low-volatility stocks have continued to reduce risk by approximately half to a third of that from the previous century. They seem to be a good choice for risk-averse investors today, which can be associated with decreasing long-term trends and negative short-term cyclical shocks.
We would also like to point out that some factors may not be crucial in some traditional models (i.e., academic ones that may not be easily replicated in real-world settings). Even omitting them would not change their overall performance. In some non-traditional models (factor definitions are not quite the same: they have adjustments or even rough simplifications), they play a significant role. That is another example of how big the gap between academia and practical use is. These questions are open and widely discussed, and we cover them extensively; e.g., book-to-market ratios (B/M) have increasingly detached from alternative valuation ratios while becoming worse at forecasting returns and growth in an absolute and relative sense, or the value premium can be resurrected using a different set of value metrics, applying some essential risk management, and making more effective use of the breadth of the liquid universe of stocks. As always, practitioners should take care of this advice as there is a clear division between the needs and expected outcomes. Factor investing is clearly not dead and going anywhere soon.
Authors: Andrew Ang
Title: Trends and Cycles of Style Factors in the 20th and 21st Centuries
Link: https://papers.ssrn.com/sol3/papers.cfm?abstract_id=4279022
Abstract:
Using filtering techniques, spectral analysis, and Markov chain models, I document trends and cycles of factors have significantly changed over the period to December 2000 compared to the period post-January 2001. The recent weaker performance of value in the 21st century, including the value drawdown over 2017 to 2022 which is the worst value drawdown ever experienced, can be attributed to both a decreasing trend component and downturns in cyclical components. Momentum performance has also declined in the post-2001 period due to decreasing trends, while the trends of the quality and size factors have increased. Low volatility portfolios still significantly reduce equity market risk in the 21st century, but the factor spends slightly longer durations in a low return regime.
As always, we present several interesting figures:
Notable quotations from the academic research paper:
“Value and momentum exhibit different in the pre-2000 and post-2001 samples. Cumulated value returns are strongly trending upwards before and including 2000, but in the post-2001 sample, exhibit an inverse-U shape. The most recent value drawdown from 2017 to 2022—the worst in magnitude and the longest in duration that is ever recorded— can be divided into three parts: the late cycle up until 2019, the Covid year of 2020 where value performed atrociously as funds flocked to growth and technology companies that helped to live in a socially distanced world, and the comeback which started at the end of 2020. Momentum returns are high pre-2000 but are close to zero in the post-2001 sample with the very large momentum crash in 2009 during the Financial Crisis being a large contributor to the low mean.
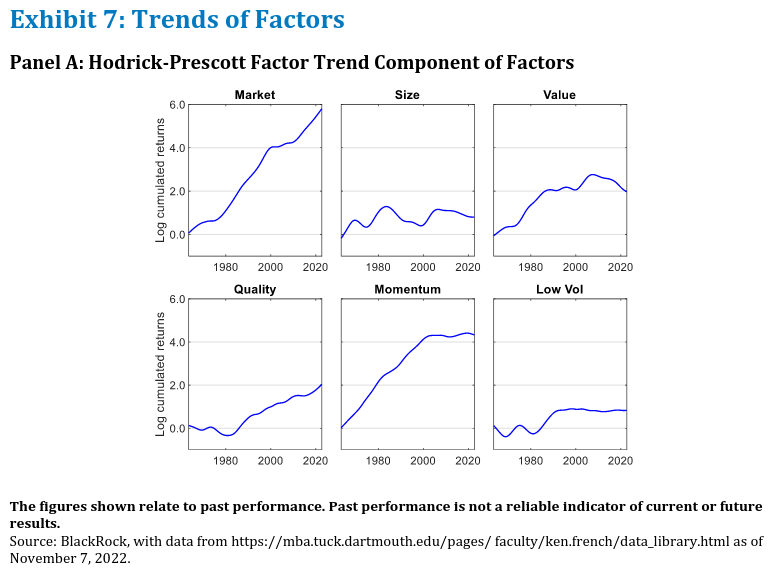
The first statistical technique I use to estimate long-run trends and short-term cycles is the Hodrick and Prescott (1997) (HP) filter. HP filters have long been used to estimate trends and cycles in economics since their original working paper in 1980.2 The trends for the size factor vary even in the 20th century, and the trend increases in the 21st century. I show that the value trend takes an inverse U-shape in the 21st century, and the extended period of underperformance of value from the 2010s is due to both declines in trend and negative cyclical components. This is in contrast to the other large value drawdown in the 20th century during the late 1990s, where the value trend was positive but the cyclical component was negative. The trend for the quality factor goes up and down in the 20th century but becomes strongly upward sloping in the 21st century. In contrast, the trend for low volatility plateaus in the 21st century. While the factor trends exhibit large time variation, there are relatively small changes in the cyclical behavior of the factors across the 20th and 21st centuries.
I complement the HP filter analysis with frequency domain analysis.3 This is useful because peaks in the power spectral densities reveal the most important periodicities of the factors. The slowly moving trend components correspond to peaks in the spectral density at low frequencies. The mean cycle for factors is around three to four years, which is less than the general length of economic cycles (which are generally 5 to 6 years in the post-World War II sample). Size shortens its long-run cycles in the post-2001 period, whereas the momentum factor’s cycles are unchanged in the 20th and 21st centuries. The value factor extends its long-run cycles in length in the 21st century, consistent with the U-shaped HP trend in this period.
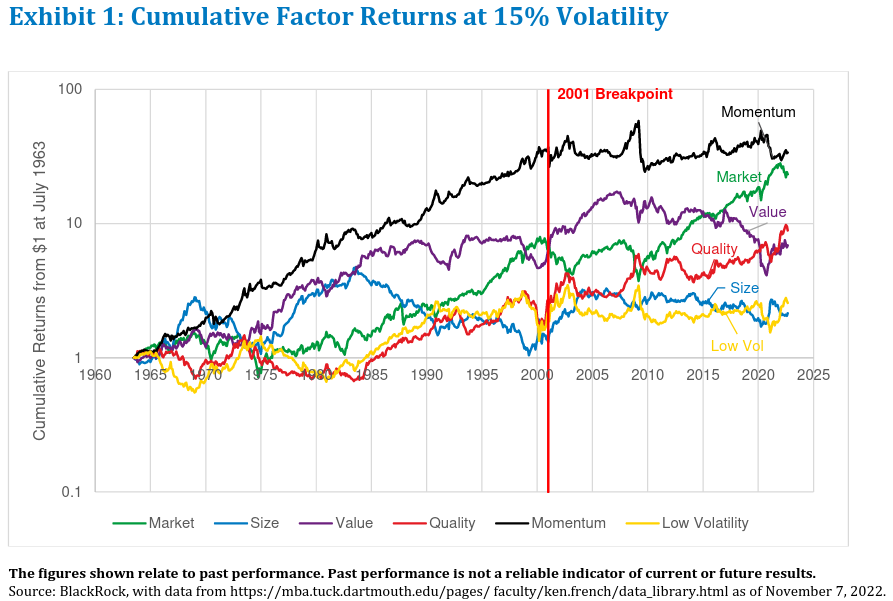
Exhibit 1 plots cumulative returns of the five style factors with $1 invested at the beginning of July 1963 on a log10 scale. I scale these zero-cost portfolios to 15% annual volatility for comparability, which is approximately the same as the volatility of the market. (Note that the market factor, being an excess return, is also a long-short portfolio.) Since these factors are rescaled, most of the information is in relative rankings and trends, rather than in absolute levels of factor moments. When statements about the absolute levels of the factors are needed, I work with the unscaled decile characteristic portfolios.
In Exhibit 1, the year 2001 is marked with the red vertical line and is the breakpoint between the 20th and 21st centuries. Already we see that the slopes of the cumulated returns differ for some factors in the pre-2000 sample vs. the post-2001 sample. Momentum cumulated returns are strongly upward sloping pre-2000 but they are approximately flat (or appear to be without upward trend) in the post-2001 sample. After the late 2000s, value has a general downward trend, which takes its cumulative return back to roughly the same level as January 2001 at the end of the sample, August 2022. The size factor appears to have less cyclical variation in the 21st century compared to more pronounced cycles in the 20th century. The highest peak for the size factor occurs in 1983. Low volatility also has low- frequency variation and appears to have little trend post-2001. In fact, only the market factor appears to have approximately the same upward trend pre-2000 and post-2001.
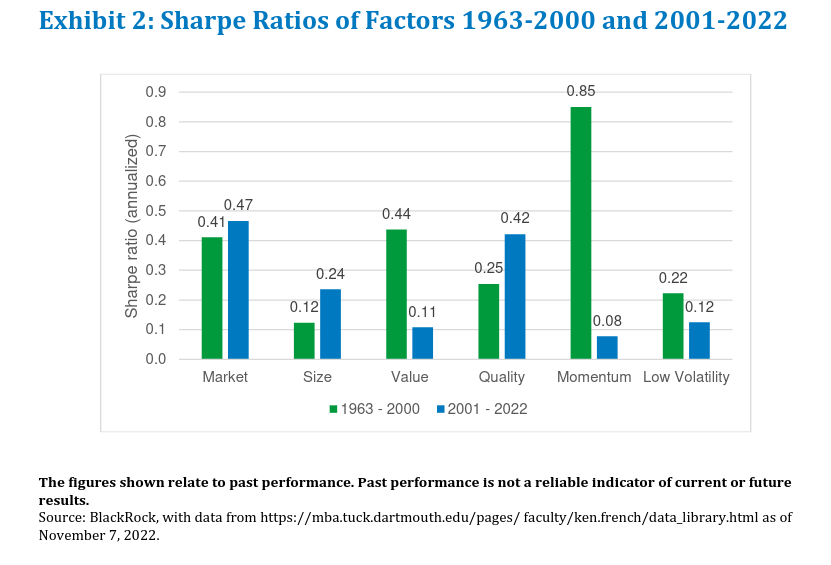
The Sharpe ratios in the pre-2000 and post-2001 periods, which are reported in Exhibit 2, confirms the cumulated returns graphed in Exhibit 1. The market Sharpe ratios are approximately the same across the two periods, at 0.41 and 0.47 for the 20th and 21st centuries, respectively. The quality factor increases its Sharpe ratio from 0.25 in the pre- 2000 sample to 0.42 in the post-2000 sample. The size factor Sharpe ratio also increases from 0.12 in the 20th century to 0.24 in the 21st century, with the relatively low Sharpe ratio of 0.12 pre-2000 reflecting a drawdown for size that begins in the 1980s (see Exhibit 1).7
The most noticeable changes in Exhibit 2 are the Sharpe ratios for value and momentum, with both factor Sharpe ratios falling sharply in the 21st century. The Sharpe ratio for value falls from 0.44 to 0.11 in the pre-2000 to post-2001 time periods, respectively. Momentum exhibits a very large fall in its Sharpe ratio from 0.85 to close to zero, at 0.08, over the pre-2000 and post-2001 samples. We now further examine the performance of these factors.
(…) the traditional valuation metrics (like book-to-market) could have become obsolete, perhaps being supplanted by other more sophisticated metrics like intangible assets, or value ceased to work due to macro regime changes like falling and low interest rates, or perhaps arbitrage caused the value premium to disappear entirely.8
The only factor in Exhibit 7, Panel A that has a trend that is approximately constant is the market portfolio. The trend for size is time varying even in the 20th century, with peaks during 1969 and in 1983. From the early 1980s to the end of the 20th century, the trend for size is downward sloping. In the 21st century, the size factor’s trend recovers strongly in the early 2000s and from this point there is a slight decrease until the end of the sample in August 2022.
The trend for the quality factor can be divided into two parts in the 20th century. There is a downward sloping trend until 1980, and since then the trend for quality has been upward sloping. The positive trend continues into the 21st century. Finally, the trend for low volatility wavers from 1963 to 1981, from which point there is a positive trend which flatlines in the early 1990s. This plateau extends to the 21st century.
While filters, spectral analysis, and Markov models can characterize changing long- and short-run components of factors, the deeper question is what is driving these changes in trends and cycles? The analysis in this paper uses only returns and thus I cannot directly speak to the underlying economic mechanisms which produce predictable short- or long- term variation in style factor returns, like from macro variables (see, for example, Ferson and Harvey [1991]), institutional features of markets like constraints which induces investors to act in certain ways (Asness, Frazzini, and Pedersen [2012]), or investor behavioral biases (Barberis, Jin, and Wang [2021]). This is an important area for future research.”
Are you looking for more strategies to read about? Sign up for our newsletter or visit our Blog or Screener.
Do you want to learn more about Quantpedia Premium service? Check how Quantpedia works, our mission and Premium pricing offer.
Do you want to learn more about Quantpedia Pro service? Check its description, watch videos, review reporting capabilities and visit our pricing offer.
Do you want algorithmic access to the full Quantpedia database via the API? Subscribe to Quantpedia Pro, ask for an API key, and explore the in/out-of-sample statistics, source academic papers, and code snippets — ideal for quantitative research, systematic trading workflows, and AI model training.
Are you looking for historical data or backtesting platforms? Check our list of Algo Trading Discounts.
Or follow us on:
Facebook Group, Facebook Page, Telegram, Twitter, Linkedin, Medium or Youtube
Share onLinkedInTwitterFacebookRefer to a friend


