From Backtest to Benchmark: Validating New Strategies with Quantpedia API
A profitable backtest is rarely the end of a research process. In professional quantitative research, the more important question often comes after the first positive result: is the strategy genuinely new, or is it simply another version of an already known factor, timing rule, or anomaly?
This is especially relevant when a researcher develops a new systematic strategy with a clean historical equity curve. The strategy may have acceptable risk-adjusted performance, stable drawdowns, and a logical trading rule, but those statistics alone do not prove that the idea is unique. A silver strategy, for example, may look different on the surface while still behaving like a known commodity timing model, a trend-following strategy, a volatility filter, or a broader macro factor exposure.
This article shows how Quantpedia API can be used as a benchmark dataset for validating new research. Instead of evaluating a new backtest in isolation, the strategy is compared against the Quantpedia universe of documented quantitative strategies. The workflow identifies nearest neighbours, assigns the strategy to a factor cluster, calculates a uniqueness score, and produces a research robustness report that can be used for deeper validation.
The goal is not to replace human research judgment. The goal is to create a structured robustness checker that helps researchers understand whether a new strategy is truly differentiated, redundant with known effects, or simply a variation of an existing Quantpedia strategy profile.
The Problem: A Good Backtest Is Not Enough
Researchers often start with a simple question: “Is my new strategy good?” In practice, that question is too narrow. A more useful research question is: “Is my new strategy genuinely novel, robust, and sufficiently different from strategies that already exist?”
A strategy can show a positive Sharpe ratio and a controlled drawdown while still being economically uninteresting. It may only replicate an existing factor exposure, such as momentum, carry, value, volatility timing, or commodity trend following. It may also perform well only because the sample period overlaps with a favorable market regime.
This is why a standalone backtest should be transformed into a benchmarked research object. The strategy should be compared with a broad database of known quantitative strategies, not only by return statistics, but also by return correlation, drawdown behavior, factor exposure, and cluster membership.
Quantpedia API makes this possible because it can provide programmatic access to strategy metadata, classifications, performance statistics, and equity curves. In addition to the API layer, Quantpedia also provides strategy reports and Pro reports that allow researchers to interpret the results in a broader research context. This is important because a validation process should not stop at a numerical similarity score. It should also explain why a strategy is similar or different from existing documented strategies.
Test Case: A Silver Futures Pullback Strategy
The example strategy used in this workflow is a long-only silver futures strategy. The trading logic is based on an EMA pullback framework with an adaptive regime filter. The original idea was ported from a Pine Script version into a Python research environment and tested on daily bars.
The strategy uses daily data and covers more than three years of history, which is an important minimum requirement for this type of validation. A very short equity curve would make nearest-neighbour analysis and clustering unstable. A daily return series with at least three years of observations gives the validation process enough data points to compare the strategy against other systematic strategies in a more meaningful way.
The strategy is also intentionally conservative in capital usage. It uses only 10% equity per trade and stays flat most of the time. Therefore, the absolute return is expected to be low. In this case, the research question is not whether the strategy produces an aggressive standalone return. The question is whether its return profile is distinct from the Quantpedia universe.
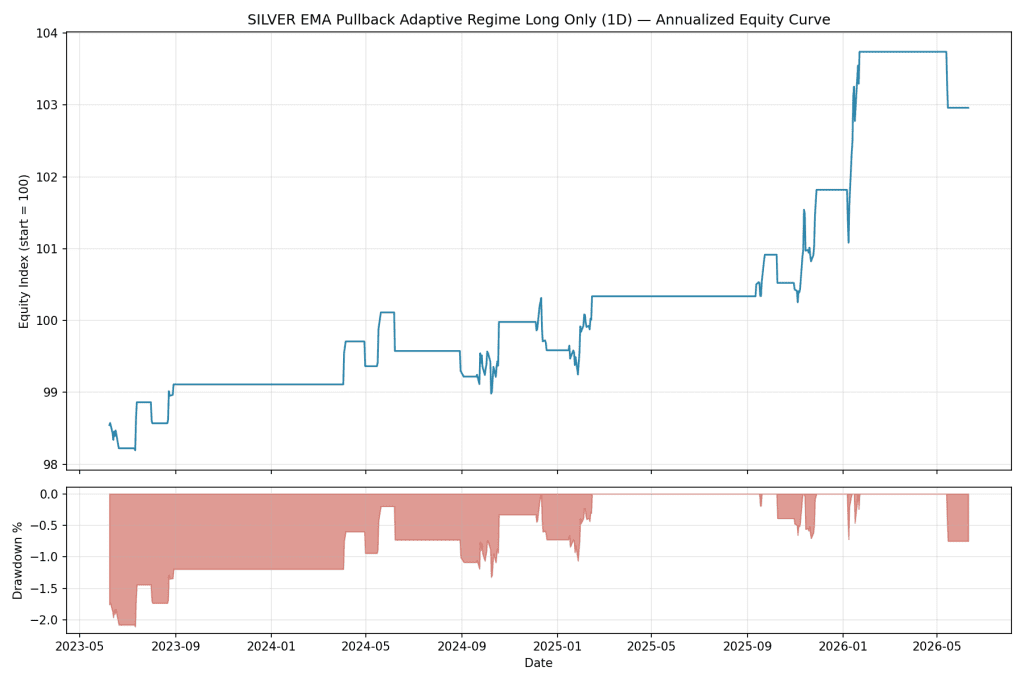
The annualized equity curve shows a relatively flat profile with several short periods of activity. This is consistent with the strategy design. The system does not attempt to be continuously invested. It waits for a specific pullback and regime condition, enters only when the setup appears, and otherwise remains out of the market.
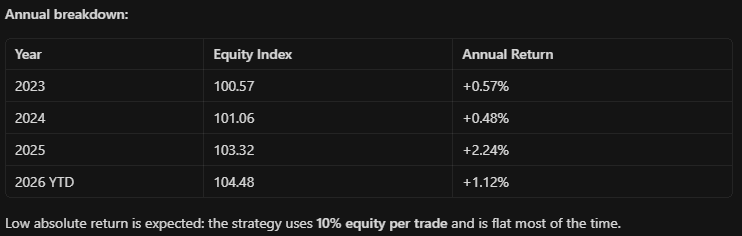
The annual breakdown confirms the same behavior. The equity index moves slowly, with modest annual returns in each year. This is expected because the strategy allocates only a small part of the capital per trade and does not maintain constant exposure.
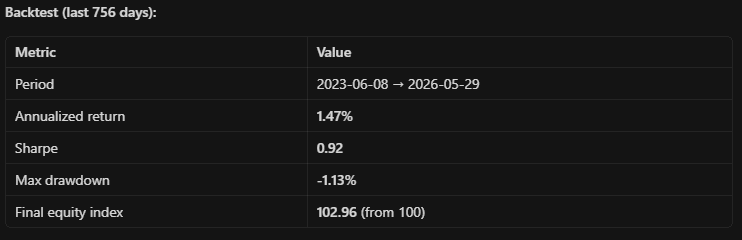
The full backtest covers 756 daily observations from June 2023 to May 2026. Over this period, the strategy generated an annualized return of 1.47%, a Sharpe ratio of 0.92, a maximum drawdown of -1.13%, and a final equity index of 102.96 starting from 100.
These numbers should be interpreted carefully. On one hand, the absolute return is low. On the other hand, the strategy has limited exposure and very small drawdowns. For validation purposes, this makes it a useful research object. The equity curve is not meant to demonstrate a finished allocation product. It is used as an input into a robustness-checking workflow.
From Strategy Backtest to Validation Dataset
Before the strategy can be compared with the Quantpedia universe, its equity curve must be exported in a clean research format. The workflow requires a daily equity curve, daily returns, drawdowns, and annualized performance columns. The output should be reproducible and easy to inspect.
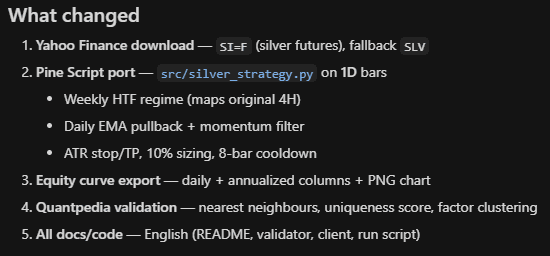
In this case, the research workflow was structured as a small project. The data download was based on Yahoo Finance silver futures data, with SLV used as a fallback. The trading logic was ported from Pine Script into a Python script running on daily bars. The Python implementation added a weekly higher-timeframe regime map, a daily EMA pullback and momentum filter, ATR-based stop loss and take profit logic, and an eight-bar cooldown.
This step is important because the validation process should not depend on a visual chart or a manually inspected TradingView backtest. The strategy must be converted into a structured dataset that can be compared systematically. Once the daily equity curve is exported, it becomes possible to compute returns, correlations, drawdown similarity, nearest neighbours, and clustering features.
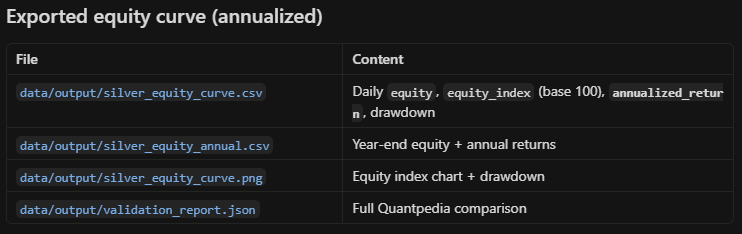
The project exports several files. The main daily equity curve contains the date, equity, equity index, annualized return, and drawdown. A separate annual file summarizes year-end equity and annual returns. A PNG chart provides a visual overview of the equity curve and drawdown. The validation report stores the full Quantpedia comparison in a machine-readable format.
This is also where reproducibility becomes part of the research process. A professional quant researcher should be able to rerun the validation, inspect the input files, check the equity curve construction, and verify that the same statistics lead to the same validation result.
Quantpedia API as a Benchmark Universe
The next step is to compare the new silver strategy against the Quantpedia universe. This is the key transition from a normal backtest to a benchmarked research profile.
The Quantpedia universe can be used as a reference set of documented strategies. Each strategy in the universe may contain metadata, classifications, strategy descriptions, performance statistics, and equity curves. This makes it possible to compare a new strategy not only against one hand-picked benchmark, but against a broad collection of known systematic strategy profiles.
The comparison can be made across several dimensions. The first is return similarity, where the daily return series of the new strategy is compared with existing Quantpedia strategies. The second is risk-profile similarity, where drawdowns, volatility, skewness, and downside behavior are considered. The third is factor classification, where the strategy is placed into a cluster of related strategies. The fourth is research interpretation, where the nearest Quantpedia neighbours and available reports help explain the economic meaning of the result.
This is where Quantpedia reports add value beyond the raw API data. Reports such as Correlation Analysis, Clustering, Factor Regression, Risk Scenarios/VaR, and Monte Carlo can be used to investigate whether the strategy is truly independent, whether it shares hidden factor exposures, and whether its behavior remains stable across stress scenarios.
Nearest Neighbours and Strategy Similarity
The nearest-neighbour step answers a simple but important question: which existing Quantpedia strategies look most similar to the new strategy?
This comparison can use daily return correlation, similarity of equity curve shape, drawdown characteristics, volatility profile, and performance statistics. A strategy does not need to have identical rules to be economically similar. If two strategies produce similar return streams, they may be exposed to the same underlying factor or market regime.
In this case, the closest Quantpedia neighbour was identified as Timing Commodities and S&P500 with COT (#0030), with a return correlation of only +0.058. The nearest commodity peers were Gold Market Timing (#0043) and Momentum Effect in Commodities (#0021).
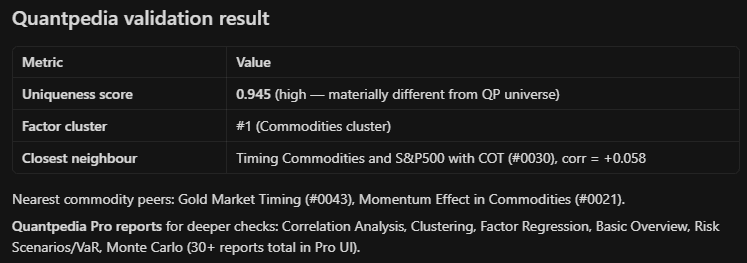
This result is useful because it gives the researcher a concrete starting point. Instead of looking at the new silver strategy in isolation, the researcher can now compare it with existing commodity timing and commodity momentum strategies. The low correlation to the closest neighbour suggests that the silver strategy is not simply a direct clone of the nearest Quantpedia profile. However, its placement among commodity-related peers still gives it an intuitive economic context.
This is exactly the type of insight that is difficult to obtain from a standalone backtest. Without a benchmark universe, the researcher would see only the strategy’s own Sharpe ratio, drawdown, and return. With the Quantpedia comparison, the researcher sees where the strategy sits relative to known systematic strategies.
Clustering by Factor Exposure
Nearest neighbours are useful, but they do not provide the full picture. A strategy may not be very close to any single existing strategy, but it can still belong to a broader factor family. This is why clustering is an important part of the validation workflow.
Clustering groups strategies according to shared return behavior, factor exposure, or strategy characteristics. A new strategy can then be assigned to the most relevant cluster. If the strategy falls into a large and well-known cluster, it may be a variant of an existing factor. If it sits near the edge of a cluster or appears more isolated, it may deserve deeper research attention.
In the validation result, the silver strategy was assigned to Factor Cluster #1, interpreted as a Commodities cluster. This classification is intuitive because the tested strategy trades silver and its nearest neighbours are commodity-related strategies. At the same time, the low correlation to the closest neighbour indicates that the strategy may have a differentiated return path inside the broader commodity strategy group.
This distinction matters. A strategy does not need to be completely outside all known clusters to be useful. In many cases, the best research candidates are not entirely unrelated to existing factors. They are related enough to have a plausible economic explanation, but different enough to offer potential diversification value.
Measuring Strategy Uniqueness
The most important output of the validation process is the uniqueness score. This score is designed to summarize how different the new strategy is from the existing Quantpedia universe.
A uniqueness score should not be based on one metric only. A robust score can combine several components: low correlation with nearest neighbours, different drawdown behavior, distance from existing clusters, limited redundancy with known factors, and sufficient data quality. The minimum requirement of at least three years of daily data is important because uniqueness cannot be measured reliably from a very short sample.
In this case, the validation workflow produced a uniqueness score of 0.945, which is interpreted as high. The report describes the strategy as materially different from the Quantpedia universe. This does not automatically mean that the strategy is investment-ready. It means that, according to the validation framework, the strategy does not appear to be a simple replication of the closest known Quantpedia strategies.
This is the correct way to interpret the result. The uniqueness score is not a guarantee of future performance. It is a research diagnostic. It helps answer whether the strategy is potentially original enough to justify further work.
A low uniqueness score would suggest that the strategy may be redundant with existing strategies. A high uniqueness score suggests that the researcher should continue with deeper tests, including robustness checks, parameter sensitivity, transaction costs, out-of-sample validation, factor regression, and stress testing.
From API Output to Research Robustness Report
The final output of this process is a research robustness report. Such a report should not only show the backtest statistics of the new strategy. It should explain how the strategy compares with a professional benchmark universe.
A useful robustness report should include the strategy’s performance statistics, annual breakdown, exported equity curve, nearest Quantpedia neighbours, cluster assignment, uniqueness score, and suggested follow-up reports. In this case, the report identifies the strategy as a commodity-cluster strategy with high uniqueness, low correlation to the closest neighbour, and several relevant commodity peers for further comparison.
This is valuable for professional quants and academics because it turns strategy validation into a structured workflow. Instead of relying on subjective judgment, the researcher can compare a new idea against a broad universe of documented strategies and then decide whether the idea is worth further development.
Files and Reproducibility
The full workflow is organized into a reproducible project folder. It contains the data folder, source code, configuration example, requirements file, README documentation, and a validation runner script. This structure is important because research validation should be repeatable. A strategy should not depend on a one-off notebook or manual chart inspection.
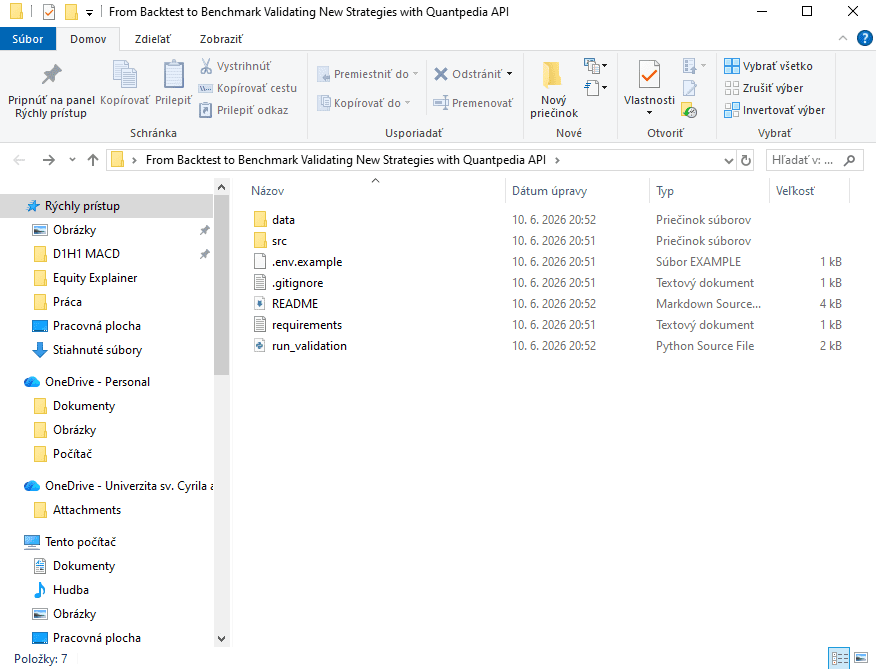
The exported files allow the researcher to separate the strategy generation step from the validation step. The strategy script produces the daily equity curve and annual summary. The validation script then reads those outputs and compares the strategy against the Quantpedia universe.
This separation makes the workflow practical for a broader research process. Any new strategy with at least three years of daily data can be placed into the same validation pipeline. The same logic can then be reused for equity factors, commodity strategies, cross-asset timing models, volatility strategies, or alternative risk premia.
Conclusion
A new backtest should not be evaluated only by its own Sharpe ratio, annualized return, or maximum drawdown. Those metrics are useful, but they do not answer whether the strategy is original, whether it overlaps with known factors, or whether it adds anything new to an existing research library.
Quantpedia API can be used as a benchmark dataset for this type of validation. By comparing a new strategy against the Quantpedia universe, researchers can identify nearest neighbours, assign the strategy to a factor cluster, calculate a uniqueness score, and produce a structured research robustness report.
The silver futures example shows how this works in practice. The strategy has modest absolute performance because it uses only 10% equity per trade and remains flat most of the time. However, once it is transformed into a daily equity curve and compared against the Quantpedia universe, it receives a high uniqueness score, is assigned to a commodities cluster, and is linked to relevant commodity strategy peers.
This is the main value of the workflow. Quantpedia API does not simply help researchers find strategies. It can also help them validate new research ideas, measure redundancy, and understand whether a backtest represents a genuinely differentiated strategy profile or just another version of an already known factor.
Author: David Mesicek, Juniot Quant Analyst, Quantpedia
Are you looking for more strategies to read about? Sign up for our newsletter or visit our Blog or Screener.
Do you want to learn more about Quantpedia Premium service? Check how Quantpedia works, our mission and Premium pricing offer.
Do you want to learn more about Quantpedia Pro service? Check its description, watch videos, review reporting capabilities and visit our pricing offer.
Do you want algorithmic access to the full Quantpedia database via the API? Subscribe to Quantpedia Pro, ask for an API key, and explore the in/out-of-sample statistics, source academic papers, and code snippets — ideal for quantitative research, systematic trading workflows, and AI model training.
Are you looking for historical data or backtesting platforms? Check our list of Algo Trading Discounts.
Or follow us on:
Facebook Group, Facebook Page, Telegram, Twitter, Linkedin, Medium or Youtube
Share onLinkedInTwitterFacebookRefer to a friend