How to Faster Enhance Strategic Asset Allocation with Tactical Models
Each change in a strategic asset allocation of a professionally managed portfolio comes only after meticulous analysis. Firstly, we must understand the current status of the portfolio – how it behaved in the past, the strong and weak points of current allocation, and the main risk factor exposures. Then we can think about the future. We can decide how active we want to be, how large a risk budget we have at our disposal, and what asset classes we want to continue to focus on in our tactical models. Afterward comes the time for creativity – we can analyze opportunities and look for ideas for new models that complement what we already have. That’s time for Quantpedia Pro, and we will use this short case study and walk you through the few features that simplify the process of finding new ideas for trading strategies that fit your individual case.
So let’s step in the shoes of a portfolio manager. Our Portfolio Manager tab contains a pool of 350+ Quantpedia model factor strategies (that were derived out of the research papers, backtested, and are periodically updated) and 200+ passive market factors (the most liquid ETFs that cover major assets, styles, and factors). Users can also upload their own models or equity curves for analysis. Combining the user’s uploaded equity curves, market factors, and Quantpedia models allows high flexibility in the design of model multi-asset multi-factor portfolio that can be thoroughly analyzed later.
Composition Of Our Portfolio
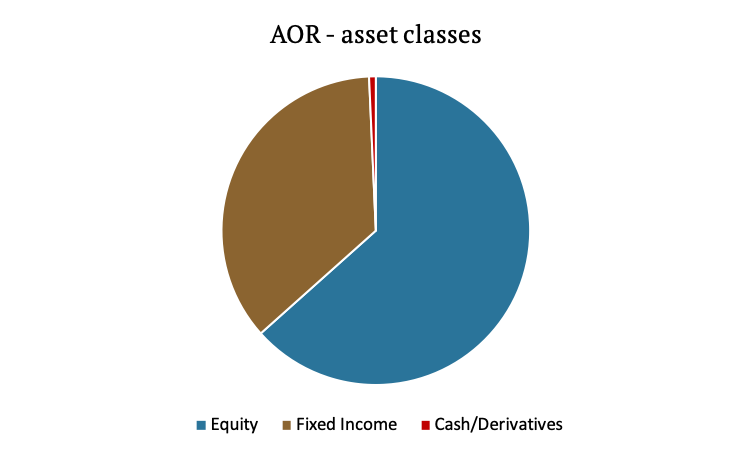
We designed a portfolio that consists of 100% AOR – iShares Core Growth Allocation ETF for further investigation. The AOR ETF’s webpage indicates that fund consists of three types of asset classes, the most dominant one is Equity with approximately 63.33%, the second is Fixed Income with around 35.86%, and the last one is Cash/Derivatives with only 0.70%. AOR fund is a very good approximation of a strategic asset allocation of an average balanced mutual, pension, or endowment fund, and that’s the reason why we selected this ETF.
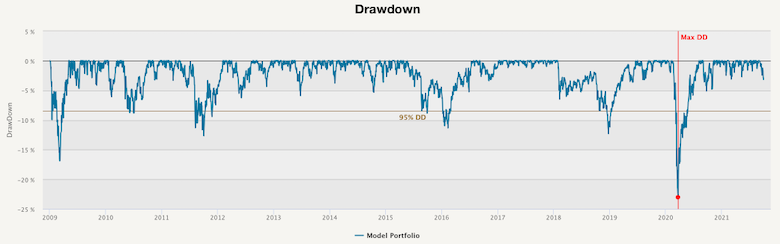
So, let’s dig deeper straight ahead. In the “Quick Portfolio Summary” section, we see the performance chart, drawdown chart and a table with the basic information.
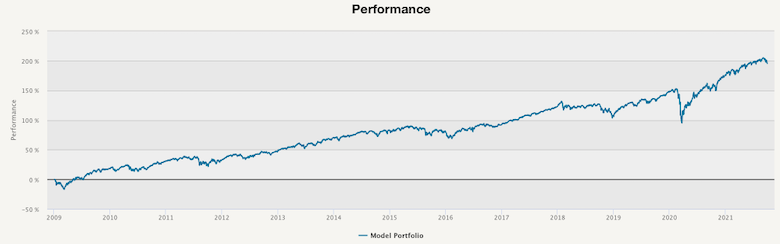
In our case, we notice that the performance is steadily growing with a few drawdown periods. The maximal drawdown at almost -23% is experienced during the Corona crisis in March 2020.
The performance of this ETF is 8.86% p.a. since the inception in January 2009, and the volatility is 11.18% p.a., which gives us the Sharpe ratio of 0.79.

Main Drivers of the Performance
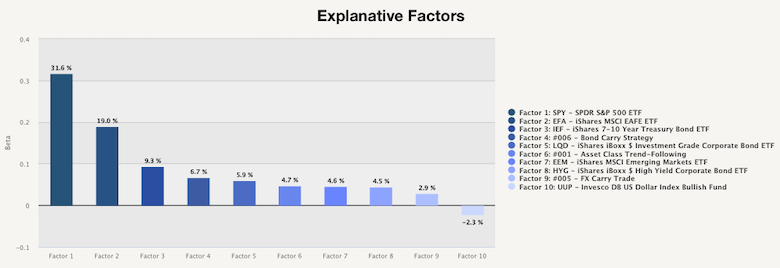
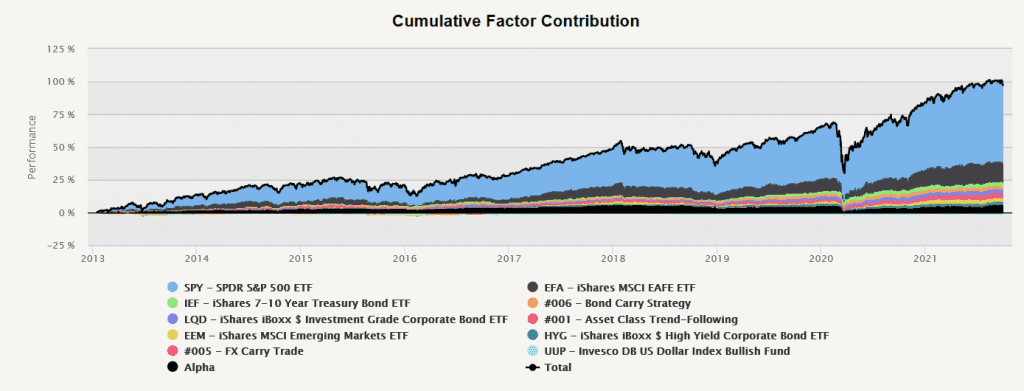
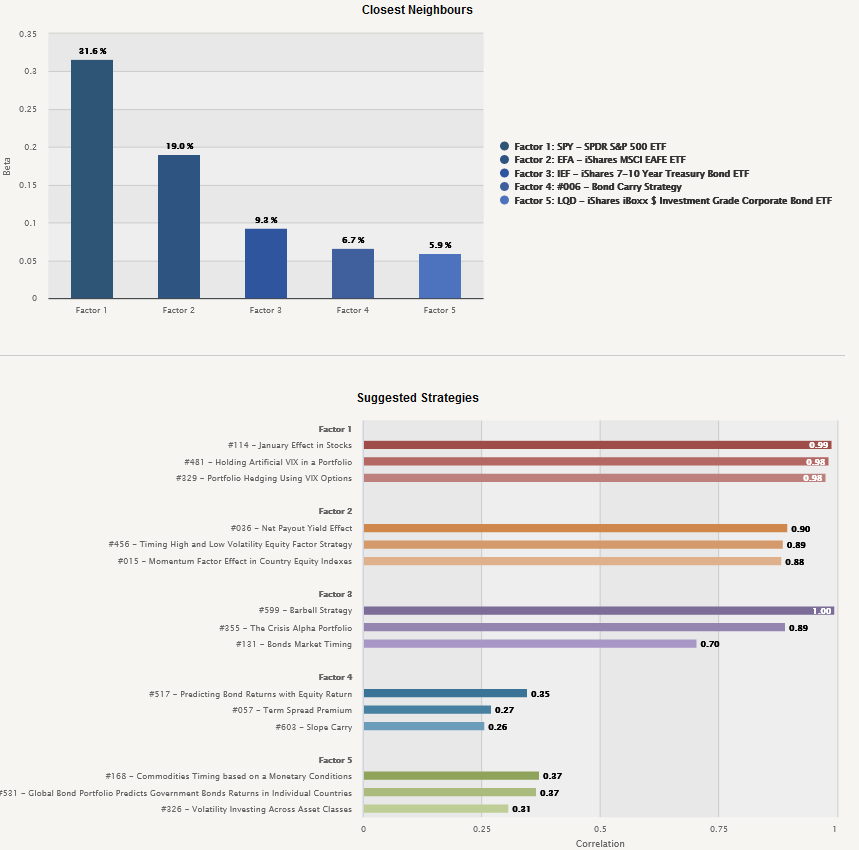
Now let’s take a look at the main drivers of the performance in the Multi-Factor Analysis tool in the Portfolio Analysis tab. The first chart on this page helps to investigate the portfolio’s factor loadings. We can see that the majority of the profit comes from stocks, specifically from SPY (31.60%) and EFA (19.00%). Additionally, IEF – iShares 7-10 Year Treasury Bond ETF also make up a significant portion (9.30%).
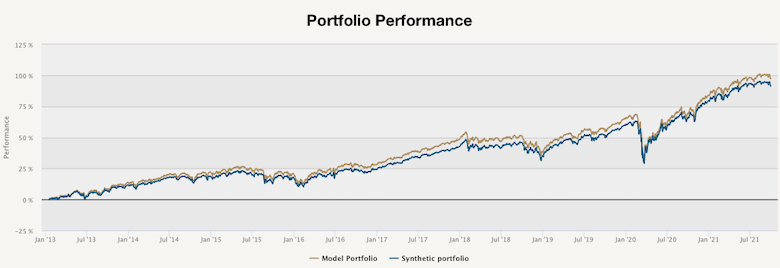
The second chart in the Multi-Factor Analysis tool compares our custom model portfolio to the synthetic portfolio build from the identified investment factors. We can say that the factor analysis is done well because the synthetic portfolio almost perfectly matches our model portfolio.
Cumulative Contribution of Individual Factors
We can also review the cumulative contribution of individual factors to the overall performance of AOR ETF. We can see that the contribution of the US equities is responsible for the majority of the return of the selected fund.
Factor analysis of AOR ETF is easy, as it probably doesn’t contain a lot of exotic factor strategies or models. But our Factor Analysis model can handle and analyze even more unusual funds and portfolios. Alternatively, our second “Factor Analysis Models” report decomposes the portfolio into elementary factors by using more traditional factor models (like Fama&French etc.).
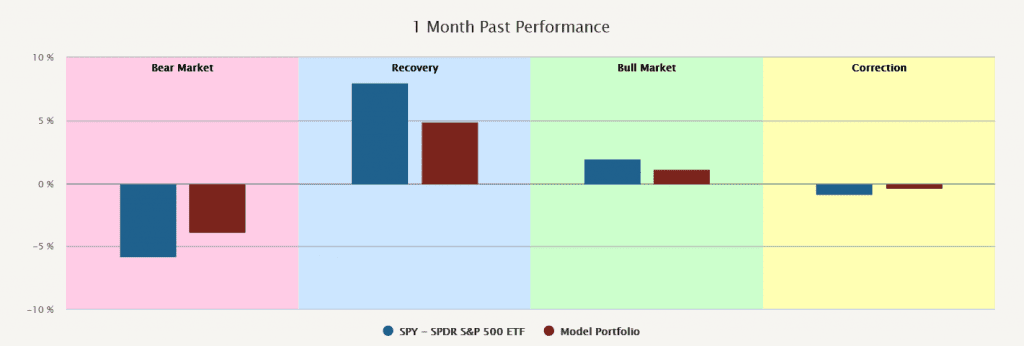
We can review the Market Phases report to better understand how our model portfolio behaved during different market cycle phases. 100% AOR portfolio is moving in tandem with US equities, which is understandable, but not all portfolios are so sensitive to ebbs and flows of the stock market.
Now comes the time for the most crucial question of all. How do we improve our model performance?
Trend and Reversal Analysis
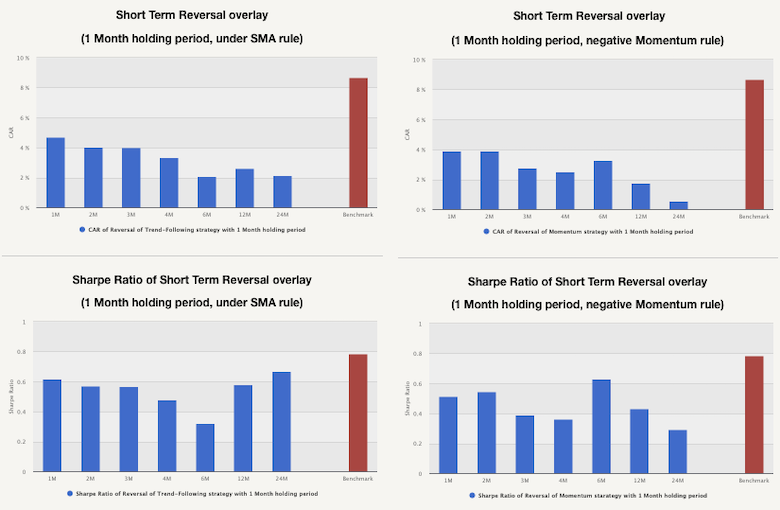
The easiest way would be a simple overlay using trend or reversal. Let’s take a look at the Trend/Reversal Analysis tab.
| Do you want to test these ideas yourself? We offer our readers Historical Trading Data Discounts. |
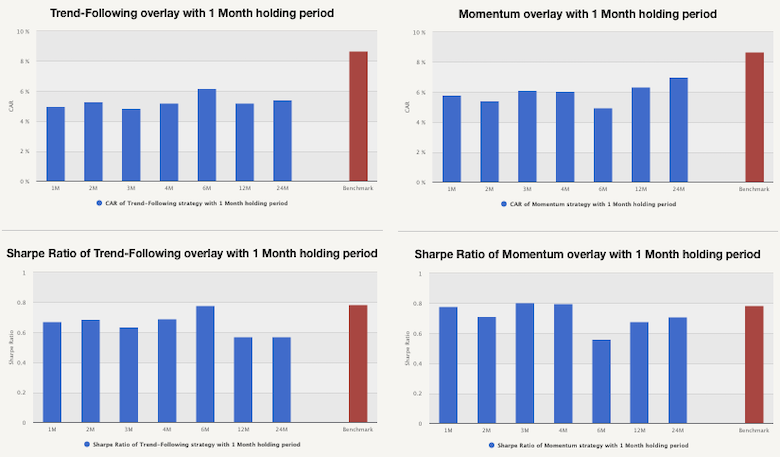
From the charts in the Trend & Momentum section, we can safely say that even though the Sharpe ratio slightly improves in certain cases, the overall performance does not. Additionally, when we look at the charts in the Short-Term Reversal section, we can see that neither the performance improves nor the Sharpe ratio. Overall, we can say that a simple market timing overlay using trend or reversal is not the way to get better performance out of the our model portfolio.
Complementary Strategies
Another way to look at this problem might be through Complementary Strategies. Complementary strategies allow the user to review the possible additions of new trading strategies into their portfolio based on either improving the Sharpe ratio or lowering the correlation of assets. Let’s inspect the table with suggested trading strategy ideas that improve our portfolio by offering the highest increase in the Sharpe ratio.
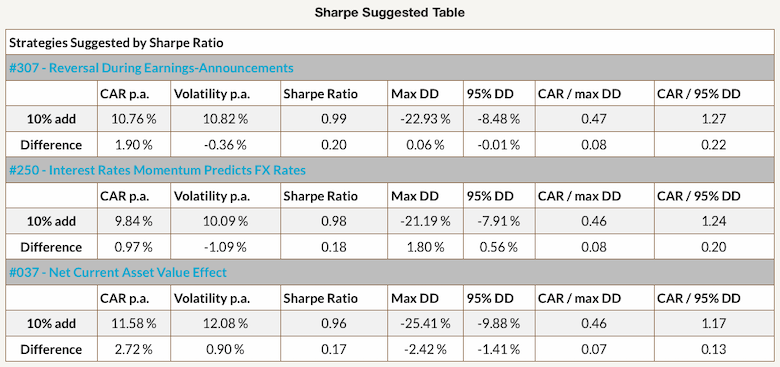
The first suggestion is Reversal During Earnings-Announcements. This would improve our performance by 1.90% and increase the Sharpe ratio by 0.20 points. However, both the maximal drawdown and the 95% drawdown do not improve dramatically.
Another way to improve the Sharpe ratio is by investing in systematic exposure to the currency asset class, particularly strategy based on interest rates differentials momentum. This would also enhance our performance and Sharpe ratio, as well as lower the maximum drawdown. Lastly, to improve the Sharpe ratio, the table suggests investing in a value strategy popularized (and used) by the father of security analysis, Benjamin Graham.
Now let’s look at the table with recommended trading strategy ideas that offer the lowest overall correlation.
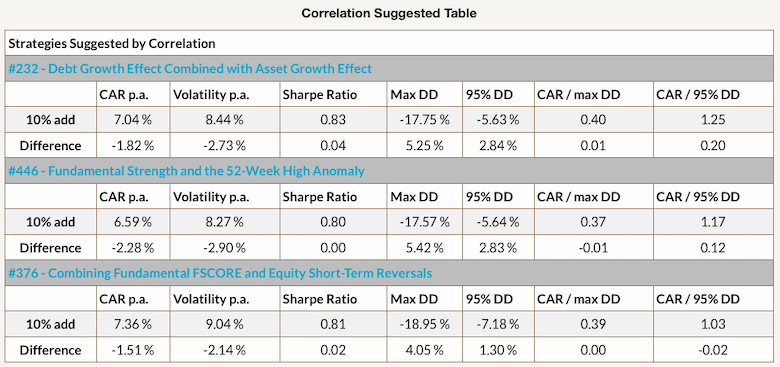
Looking at the cumulative returns, Sharpe ratios and the drawdowns, it seems that neither of the suggestions considerably improves our portfolio.
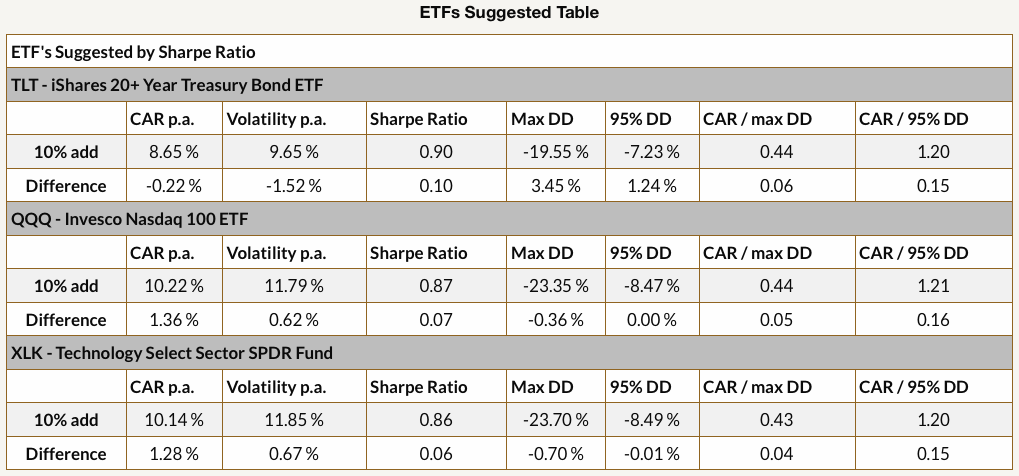
Lastly, we can take a look at the ETFs which are suggested by Sharpe ratio. The ETFs either improve cumulative return or reduce the volatility.
What are the Closest Neighbours to our Portfolio
We can continue our analysis with the Closest Neighbours report, which recommends Quantpedia’s ideas for trading strategies which are the most similar to the significant factors out of the multi-factor regression analysis. Users can use this report to research potential improvements of the identified main factors. Our portfolio consists of just one ETF, so we can’t easily decrease exposure to the individual factors/markets and replace it with another systematic factor. But portfolios that consist of many independent ETFs, model strategies, and user’s equity curves (models) can easily find ideas for amendment with the help of this report.
Could Volatility Targeting Help Us?
Before we start adding anything to our current portfolio, let us take a quick look at the Volatility Targeting report. The “Volatility Targeting” is a position sizing method that targets a constant volatility exposure of a custom model portfolio by leveraging exposure during low-volatility periods and scaling back exposure during high-volatility periods. This tool provides three Volatility Targeting methods.
- Simple Volatility Targeting uses simple volatility calculated as 20-day standard deviation of daily returns. Then target volatility is set as an average of past volatility (expanding the window from the start of the sample). After that, we calculate leverage as target volatility divided by the actual 20-day volatility; however, the maximal leverage we use is capped at two.
- EWMA Based Volatility Targeting is very similar to Simple Volatility Targeting. The main difference between the two approaches is that simple volatility targeting gives equal weights to all returns. On the other hand, EWMA (Exponentially Weighted Moving Average) volatility targeting gives higher weight to the most recent return and smaller weight to the more distant return.
- And lastly Momentum Based Volatility Targeting which is a conditional method based on a simple idea of momentum. Firstly, we create three simple volatility targeted portfolios, the same way we did in the first method, with different horizons (The horizons we picked are 21 days, 63 days and 252 days). Secondly, we calculate the 6-month performance of each of these portfolios. Lastly, once a week, we pick the portfolio with the best 6-month performance as our new volatility targeted portfolio.
The following tables show how would these volatility targeting methods change the performance of our strategy if we applied them.
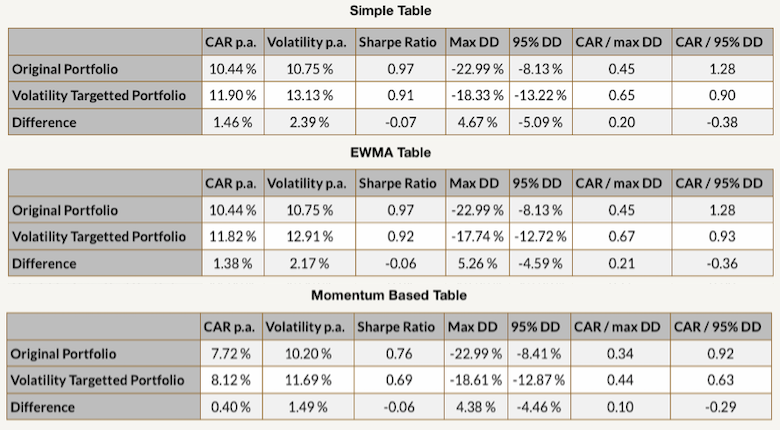
Unfortunately, neither of the volatility targeting methods improve our portfolio’s performance in this particular case.
Improving Performance During Crisis Periods
Last but not least, we can take a look at our portfolio’s performance during crisis periods. There are two tools, that deal with crises: Crisis Hedge Strategies and the Crisis Analysis tool.
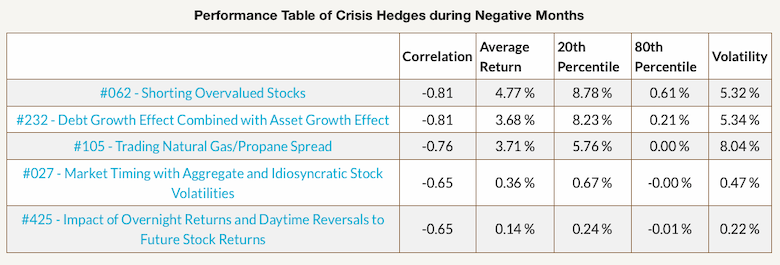
Firstly, let’s take a look at the Crisis Hedge Strategies tool. The report is split into two sections: “negative months hedges” and “bear markets hedges”. The first section helps you to identify periods when your model portfolio experienced negative monthly performance, shows performance distribution during these periods, and then suggests five ideas for trading strategies with the lowest downside correlation that can act as a short-term Crisis Hedge. Let’s look at the proposed strategies.
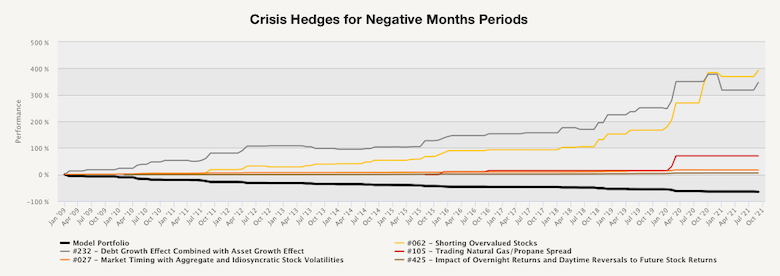
From the performance table of the proposed ideas, we can see their return during negative months. The first three models seem like an interesting addition to our portfolio if we want to have less risk in negative months.
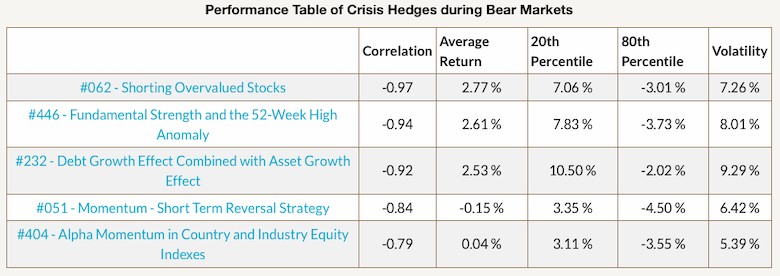
The second section helps to identify periods when the model portfolio experienced bear markets, defined as periods during which the equity curve of our model portfolio is under the 12-month moving average. The report then shows performance distribution and again suggests five ideas for trading strategies with the lowest downside correlation that can act as a “Crisis Hedge” in bear markets. Let’s look at the proposed strategies.
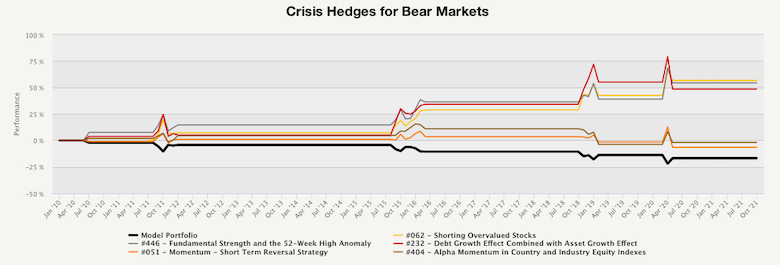
As we can see, the first three ideas again seem like an interesting pick for further investigation.
Secondly, let’s analyze our portfolio during short- and long-term crisis periods with the Crisis Analysis tool. Because the AOR ETF was created in 2009, we do not have data for all offered periods (report shows all relevenat crisis since 2000).
What we can do, in addition to analyzing the crisis periods by themselves, is to compare the 100% AOR portfolio with the 90% AOR + 10% Reversal During Earnings-Announcements (Strategy 307 in the Screener). The Complementary Strategies report suggested this idea so let’s investigate how our amendment improves the performance of the original portfolio in selected periods.
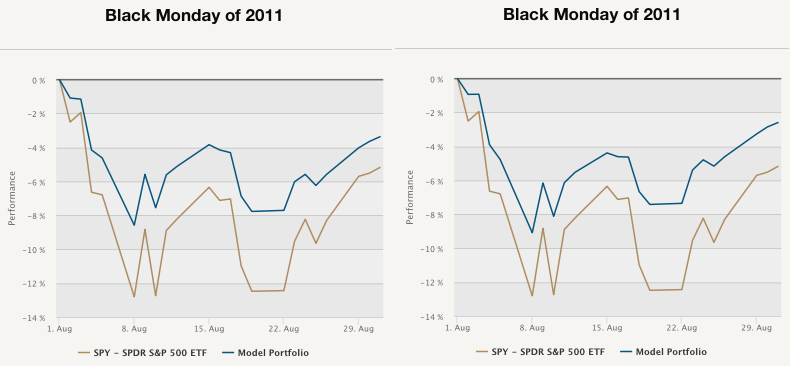
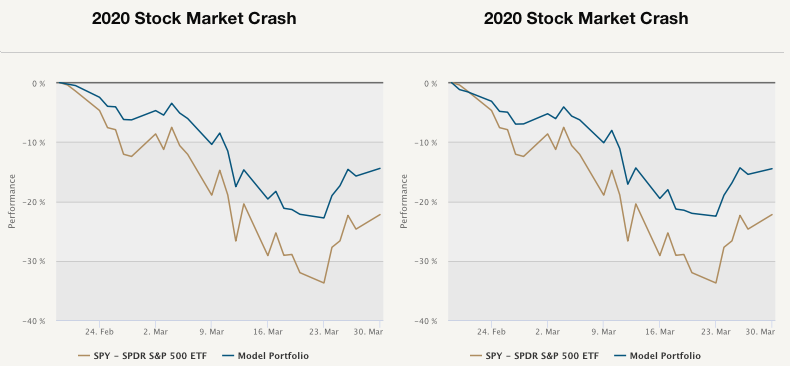
Let’s take a look at a few of the short-term crisis periods and compare the performance of the two portfolios. The first time that the United States sovereign debt got downgraded from AAA, or “risk-free”, to AA+ by S&P Global Ratings was the Friday before the Black Monday of 2011. As we can see, our portfolio (on the left) performed worse compare to the 90/10 portfolio (on the right).
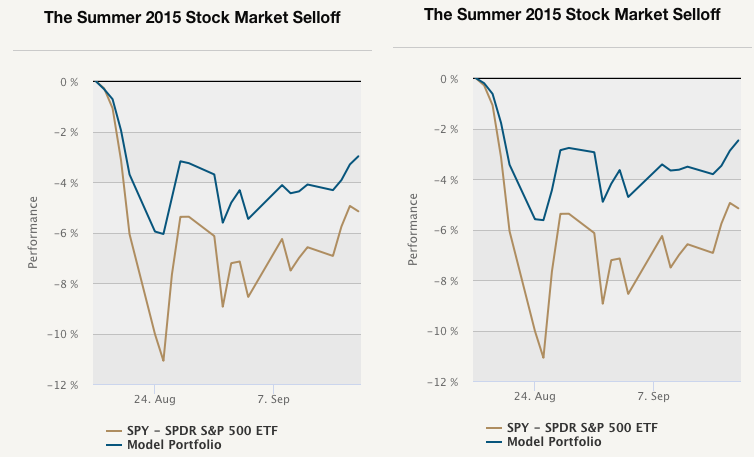
Another short-term crisis was in the summer of 2015. This crisis was a part of a greater crisis starting in June 2015 with the Chinese Stock Market Turbulence and ending in 2016 with the United Kingdom European Union membership referendum. However, the most significant drawdowns occurred in the summer of 2015. On August 24, world stock markets were down substantially, erasing all profits made earlier that year. Once again, our portfolio’s performance is improved. The performance of the original portfolio (on the left) is worse compare to the 90/10 portfolio (on the right).
The last short-time crisis that we mention is the most recent one. The 2020 Stock Market Crash was a consequence of the various measures, including lock-downs, that were put in place to slow the spread of the COVID-19 virus in February of 2020. From 24 to 28 February, stock markets reported their largest one-week declines since 2008. As we can see, this decline hit our portfolio (on the left) as well; however, the 90/10 portfolio performed just ever so slightly better.
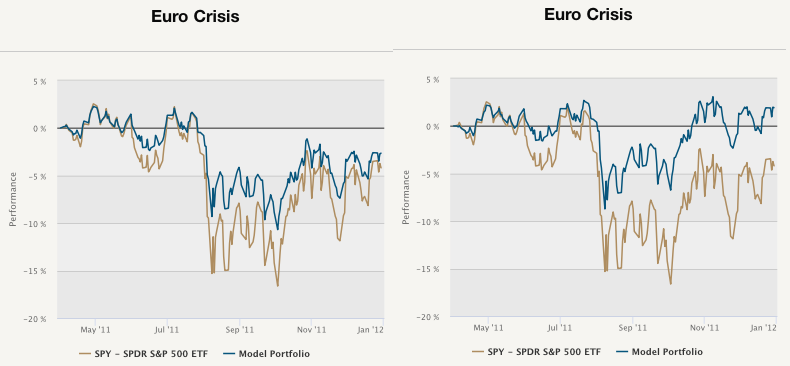
Now let’s analyze a few examples of the long-term crisis periods and compare the performance of the two portfolios. The first long term crisis that we have complete data for is the Euro crisis. When the 2007-2008 U.S. recession became global, Greece was disproportionally affected because of its industry’s focus. Because of Greece’s massive budget deficit in 2009, investors started to demand higher interest rates, leading to an even higher budget deficit. In combination with the heightened interest rates in numerous other European countries, this cycle eventually led to the Euro Crisis in 2011. The following charts present how would our portfolio have behaved (on the left) compare to the 90/10 portfolio (on the right). As we can see, the performance would have improved significantly.
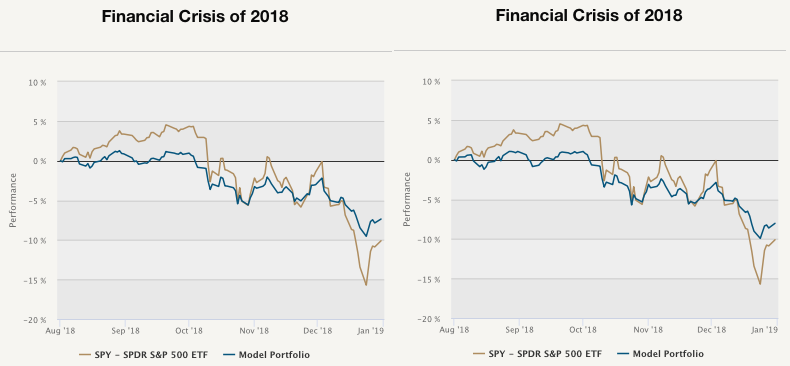
Another long-term crisis happened in 2018. A combination of U.S.-China trade tensions, central banks stopping the supply of money and easing growth in former hot spots had the consequence of the major US stock indices having their worst annual performance since the Financial crisis of 2007-2008. In this case, our portfolios performance (on the left) was just slightly improved when we analyzed the 90/10 portfolio (on the right).
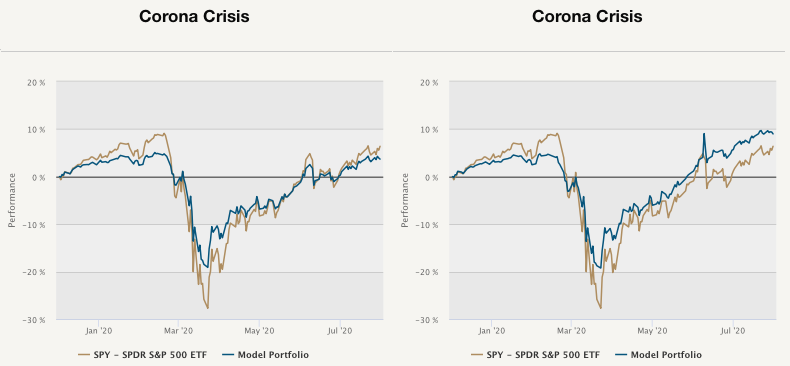
Once again, the last long-time crisis we mention is the most recent one. The Corona crisis impacted all sides of social life. Starting in February 2020, the COVID-19 virus began to spread to the world. Various measures were put in place, which shook the growth prospects of the global economy. The following graphs present the performance of our portfolio (on the left) and the 90/10 portfolio (on the right). As we can see, the performance of the 90/10 portfolio is significantly better compare to the original portfolio. Additionally, he 90/10 portfolio outperformed the SPY benchmark during this crisis.
As we can see, our quick example of adding 10% Reversal During Earnings-Announcements (Strategy 307 in the Screener) would have increased the performance or lowered the drawdowns in all of the abovementioned crisis periods.
Author:
Daniela Hanicova, Quant Analyst, Quantpedia
Are you looking for more strategies to read about? Sign up for our newsletter or visit our Blog or Screener.
Do you want to learn more about Quantpedia Premium service? Check how Quantpedia works, our mission and Premium pricing offer.
Do you want to learn more about Quantpedia Pro service? Check its description, watch videos, review reporting capabilities and visit our pricing offer.
Do you want algorithmic access to the full Quantpedia database via the API? Subscribe to Quantpedia Pro, ask for an API key, and explore the in/out-of-sample statistics, source academic papers, and code snippets — ideal for quantitative research, systematic trading workflows, and AI model training.
Are you looking for historical data or backtesting platforms? Check our list of Algo Trading Discounts.
Or follow us on:
Facebook Group, Facebook Page, Telegram, Twitter, Linkedin, Medium or Youtube
Share onLinkedInTwitterFacebookRefer to a friend


