As we have mentioned several times, the best course of action for a quant analyst who wants to develop a new trading strategy is to understand a well-known investment anomaly/factor fundamentally and then improve it. Quantpedia is a big fan of transferring ideas derived from academic research from one asset class to another. But that’s not the only possibility of improvement – we can try to embrace Ibbotson, Idzorek, Kaplan, Xiong’s theory of popularity, which states that popular assets/securities are usually overpriced compared to less-known (exotic) assets/securities. Additionally, more professional investors usually follow popular assets, and this market segment is probably significantly more efficient.
So, we went in this direction. We took a well-known commodity momentum factor strategy and investigated its performance among commodity futures that were part of the S&P GSCI respectively BCOM commodity indexes and then compared the strategy’s performance with a variant that traded only non-indexed commodity futures. As we had expected, the trading strategy using exotic assets performed significantly better.
Theoretical introduction
Ibbotson, Idzorek and Kaplan’s popularity asset pricing model (later actualized in the following paper) is closely connected to an illiquidity premium. The relationship between instrument liquidity and its return is widely known and theoretically well-founded. Yakov Amihud (Amihud, 2002) and other earlier studies show that the expected market illiquidity positively affects excess return in the stock market. This outperformance of less liquid assets is called illiquidity premium. However, the instrument expected returns are increasing in illiquidity, not only in the equities market.
As Zhi Da stated, the current market trend in financialization did not leave behind the commodity market (Da, 2020). So we can compare non-indexed and indexed commodity futures contracts to show how the additional performance enhancement could be obtained without increased risk at all.
The index trading generates non-fundamental noises to indexed commodities, causing price overshoots and subsequent reversals, whereas the non-indexed commodities do not suffer such liquidity connected anomalies. Moreover, Da’s research shows the divergence between return autocorrelation of indexed and non-indexed commodities. In the last years, the autocorrelation of the non-indexed commodities became slightly more positive, plus the indexed commodities’ autocorrelation transited to negative. Therefore, we can build on these autocorrelation findings and create enhanced momentum strategies.
Shane Wisdom also shows the advantages of investing in non-indexed commodities in the article Global Diversification: The Free Exotic Lunch, where the author ran 500 trend following strategies from which the ones including the non-indexed commodities (also called “Exotic”) outperformed the strategies made only from indexed commodities. Figure 1 contains the mentioned strategies plotted statistics showing the distinction between the two groups, favoring the “exotic” ones, which possess 13.8% CAGR on average compared to the indexed group’s 6.26%, resp. 22.2% Max Drawdown versus 29.9%.
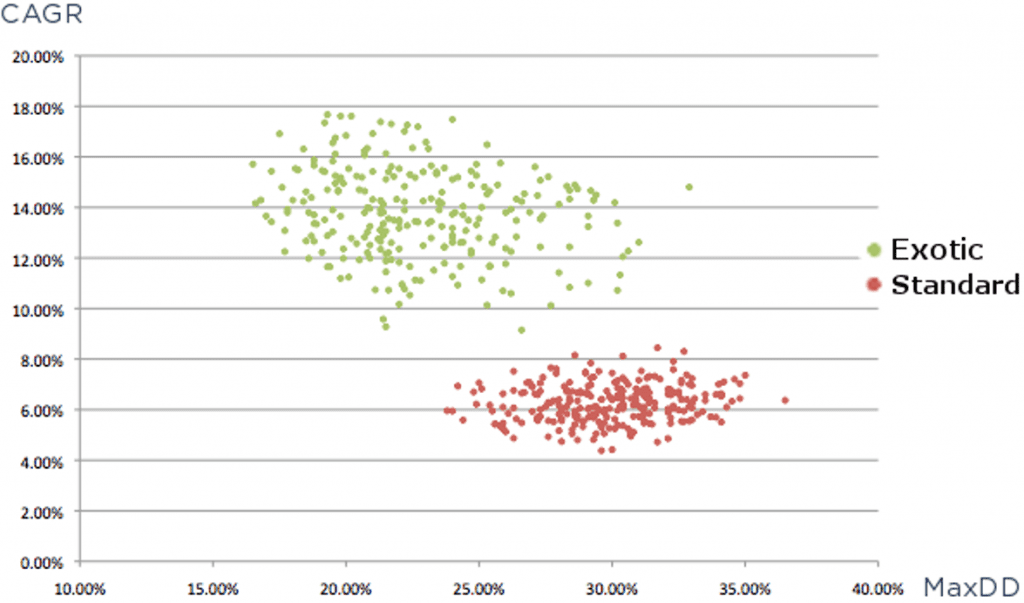
Figure 1 Non-indexed (“Exotic) and indexed (“Standard”) commodity strategies’ CAGR and Maximum Drawdown comparison
Data
We obtained 30 commodity futures’ daily time-series from Premium Data from January 1997 to May 2020, counting 5881 observations per contract. For the correct backtest, we use the first of month roll method and the backwards ratio (Vojtko & Padysak, 2019). We grouped these contracts based on their inclusion in S&P GSCI and BCOM commodity indexes into 3 groups:
- Contracts which are in both indexes (B),
- Contracts which are in one of the indexes (O),
- Contracts excluded from indexes (E).
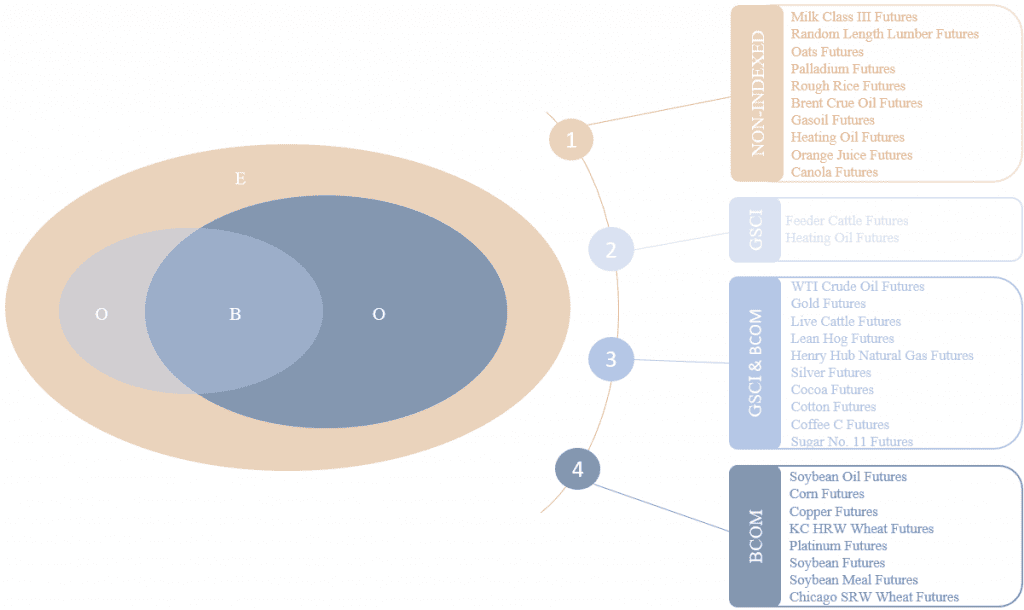
Figure 2 Commodities contracts groups
Model
Based on these groups, we made 5 momentum strategies to test our hypothesis and find where the premia come from more exactly as well. The rationale behind the momentum premia is mentioned in Financialization and Commodity Market Serial Dependence (Da, 2020) which documents the rising positive autocorrelation of non-indexed commodities while the indexed commodities’ autocorrelation transit to negative territory. Therefore, we expect the momentum strategies containing non-indexed commodities EI and OEI to outperform the ones containing only indexed commodities. Moreover, we could expect a negative performance from the latter what the negative autocorrelation suggests. The five strategies contain commodity futures contracts as stated below:
- BI – contracts in Both Indexes (10 contracts),
- OI – contracts in only One Index (10 contracts),
- EI – contracts Excluded from Indexes (10 contracts),
- BOI – contracts in Both or One Index (20 contracts),
- OEI – contracts in One Index or Excluded from the Indexes (20 contracts).
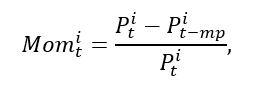
We built our set of momentum strategies as simple as buying (selling) futures contracts with momentum in the highest (lowest) quintile within every of five groups. Selected contracts are weighted equally in each strategy – 25% for BI, OI, EI resp. 12.5% for BOI, OEI. Rebalancing and sorting contracts into quintiles are made on a monthly basis at the beginning of every month. For simplicity, we used a yearly (252 days) momentum period, so the calculation for asset i follows:
| Do you want to test these ideas yourself? We offer our readers Historical Trading Data Discounts. |
where the Mom,i,t is the momentum for asset i at the time t and mp is the momentum period. The yearly momentum ranking period and monthly rebalancing is selected by the results of the research by Miffre, who tested various ranking periods ranging from 1 to 12 months combined with the same testing range for holding periods (Miffre & Rallis, 2007).
Results
The results of the strategies are encouraging as they satisfy our hypothesis that non-indexed contracts should perform better. As shown in Figure 3 and following Table 1, the EI strategy, which contains only commodities excluded from indexes and OEI containing EI commodities and commodities included only in one index, has a far better overall performance than the strategies composited only from indexed commodities. Though the EI and OEI are leading in terms of total return with 367.13% resp. 180.43%, they are not as good in terms of volatility with an annualized volatility of 14.08% resp. 12.10%. However, in terms of risk-adjusted return metric Sharpe ratio, they are matchless with similar values as reported in (Wisdom) – EI Sharpe ratio of 0.49 similar with their average exotic portfolio 0.53 and BI 0.15 with their average standard portfolio 0.17. The work from Zhi Da (Da, 2020) also provides similar results with the NIDX non-index commodity momentum strategy with a Sharpe ratio of 0.51, though the work was focused on short-term momentum.
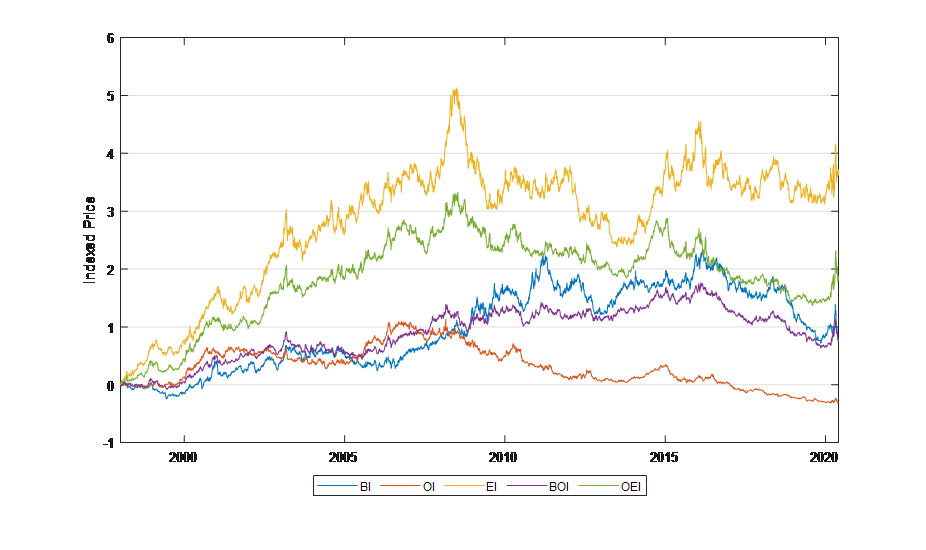
Figure 3 Indexed performance of selected momentum strategies
BI – contracts in Both Indexes (10 contracts),
OI – contracts in only One Index (10 contracts),
EI – contracts Excluded from Indexes (10 contracts),
BOI – contracts in Both or One Index (20 contracts),
OEI – contracts in One Index or Excluded from the Indexes (20 contracts).
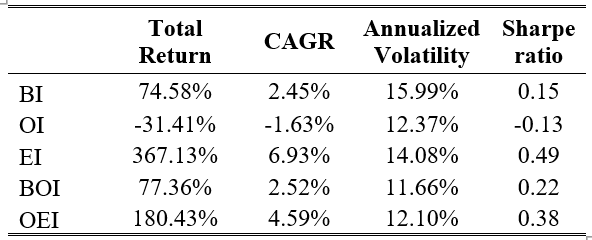
Table 1 Summary statistics of selected momentum strategies
Conclusion
This article intends to provide straightforward evidence of the advantages of investing in non-indexed commodity futures contracts rather than indexed ones. Provided theoretical research of autocorrelation, theory of popularity, illiquidity premium, and non-fundamental noises support the article’s hypothesis. As example, we ran a set of momentum strategies containing commodity futures contracts based on their inclusion in two leading commodity indices – S&P GSCI and BCOM. By 23 years of evidence, we clearly presented the advantages of non-indexed commodities inclusion in momentum strategy in terms of higher performance with almost the same risk compared to the indexed commodity strategies.
Author:
Dominik Cisar, Quant Analyst, Quantpedia
Are you looking for more strategies to read about? Sign up for our newsletter or visit our Blog or Screener.
Do you want to learn more about Quantpedia Premium service? Check how Quantpedia works, our mission and Premium pricing offer.
Do you want to learn more about Quantpedia Pro service? Check its description, watch videos, review reporting capabilities and visit our pricing offer.
Or follow us on:
Facebook Group, Facebook Page, Twitter, Linkedin, Medium or Youtube
Share onLinkedInTwitterFacebookRefer to a friend


