How to Utilize Anticipated ETF Rebalances
Passive investing enjoys substantial popularity and subsequently attracts the attention of researchers. We blogged about the boom of passive investing and market inelasticity in the past. However, the novel research by Li (2021) examines a different perspective. With the boom of passive investing, we are also witnessing a boom of index-tracking mutual funds, but especially index-tracking ETFs.
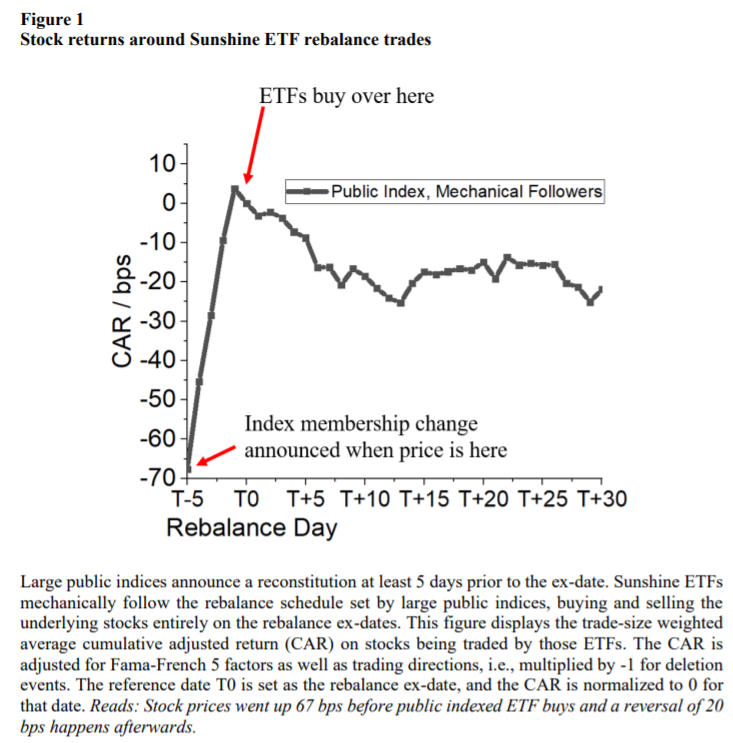
For many investors, passive investing can be a no-brainer and is suggested by many, especially those who think that the walk is random. However, it does not mean that the passive investors do not trade – the ETFs trade instead of them. The indexes that are being tracked are rebalanced to account for changes in the market cap, mergers, delistings, or IPOs. The novel research shows that it matters how the ETFs trade. The author recognizes three possible rebalancing strategies: sunshine trading, camouflaging when to trade, and camouflaging what to trade. In the first case, the ETFs track publicly available indexes that announce changes five days before rebalances. These ETFs react to the changes by adding or dropping stocks only on the close of index rebalancing days. Although transparent, it is costly because the stock prices tend to rise by 67 bps on average prior to rebalancing day. The second option is to camouflage when to trade, which perhaps allows more optimal trading that outperforms sunshine ETFs by 7.3 bps per year. The last option is to hide what to trade, in which case the ETFs are self-indexed and do not track public indexes. Consequently, ETFs are less transparent but more efficient. According to the research, costs to rebalance are 30 bps lower per trade for self-indexed ETFs compared to those tracking public indexes.
So what about the key takeaways? The passive investors “trade,” and it does matter how. Even though the differences are not that big, for a long-term horizon, the differences compound. For active traders, the paper shows that the rebalancing of the ETFs could be utilized by trading in advance.
Author: Sida Li
Title: Should Passive Investors Actively Manage Their Trades?
Link: https://papers.ssrn.com/sol3/papers.cfm?abstract_id=3967799
Abstract:
Using novel daily holding data for exchange-traded funds (ETFs), I identify three types of ETFs that adopt distinct approaches to rebalancing their portfolios, which generates meaningful return heterogeneity. First, 56% of ETFs track public indices that pre-announce their rebalances, and they trade entirely on reconstitution days at closing prices. Their large, uninformed trades pay 67 bps in execution costs, a figure that is three times higher than what is paid in similar-sized institutional trades. Second, 7% of ETFs spread out their trades across 10 days and save 34 bps per trade or 7.3 bps per year. Third, 37% of ETFs use self-designed indices to avoid pre-announcements of rebalancing stocks and save 30 bps per trade. The alternative rebalance schedule leads to a tracking error of 10.6 bps per year and an information ratio of 0.69. For a $2 million retirement account that accrues over 30 years, the transaction cost savings rise to $29 thousand at retirement.
As always we present several interesting figures and tables:

Notable quotations from the academic research paper:
“Passive investing, including the use of index mutual funds and exchange-traded funds (ETFs), has expanded greatly in the past two decades. Total assets under management (AUM) of index-tracking funds has reached $7 trillion, or 33% of the aggregate U.S. stock market capitalization as of 2020.
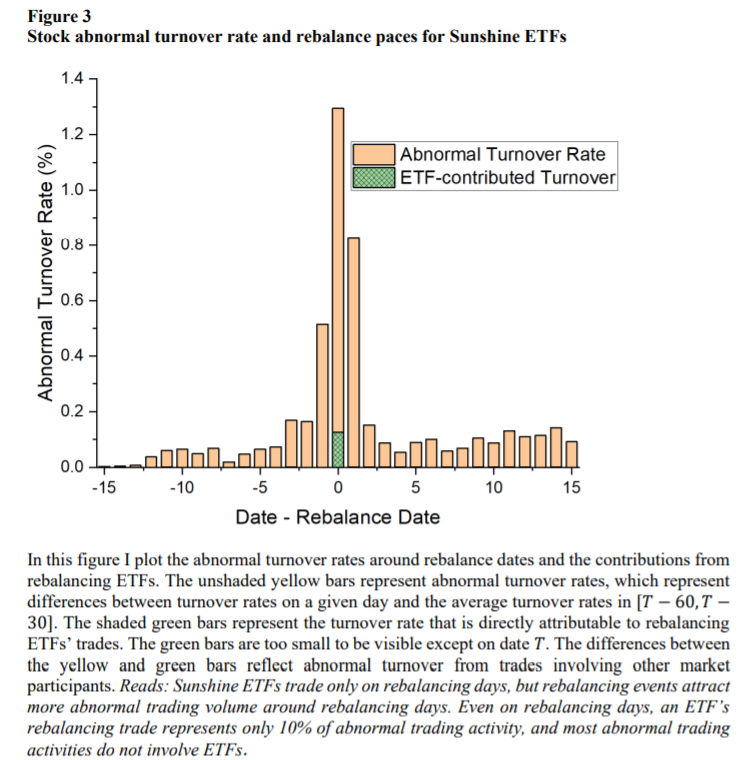
Passive investment strategies still require the funds to perform significant amount of trading in response to index constituent changes, initial public offerings, mergers, and delistings. Due to these factors, in 2020 the median portfolio turnover rate of U.S.-listed ETFs that track U.S. equity indexes was 16%. Therefore, even if an investor chooses to buy and hold an ETF, the ETF manager needs to trade on behalf of the investor. This paper first identifies three trading patterns of passive funds, and then evaluates the trading costs
of the different strategies. How do passive funds trade? How should they trade? I contribute to the literature by providing the first analysis of the trading decisions of passive funds.
Using a novel dataset of daily ETF holdings, I identify three types of ETF trading strategies: a “sunshine trading” strategy; camouflaging when to trade; and camouflaging what to trade. Most ETFs (56%) employ the “sunshine trading” strategy suggested by Admati and Pfleiderer (1991). These ETFs track publicly available indices that announce stock lists to be added or removed at least 5 days prior to rebalance dates. Moreover, these
ETFs trade by adding and dropping the announced stocks only on index rebalancing days. For added/removed stocks, the number of shares traded by the ETFs represents, on average, 1.14% of the daily trading volume associated with these stocks. Using daily reported portfolios, I calculate the hypothetical net asset value (NAV) returns on the ETFs had they rebalanced at the opening, intraday, or closing prices. Comparing the hypothetical NAVs
with the realized NAVs, I find that the sunshine ETFs trade exactly at the 4:00 p.m. closing prices, which are determined in the closing auction. Therefore, those ETFs’ trades are large, abrupt, not driven by informational advantages, and fully predictable.
The stock prices rise, on average, 67 bps during the 5 days prior to the index rebalance date. A price reversal of 20 bps then occurs within 20 days following the rebalance date. However, 67 bps is a large execution shortfall for orders representing 1.14% of Average Daily Volume (ADV). As a comparison, Anand et al. (2012) document an execution shortfall of 24 bps for institutional orders that averaged 2.4% of ADV, Di Maggio et al. (2019) document the price impact of 10.52 bps for 0.5% ADV orders, and Frazzini, Israel, and Moskowitz (2012) document a 13.00 bps execution shortfall for 1.2% ADV orders. Furthermore, the ETFs’ trades are not driven by private
information related to the underlying stocks, so the adverse-selection issue for liquidity providers is limited. Therefore, it is especially intriguing that there exists considerable room for sunshine ETFs to optimize their transaction costs.
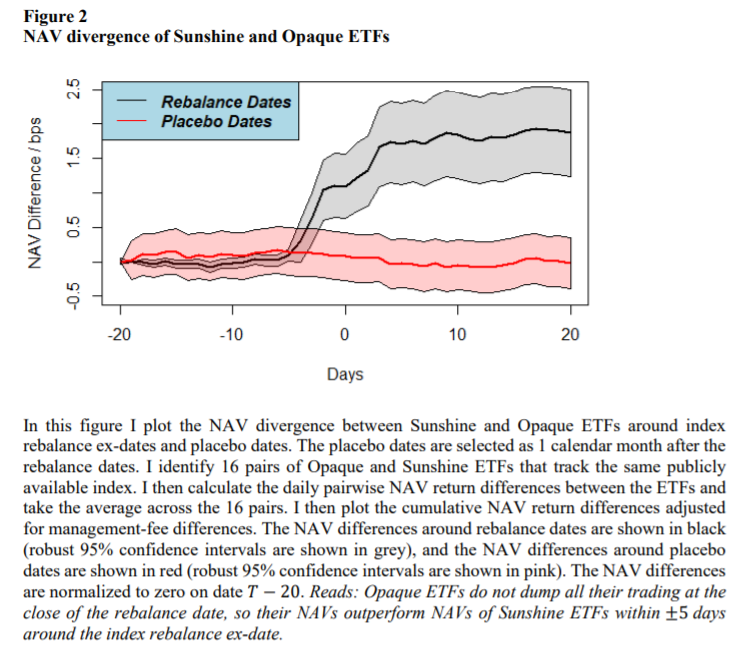
One type camouflages when it trades; and I call these “Opaque ETFs.” These ETFs report only their month-endportfolios, while other ETFs report their portfolio holdings on a daily basis. As a result, the pace at which Opaque ETFs trade is unknown to other investors, nor does the daily portfolio of Opaque ETFs appear in my data. Nevertheless, Opaque ETFs report their
NAVs on a daily basis, enabling me to compare their rebalance pace and performance with those of Sunshine ETFs. Specifically, I exploit the fact that 16 Opaque ETFs track an identical index with 16 corresponding Sunshine ETFs. These ETFs’ pairwise NAV correlation outside index rebalance windows is about 0.9999, as they track the same index, and their portfolios are almost identical. During quarterly index reconstitution periods,
however, their NAV correlation falls to 0.97. Thus, while the portfolios for the ETF pairs are largely identical outside the index rebalance windows, Opaque ETFs diverge from the index during the rebalance periods.
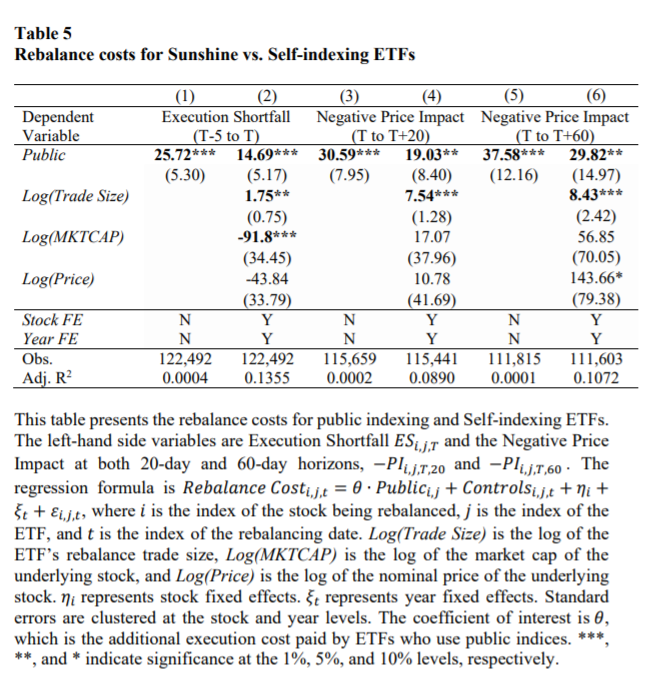
Another type of ETF that deviates from sunshine trading camouflages what it trades. Instead of using public indices, these ETFs invent their own indices to track (“Selfindexing” ETFs). For example, the Schwab 1000 ETF tracks the Schwab 1000 Index, which is 99% correlated with the S&P 500 index. Unlike S&P indices—or any other index from index companies such as FTSE Russell, MSCI, etc.—the Schwab 1000 Index does not offer subscriptions to external investors nor does it announce the stocks to be
rebalanced before a rebalance is executed. As a result, this ETF’s rebalancing trades are less transparent and less crowded. Indeed, I find that what I call Self-indexing ETFs’ rebalance cost is 30 bps-per-trade lower than the cost paid by ETFs that track publicly available indices. Considering the 16% average ETF turnover rate, the annual rebalance cost savings for these ETFs is 16% × 2 × 30 = 9.6 bps.”
Are you looking for more strategies to read about? Sign up for our newsletter or visit our Blog or Screener.
Do you want to learn more about Quantpedia Premium service? Check how Quantpedia works, our mission and Premium pricing offer.
Do you want to learn more about Quantpedia Pro service? Check its description, watch videos, review reporting capabilities and visit our pricing offer.
Do you want algorithmic access to the full Quantpedia database via the API? Subscribe to Quantpedia Pro, ask for an API key, and explore the in/out-of-sample statistics, source academic papers, and code snippets — ideal for quantitative research, systematic trading workflows, and AI model training.
Are you looking for historical data or backtesting platforms? Check our list of Algo Trading Discounts.
Or follow us on:
Facebook Group, Facebook Page, Telegram, Twitter, Linkedin, Medium or Youtube
Share onLinkedInTwitterFacebookRefer to a friend


