Less is More? Reducing Biases and Overfitting in Machine Learning Return Predictions
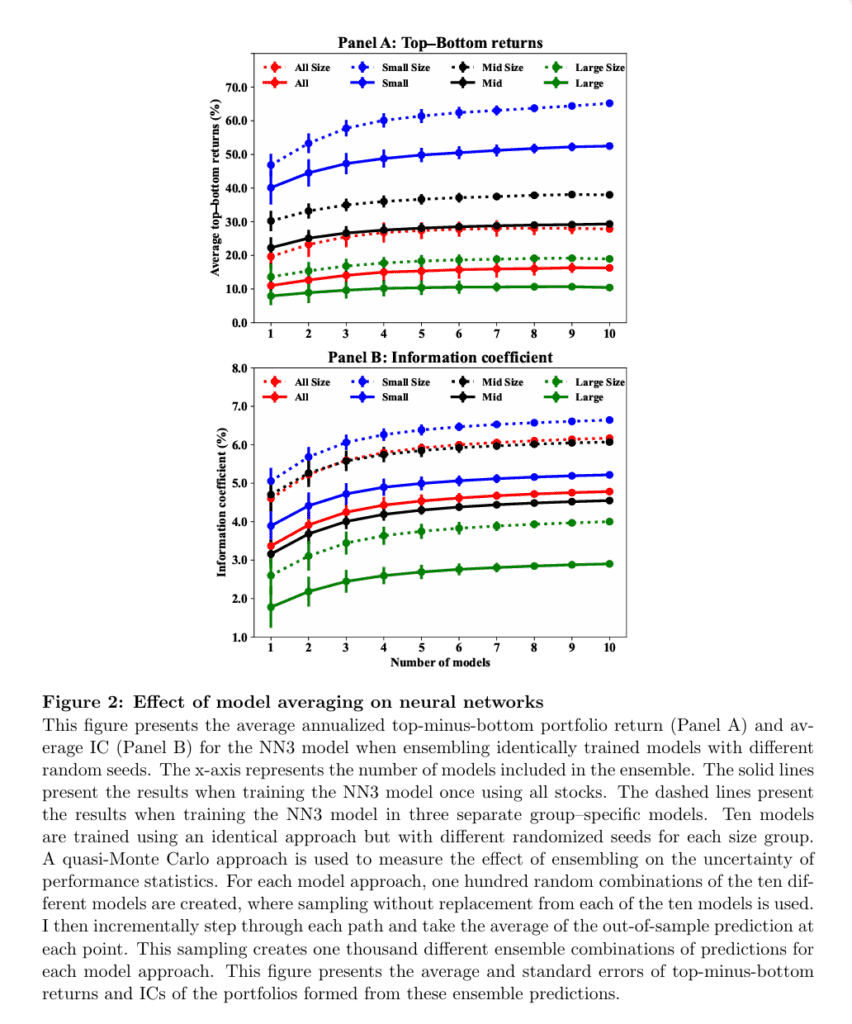
Machine learning models have been successfully employed to cross-sectionally predict stock returns using lagged stock characteristics as inputs. The analyzed paper challenges the conventional wisdom that more training data leads to superior machine learning models for stock return predictions. Instead, the research demonstrates that training market capitalization group-specific machine learning models can yield superior results for stock-level return predictions and long-short portfolios.
The author evaluates the performance of three models trained on non-overlapping groups of stocks based on their market capitalization (large, mid, and small-cap) and finds significant improvements in return predictions and portfolio performance. These findings have implications for both academics and practitioners in the field of finance, emphasizing the need for thoughtful model design and the potential benefits of group-specific modeling. The study also conducts simulations to assess the generalizability of these results beyond the U.S. market, further contributing to the literature on machine learning in asset pricing.
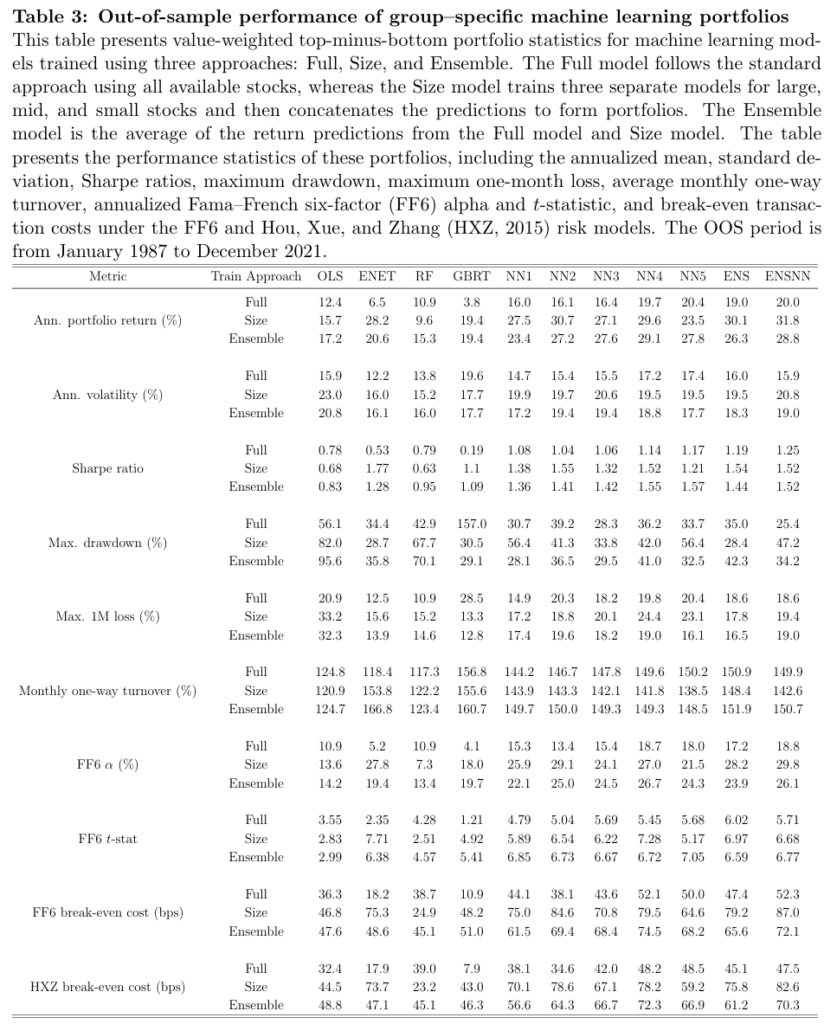
Table 3 provides an insightful comparison of long-short portfolios formed by sorting stocks based on their excess return predictions. These portfolios are held for one month and earn either value-weighted (VW) or equal-weighted (EW) returns. The table presents various key performance statistics for nine predictive models and two ensembles, comparing models trained on the full cross-section of stocks (Full), group-specific models based on market capitalization (Size), and an ensemble of both (Ensemble). The results from Table 3 consistently show that training on group-specific models (Size) leads to stronger portfolio characteristics. For the ensemble of all models, the annualized portfolio return increases significantly, from 20.0% for the Full model to 31.8% for the Size model. While this increase is accompanied by higher portfolio volatility, the Sharpe ratio also increases, indicating that the additional risk is compensated by the improved return. These findings underscore the effectiveness of group-specific modeling in enhancing portfolio performance, and this impact is not solely attributed to increased portfolio trading.
With no standard framework for model comparison, the research explores the complexity of machine learning modeling choices in asset pricing. By training group-specific machine learning models, the study demonstrates their superior predictive and portfolio performance when compared to models trained on the full dataset.
We also recommend reviewing Figure 3, which shows the relative importance of features when training in size categories. The figure gives a nice overview of what are important inputs in the ML model and is a good addition to Exhibits 4 and 5 from our previous blog that analyzed decreasing returns of machine learning strategies.
Author: Clint Howard
Title: Less is More? Reducing Biases and Overfitting in Machine Learning Return Predictions
Link: https://papers.ssrn.com/sol3/papers.cfm?abstract_id=4497739
Abstract:
Machine learning has become increasingly popular in asset pricing research. However, common modeling choices can lead to biases and overfitting. I show that group-specific machine learning models outperform models trained on a broader cross-section of stocks, challenging the common belief that more data leads to better machine learning models. The superior performance of group-specific models can be attributed to a lack of regularization of the target stock returns. Training on raw stock returns produces models that overfit to predicting the returns of smaller stocks, reducing the performance of value-weighted trading strategies. Simple adjustments to the target, such as removing the cross-sectional size–group median, produce similar economic gains as the group–specific models without the added computational cost. These findings emphasize the careful guidance required when designing and applying machine learning models for cross-sectional return prediction.
As always, we present several interesting figures and tables:
Notable quotations from the academic research paper:
“In designing and estimating machine learning models, I follow the general empirical setup
of Guet al. (2020). I use Chen and Zimmermanns (2022) Open Source Asset Pricing (OSAP)
database for monthly stock-level characteristics, and I do not include any macroeconomic
covariates in the study. In addition, I focus on group-specific machine learning models,
where I separately train machine learning models for diferent size-groups of stocks.
The outperformance of group-specific machine learning models poses a challenge to the
commonly held belief that more training data lead to superior performance of machine
learning models. To assess whether this anomaly is primarily a feature of the U.S. CRSP
data setting or a generalized result for machine learning models, I conduct a simulation study
using group-specific dependencies between simulated input features (stock characteristics)
and outputs (stock returns) and vary the levels of volatility and predictive efficacy within
these groups. I follow the basic DGP setup from Gu et al. (2020) with augmentations
that simulate a conditional dependence between covariates. The Appendix contains the full
details on the simulation approach.
Ultimately, we are interested in the practical usage of machine learning models for asset pricing and portfolio management purposes. The behavior of machine learning models
using simulated factor DGPs provides insights into the underlying mechanics but is limited in practical relevance. Through the simulation exercise, I found that neural network models
can over t groups of assets within the training dataset. Using this insight, I now conduct
empirical experiments to investigate how machine learning design decisions affect model performance and which design choices can reduce this group-specific overftting. In particular,
I focus on three critical areas of model design decisions: features, architecture, and target.
I make stylized choices within each category and analyze their impact on stock-level return
predictions and portfolio performance. I do not aim to cover every possible modeling decision but rather to explore the common representative choices observed in literature and
additional cases related to the group-specific model results. I exclusively focus on the NN3
model, given the higher propensity for overfitting of neural network architectures have for
overfitting compared with tree-based models.
Finance literature has only just begun to explore the application of machine learning models for predicting cross-sectional stock returns. There is no standard modeling frame work for comparing results across different studies. The high dimensionality of choices associated with machine learning modeling in asset pricing results in a high level of complexity in attributing performance gains related to changes to machine learning modeling approaches. This study contributes to the eld by training group-specific machine learning models and demonstrating superior predictive and portfolio performance compared with a model trained on the full dataset. By investigating various machine learning design choices, I reveal that a lack of regularization of the target variable primarily drives the outperformance of group-specific machine learning models. By implementing target variable regularization, the performance gains associated with group-specific machine learning models can be achieved at lower computational complexity.”
Are you looking for more strategies to read about? Sign up for our newsletter or visit our Blog or Screener.
Do you want to learn more about Quantpedia Premium service? Check how Quantpedia works, our mission and Premium pricing offer.
Do you want to learn more about Quantpedia Pro service? Check its description, watch videos, review reporting capabilities and visit our pricing offer.
Do you want algorithmic access to the full Quantpedia database via the API? Subscribe to Quantpedia Pro, ask for an API key, and explore the in/out-of-sample statistics, source academic papers, and code snippets — ideal for quantitative research, systematic trading workflows, and AI model training.
Are you looking for historical data or backtesting platforms? Check our list of Algo Trading Discounts.
Or follow us on:
Facebook Group, Facebook Page, Telegram, Twitter, Linkedin, Medium or Youtube
Share onLinkedInTwitterFacebookRefer to a friend


