Measuring Financial Investors Presence in Commodities
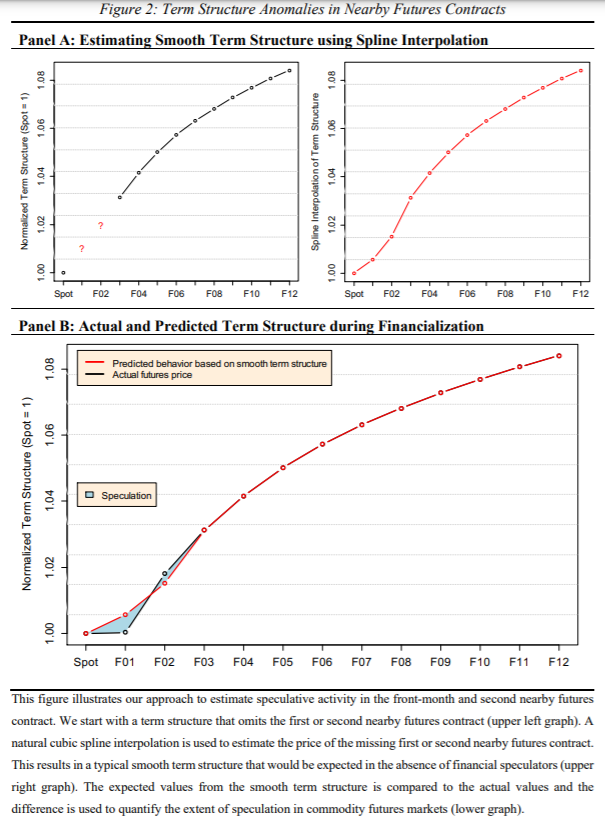
No doubt, the financialization in commodities was a significant breakpoint in markets and research as well. Many commodity strategies in Quantpedia’s screener are linked to financialization. It would be naive to think that the speculation in the commodity futures which has emerged did not influence the dynamics of the market. With the increased speculative trading, the Commodity Futures Trading Commission started collecting the net positions, but this dataset did not include all the data and often was connected with misreporting (and is not published anymore). The novel research paper of Adams, Collot and Rossi (2021) offers a different insight on this topic. It shows how to measure the influence using the term structure of commodity prices, focusing on crude oil. The authors suggest that during normal times, the term structure of crude oil futures should be smooth. They consider the term structure that starts with spot price and includes futures with one to twelve-month maturities, but they omit the one and two-month futures (since those are mostly used for speculation). The key finding is that when they estimate the missing futures based on the other prices using the smooth spline interpolation, this estimated term structure curve can be compared to the realized one. The deviation from the predicted (estimated) curve can be interpreted as the degree of speculation in commodity futures markets. As a result, with the mathematical modelling, the authors offer an interesting insight into speculation without any external datasets.
Authors: Zeno Adams, Solene Collot and Davide Rossi
Title: Measuring Financial Investor Presence through Term Structure Anomalies
Link: https://papers.ssrn.com/sol3/papers.cfm?abstract_id=3840857
Abstract:
We estimate the presence of financial investors in commodity futures markets from anomalies in the term structure. We argue that large-scale inflows from financial investors cause systematic deviations in nearby futures contracts that reflect excessive buying pressure in commodities. We compare this new speculation indicator with popular existing measures including reported CFTC data and the Hamilton and Wu (2014) risk premium. We find substantial financial investor presence in commodity markets from 2004 to 2014. We show that our new speculation measure is better in explaining the variation in oil return volatility than other existing measures.
As always we present several interesting figures and tables:
Notable quotations from the academic research paper:
“In this paper, we try to address this issue and propose a new measure of speculation in commodity markets that is not based on reported, but on revealed investor behavior. This new measure is based on the observation that large-scale inflows from financial investors into commodity markets is usually in the form of futures contracts. Retail investors typically buy
shares of commodity ETFs which in turn replicate the commodity returns by taking long positions in futures contracts with the same weights as the index. Large institutional investors such as pension funds and insurance companies tend to invest through commodity swap dealers which in turn hedge themselves through futures contracts. Both types of investors have in
common that the majority of the funds is replicating popular commodity indices such as the S&P GSCI Commodity index or the Bloomberg Commodity index. Given the size of the inflows, these indices continuously roll over hundreds of billions of US dollars on a monthly basis. The sheer size of the funds closing out the maturing front-month contract can push prices down during the roll period. At the same time, the price pressure on the new long positions of the next nearby contract can push prices up. This can lead to a kinked term structure with prices in front-month contracts that deviate from a smooth curve that is usually observed in the market.
| Algo Trading Promo Codes are available exclusively for Quantpedia’s readers. |
Consider a term structure that starts with the spot price, omits the following two nearby contracts F01 and F02, and ends with the 12-month contract F12. We use a natural cubic spline interpolation to estimate the omitted contracts F01 and F02. Based on economic theory, we conjecture that the term structure should be smooth in normal market times. The advantage of the spline interpolation is that it takes the smooth curvature of the term structure into account. For any given month, the estimated smooth term structure can be interpreted as the futures curve in the absence of price pressure from financial investors. The large-scale systematic closing of the front-month contract F01 during the roll period is pushing prices below the predicted curve, leading to a negative kink. At the same time, sudden demand for futures long positions when rolling over to the next nearby
contract F02 is leading to a positive kink in the term structure. We interpret the deviation of the actual futures price from the predicted one in the front-month contract plus the deviation in the second nearby contract as the degree of speculation in commodity futures markets.
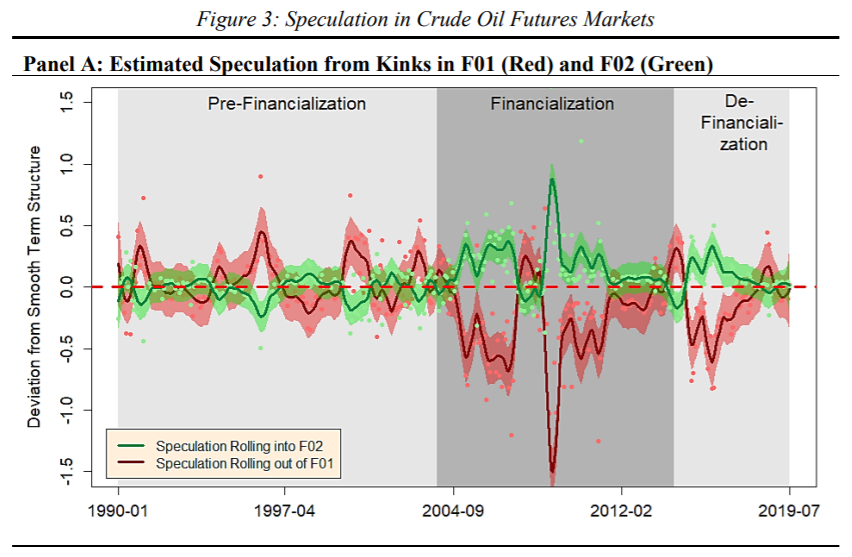
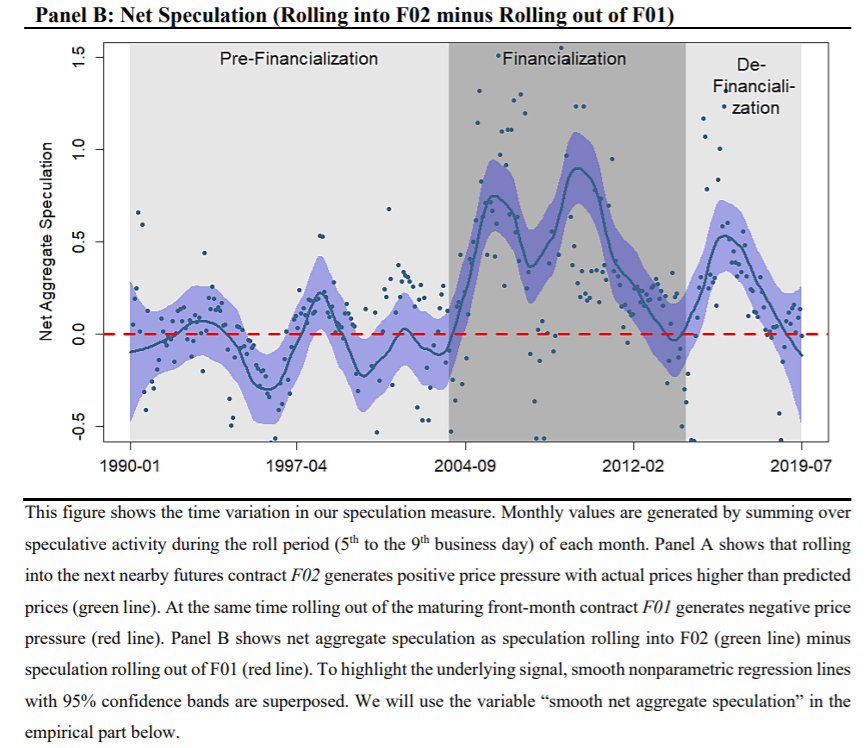
We show that during normal market times, the term structure of crude oil futures prices can be well approximated by a smooth curve. In contrast, during the 10-year financialization period from 2004 to 2014, observed first and second nearby futures prices deviate on average by 44 cents per barrel. During the roll period, financial investors are exiting the maturing front-month contract on a large scale which pushes prices below the smooth term structure. At the same time, the coordinated investments into the second nearby contract increases prices above the estimated smooth level.
The speculation measure presented in this paper replicates a number of regularities in the data that have been discussed in the financialization literature: no systematic speculation in the years prior to 2004. Distinct and statistically significant speculation during the financialization period, and positive but reduced speculation in the following de-financialization period. Our measure is easy to replicate and only requires the prices of individual futures contracts as input.”
Are you looking for more strategies to read about? Sign up for our newsletter or visit our Blog or Screener.
Do you want to learn more about Quantpedia Premium service? Check how Quantpedia works, our mission and Premium pricing offer.
Do you want to learn more about Quantpedia Pro service? Check its description, watch videos, review reporting capabilities and visit our pricing offer.
Do you want algorithmic access to the full Quantpedia database via the API? Subscribe to Quantpedia Pro, ask for an API key, and explore the in/out-of-sample statistics, source academic papers, and code snippets — ideal for quantitative research, systematic trading workflows, and AI model training.
Are you looking for historical data or backtesting platforms? Check our list of Algo Trading Discounts.
Or follow us on:
Facebook Group, Facebook Page, Telegram, Twitter, Linkedin, Medium or Youtube
Share onLinkedInTwitterFacebookRefer to a friend


