Novel Market Structure Insights From Intraday Data
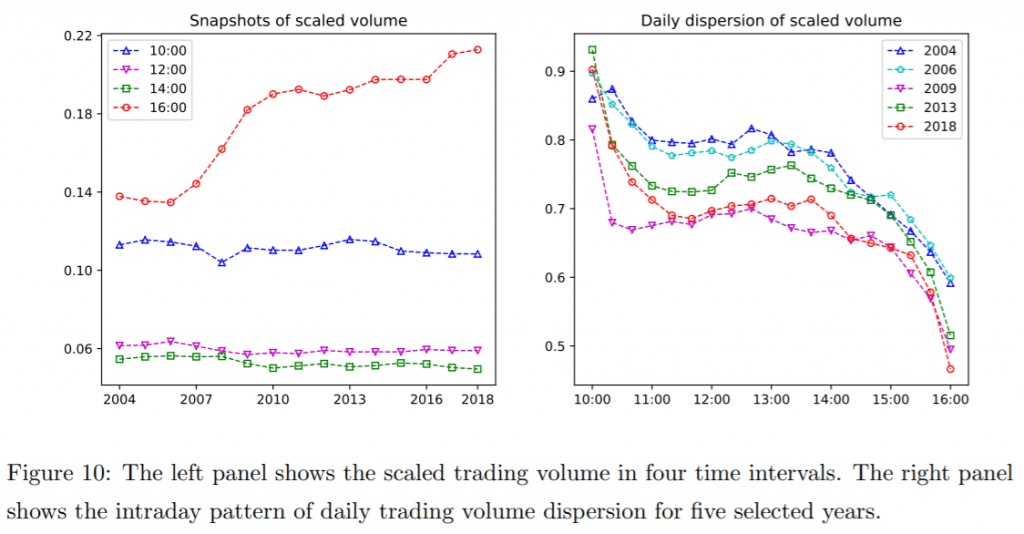
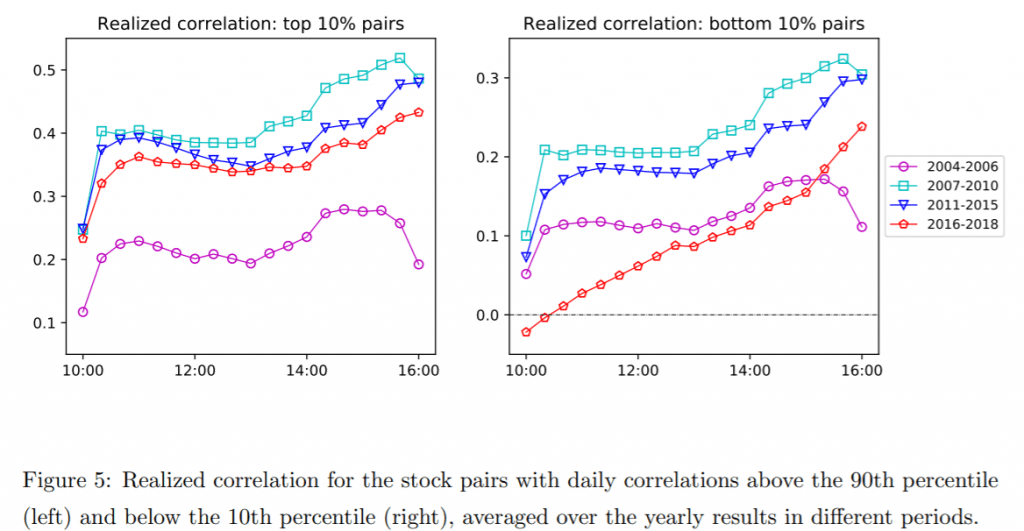
In recent years, financial markets have experienced a boom in passive and index-based strategies, which could have caused a change in the trading volume, volatility, beta or correlations. The reason is straightforward: the index investing causes a lot of stocks to move in the same direction. A novel research Shen and Shi (2020), using high-frequency data, suggests that over the last two decades, the patterns mentioned above have changed and the index investing is the cause. Both the trading volume and stock correlations are increased at the end of trading sessions. Betas are firstly dispersed, but in general, converge to one during the rest of the day. Trading volume has high dispersion at the market open, but low dispersion at the market close. Overall, the paper has many important implications for portfolio managers, risk managers and traders as well since it is closely related to the transaction costs, intraday stock price fluctuations, correlations or liquidity. Moreover, it is full of exciting charts that are worth seeing.
Authors: Yiwen Shen and Meiqi Shi
Title: Index-based Investing and Intraday Stock Dynamics
Link: https://papers.ssrn.com/sol3/papers.cfm?abstract_id=3696124
Abstract:
We investigate how the growth of index-based investing impacts the intraday stock dynamics using a large high-frequency dataset, which consists of 1-second level trade data for all S&P 500 constituents from 2004 to 2018. We estimate intraday trading volume, volatility, correlation, and beta using estimators that are statistically efficient under market microstructure noise and observation asynchronicity. We find the intraday patterns indeed change substantially over time. For example, in the recent decade, the trading volume and correlation significantly increase at the end of trading session; the betas of different stocks start dispersed in the morning, but generally move towards one during the day. Besides, the daily dispersion in trading volume is high at the market open and low near the market close. These intraday patterns demonstrate the implication of the growth of index-based strategies and the active-open, passive-close intraday trading profile. We theoretically support our interpretation via a market impact model with time-varying liquidity provision from both single-stock and index-fund investors.
As always, the results can be presented through interesting charts:


Notable quotations from the academic research paper:
“In this paper, we will show that the intraday patterns of US stocks have changed in important ways since 2004. For example, we find in the recent decade, the trading volume and correlation increase significantly near the market close; the betas of different stocks are dispersed in the morning, but generally move towards one throughout the day. These patterns demonstrate the substantial implications from passive investment, and more specifically, the index-based strategies.
We first use two empirical studies to provide evidence for the growth of passive investment and the intraday trading pattern of index-based strategies. In the first one, we find the stocks with high (resp. low) passive ownership have higher trading volume near the market close (resp. open). In the second one, we show the trading volume tends to drop dramatically near the market close after a stock is removed from the S&P 500 Index, thus less tracked by the index-based strategies. These findings suggest an active-open, passive-close intraday trading profile, i.e., more discretionary (resp. index-based) trading at the market open (resp. close). Such trading profile can have substantial impact on the intraday patterns of stock dynamics.
| What about Data? Look at Quantpedia’s Algo Trading Discounts. |
With the development of financial technologies, high-frequency data has been widely used in various fields of finance. However, estimators under high-frequency setting are often biased by market microstructure noise and observation asynchronicity. Besides, large-scale application of high-frequency data is inevitably hindered by heavy computational burden. Due to these reasons, most previous studies use a limited dataset (e.g., several stocks or indices over a short period) or employ ad hoc estimators that do not take market noise and asynchronicity into account. In this paper, we overcome these challenges with estimators that can be efficiently implemented on large set of stocks and account for both market microstructure noise and observation asynchronicity. Furthermore, the size of the dataset allow us to obtain the general intraday patterns of US stocks and examine how they evolve over time.
We estimate intraday correlation, beta, volatility, and trading volume with a large high-frequency dataset, i.e., 1-second level trade data for all S&P 500 constituents from 2004 to 2018. We find the intraday patterns indeed change over time. In the recent decade, the realized correlation starts low in the morning and increases near the market close; the realized betas of different stocks start dispersed and generally move towards one at the end of trading session. Besides, we find the trading volume is more volatile across days in the morning than that in the afternoon. These patterns confirm our hypotheses on the implication of index-based strategies, which have become more prevalent in the recent decade.”
Are you looking for more strategies to read about? Sign up for our newsletter or visit our Blog or Screener.
Do you want to learn more about Quantpedia Premium service? Check how Quantpedia works, our mission and Premium pricing offer.
Do you want to learn more about Quantpedia Pro service? Check its description, watch videos, review reporting capabilities and visit our pricing offer.
Do you want algorithmic access to the full Quantpedia database via the API? Subscribe to Quantpedia Pro, ask for an API key, and explore the in/out-of-sample statistics, source academic papers, and code snippets — ideal for quantitative research, systematic trading workflows, and AI model training.
Are you looking for historical data or backtesting platforms? Check our list of Algo Trading Discounts.
Or follow us on:
Facebook Group, Facebook Page, Telegram, Twitter, Linkedin, Medium or Youtube
Share onLinkedInTwitterFacebookRefer to a friend


