Overnight Sentiment and the Intraday Return Dynamics
Overnight and seasonality effects or analysis of sentiment are favorite themes in quantitative academic research. Novel and very recent research from Baoqing Gan, Vitali Alexeev, and Danny Yeung (August 2022) presents us with an opportunity to discover new findings related to both these phenomena. The main takeaway is that the accumulated sentiment from the overnight non-trading period can predict the next period’s intraday stock return.
The study is an example of the extraction of alpha signal from ‘alternative data‘ set – minute-to-minute overnight sentiment scores based on textual analysis of over two million blogs, internet message boards, and social and news media sites. Authors investigate subsequent daily price action in DJ 30 stocks. Overall, social media have a bigger possibility to change investors’ moods than news outlets. Most returns come from influence during the first minutes of opening, most likely through orders submitted at the pre-opening sessions. Results are consistent with findings from behavioral finance and display various psychological biases of traders.
The paper shows how people’s opinions during the time when US markets are not open: from the close of US markets at 4 pm to 9:30 am, influence computer’s algorithms afterward. Being aware of those implications can allow investors and traders to make the right decisions in the morning during their working session and step into the day on the right foot.
Authors: Baoqing Gan, Vitali Alexeev, and Danny Yeung
Title: Moods on the Move: Overnight Sentiment and the Intraday Return Dynamics
Link: https://papers.ssrn.com/sol3/papers.cfm?abstract_id=4184707
Abstract:
Employing high-frequency sentiment metrics from texts in social and news media, we find that moods accrued during nontrading hours explain subsequent price behaviour of stocks at the market opening. We find stronger effects from social media compared with the news. We show that highly positive (negative) overnight tonality in social media results, on average, in 4.75% (-4.99%) excess returns annually. Equivalently, for the news, these figures are only 2.5% and -3.05%. The effect is not subsumed by previous day price performance, nor is it driven by fundamental news such as earnings announcements. Our findings, consistent across a number of model and parameter specifications, establish an unexplored link between overnight sentiment and the opening return.
As always we present several interesting figures and tables:

Notable quotations from the academic research paper:
“Our study offers novel insights into the influence of news and social media on stock returns. We find that both social and news media sentiment help explain the price behaviour of stocks. The results indicate that overnight sentiment and returns on the following day are highly concordant, in other words, overnight media sentiment helps predict the next day opening return. The correlation coefficient between social media sentiment on days in the 1st and the 10th deciles and the corresponding cumulative abnormal returns (CARs) during the trading hours that follow is as high as 0.79, while similarly, for the news sentiment it is 0.57.6
To test the longevity of sentiment predictive power we, exclude price data during the first minutes of trading. We find that the impact of overnight sentiment on average cumulative returns absent the opening session is substantially diminished compared with the average cumulative returns during the opening session. Our results remain consistent when we exclude the first half hour, first hour and the entire morning session. In contrast to Aboody et al. (2018), which uses overnight return (close-to-open) as a proxy of firm-specific sentiment, our findings based on textual analysis of individual stock sentiment do not indicate overnight sentiment persistence.
Tracking minute-by-minute changes in Cisco’s social and news media tonality and stock prices, Figures 2 and 3 demonstrate the dynamics between the sentiment accrued overnight and the asset returns during the trading period that ensues. Specifically, on each trading day, we obtain cumulative overnight sentiment by aggregating 1-minute sentiment scores from the first minute past the market closure on the previous trading day and leading up to market open on the current day. The overnight cumulative sentiment series are then sorted into deciles representing the set of days with the most negative and positive overnight sentiment denoted by D1 and D10 , respectively. Consequently, the average cumulative sentiment series conditional on Dx (depicted on the left-hand side) appear in descending order, by construction, where the most positive and negative sentiment are represented by blue and red curves, respectively. The right-hand side depicts the average cumulative abnormal returns corresponding to each sentiment decile and mapped to the same colour. The bootstrapped 99%, 95% and 90% confidence intervals around CARs are depicted by the grey-shaded bands and are based on the average CARs of n days randomly drawn M times from the entire sample unconditional on sentiment. We set n to match the size (in days) of each sentiment decile (i.e., the cardinality of Dx) and perform M = 2, 000 draws. The dashed black curves the average sentiment and CARs across all T days.
The difference between overnight and intraday returns is of considerable interest. It brings to light the issues concerning the efficient market hypothesis, the process by which information is reflected in stock prices, as well as the relative merits of auction versus continuous trading. Many find overnight and intraday returns behave entirely differently, and overnight returns tend to outperform intraday returns. Specifically, Cooper et al. (2008) suggests that the US equity premium over the period 1993-2006 is solely due to overnight returns. This effect holds for individual stocks, equity indexes and futures contracts on equity indexes across the NYSE and Nasdaq exchanges. The authors find that overnight returns are consistently higher than intraday returns across days of the week, days of the month and months of the year, and argue that this effect is driven in part by high opening prices which subsequently decline in the first hour of trading. Similarly, for broad-based index exchange-traded funds, Kelly and Clark (2011) finds the overnight returns are on average larger than the intraday returns. In contrast, we find that on days with the most negative overnight sentiment, the overnight return is significantly lower than on any other days.
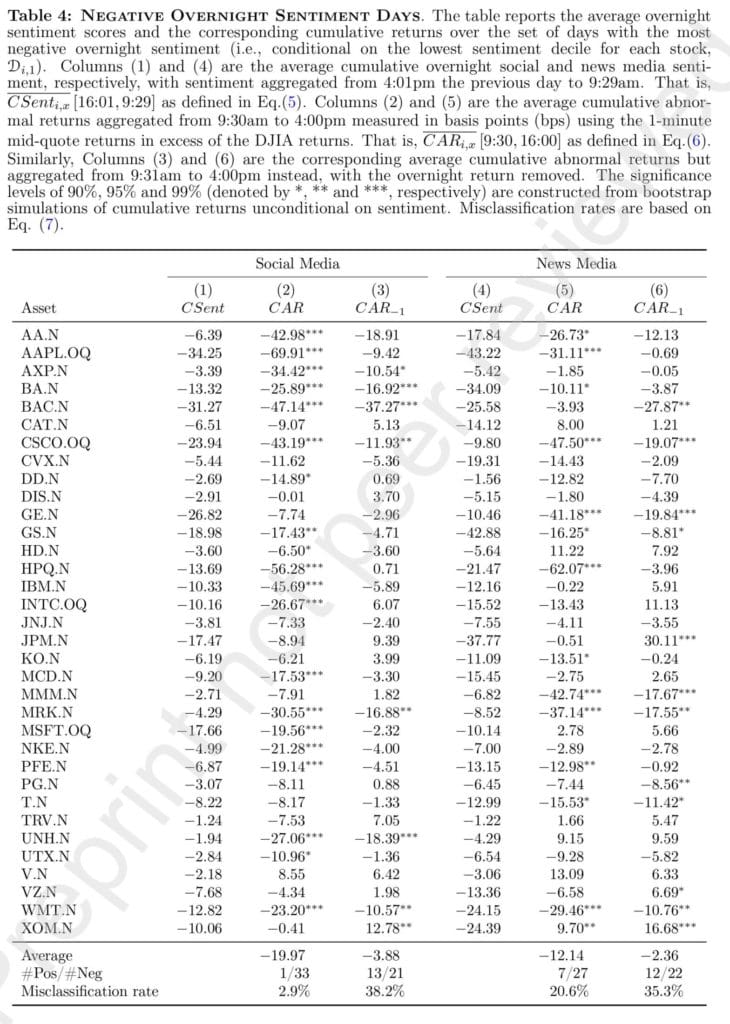
Our analysis of the remaining stocks reaffirms the absence of any discernible patterns between the intermediate overnight sentiment deciles and the associated CARs. Accordingly, in Tables 3 and 4, we report the results for the set of days in the two extreme sentiment deciles only. The average cumulative social and news media sentiment accrued overnight is reported in Columns (1) and (4).20 The rest of the columns represent returns conditional on sentiment. Specifically, Columns (2) and (5) are the average cumulative abnormal returns aggregated from 9:30am to 4:00pm measured in basis points (bps) using the 1-minute mid-quote returns in excess of the DJIA returns. Similarly, Columns (3) and (6) are the corresponding average cumulative abnormal returns but with the overnight return removed.21
It is helpful to appreciate this impact by considering annualised returns. Considering the top and bottom sentiment deciles, the number of effective trading days for each decile in a given year is 25. The average daily figures reported in bps in Tables 3-4, translate to average annualised excess returns of 4.75% for social media and 2.5% for the news when conditioned on highly positive sentiment tonality. Equivalently, the average annualised excess returns conditional on highly negative tonality are -4.99% and -3.05% for social media and the news, respectively. While the social media based strategy, on average, remains more prominent, the gains are substantially lower when the overnight returns are excluded.
The intraday social media sentiment pattern tends to be consistent with daily routines. Following market closure and up to midnight, we observe a rapid build-up in social media sentiment. After midnight, social media activity subsides due to a lack of postings on social media platforms with the majority of users presumably asleep. As a result, the cumulative social media sentiment flattens as shown in the top panel of Figure 6. From around 7:00am, social media sentiment resumes its trend until the market opens. This is in striking contrast with the pattern observed for news media sentiment in the bottom panel of Figure 6.25
In analysing the impact of overnight sentiment on daily returns, we find that the signal capturing information transmission from investor sentiment to asset returns is strongest on the days with heightened sentiment and that such signal is less contaminated by noise when based on social media rather than news media. Therefore, sentiment based on social media carries stronger predictability than news media derived sentiment. Furthermore, negative sentiment has a greater effect on the next day’s opening return than positive sentiment for both social and news media.”
Are you looking for more strategies to read about? Sign up for our newsletter or visit our Blog or Screener.
Do you want to learn more about Quantpedia Premium service? Check how Quantpedia works, our mission and Premium pricing offer.
Do you want to learn more about Quantpedia Pro service? Check its description, watch videos, review reporting capabilities and visit our pricing offer.
Do you want algorithmic access to the full Quantpedia database via the API? Subscribe to Quantpedia Pro, ask for an API key, and explore the in/out-of-sample statistics, source academic papers, and code snippets — ideal for quantitative research, systematic trading workflows, and AI model training.
Are you looking for historical data or backtesting platforms? Check our list of Algo Trading Discounts.
Or follow us on:
Facebook Group, Facebook Page, Telegram, Twitter, Linkedin, Medium or Youtube
Share onLinkedInTwitterFacebookRefer to a friend


