Performance of Factor Strategies in India
India is a big emerging market, actually the second biggest after China. We primarily look at developed markets, mostly the U.S. and Europe, and from Emerging Markets, China at most, and we are aware that we neglect this prospective country. We would like to correct this notion and give attention to a country that is (along with China) being cited as a new potential rising superpower and already looking to take the lead of Emerging Markets (EM) countries. Today, we would like to review the paper that analyzes the performance of main equity factors (with an emphasis on the Quality factor) and is a good starting point to understand the specifics of factor investing strategies in India.
Jacob, Joshy and Pradeep, K P and Varma, Jayanth Rama (November 23, 2022) examine the performance of the quality factor and its components with stock data from India. Investigating the quality factor assumes significance in emerging markets, given the dominant role of group firms and a patchy history of corporate governance. While the overall regulatory norms and corporate governance standards have significantly evolved in India, enforcement of regulations remains an area of concern. The authors’ estimations suggest that both long-short (QMJ) and long-only (LQ) portfolios constructed with maximum exposure to quality factor generate economically and statistically significant monthly alphas. Over the 26 years period, the long-short quality factor generates an annualized four-factor alpha of more than 10%, which is nearly twice that estimated for the US market. Portfolios sorted with the quality score also have attractive drawdown features with significantly lower worst drawdown and drawdown periods compared to value, momentum, and market factors.
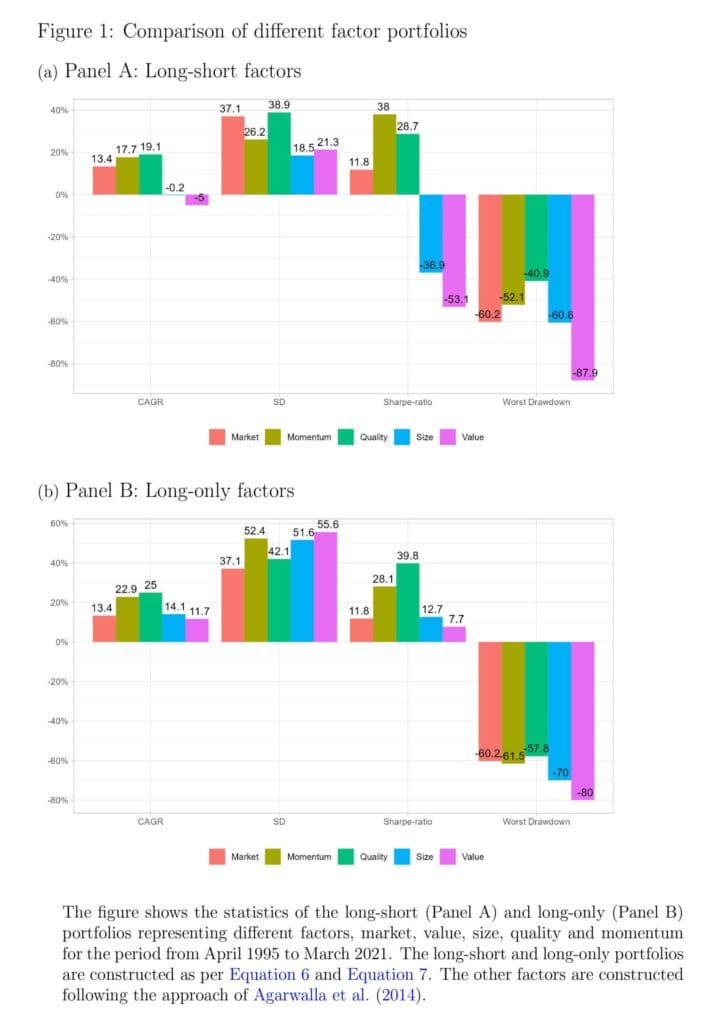
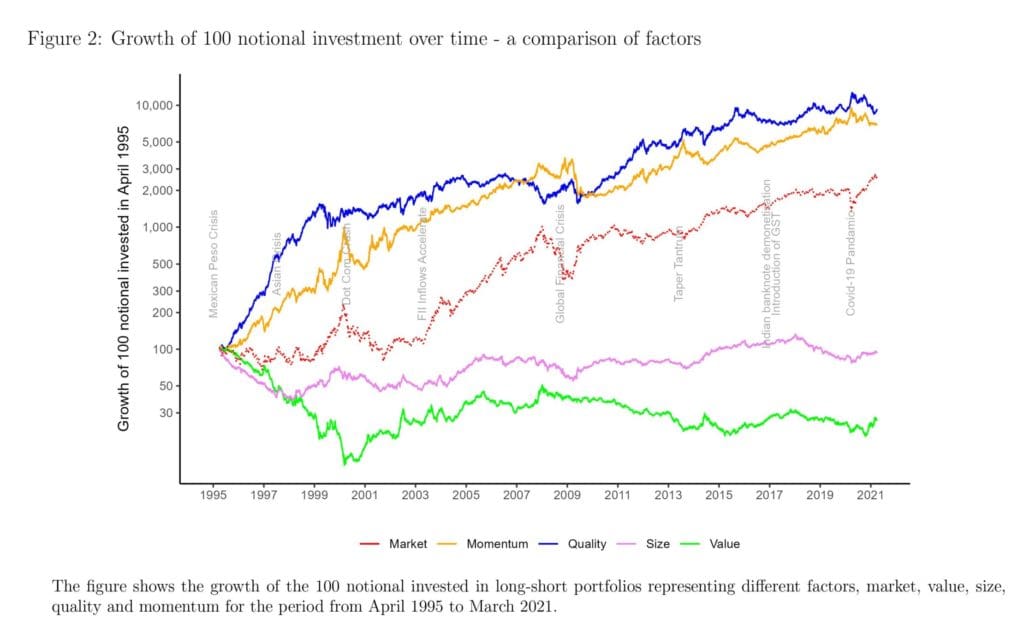
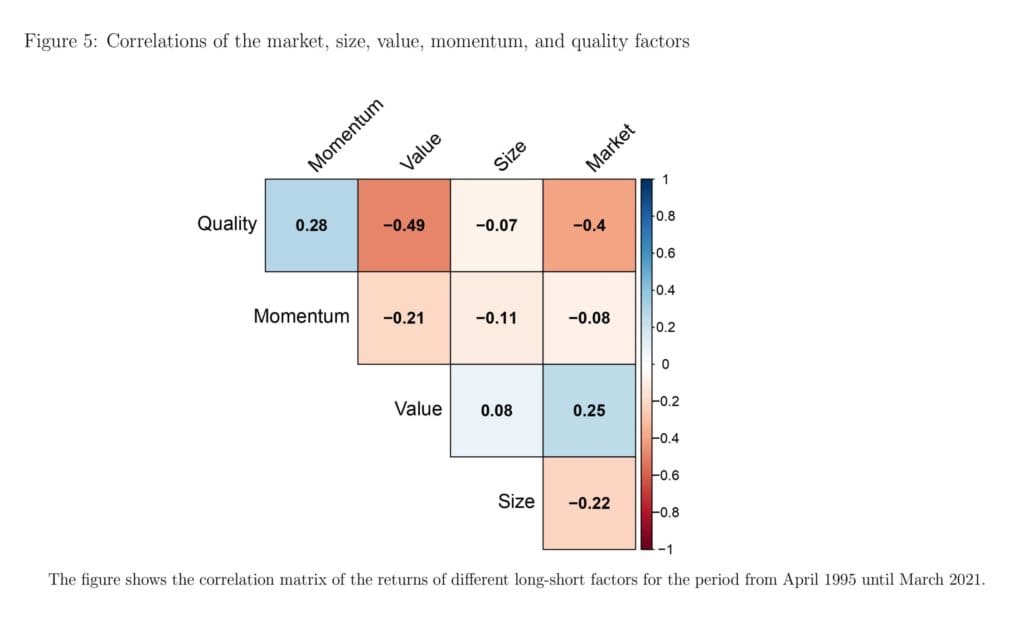
Figure 1a and Figure 1b compare the compounded annual growth rate (CAGR), the annual standard deviation of returns, Sharpe ratios, and the worst drawdown for the different factors. Figure 2 shows the growth of INR 100 notional invested in long-short portfolios of the different factors over a 26-year period from April 1995 to March 2021. The correlations across the factors are given in Figure 5. The excess returns and the estimated alphas of the different quality portfolios are given in Table 5.
Authors: Joshy Jacob and K P Pradeep and Jayanth Rama Varma
Title: Performance of Quality Factor in Indian Equity Market
Link: https://papers.ssrn.com/sol3/papers.cfm?abstract_id=4284686
Abstract:
We study the characteristics of Quality factor (QMJ) in India, which is the second largest emerging market. Dimensions of quality factor are impacted by the weaker enforcement of corporate governance norms in emerging markets. Diversion of revenues by promoters would result in poor profitability, while tunneling of profits would result in lower payout and lower growth. Therefore, investors are likely to attach greater significance to the quality dimensions in stock pricing. Consistent with this hypothesis, the Quality factor is even more important for asset pricing in India than in developed markets. The QMJ factor earns a four factor alpha of 0.92% per month, significantly outperforming the other widely employed factors, market, size, value and momentum factors. A long-only Quality factor earns an alpha of 0.69% per month. The alpha of quality factors is highly significant, judged by the thresholds recommended by Harvey, Liu, and Zhu (2016). The key drivers of the alpha are profitability and payout, which are both consistent with the tunnelling hypothesis. Besides the alpha, the low portfolio churn, lower risk, shorter drawdowns, and viability of long-only strategies restricted to large capitalization stocks suggest that portfolios tilted towards high-quality stocks are highly attractive to institutional and retail investors.
As always, we present several interesting figures and tables from the paper itself:
Notable quotations from the academic research paper:
“Investors and practitioners have favoured high-quality stocks for a very long time, at least since Graham, Dodd, Cottle, et al. (1934). The academic literature has also shown that stocks with high-quality characteristics earn higher returns. Novy-Marx (2013) show that firms with higher profitability, generate greater returns. Titman, Wei, and Xie (2004) demonstrate that firms that have excessive capital investments earn lower returns, particularly those with higher free cash flows. Both Black (1972) and Frazzini and Pedersen (2014) find that the relatively low-beta stocks (safe stocks) outperform their high-beta counterparts. Fama and French (2015) include two of these quality factors, profitability and investment, in their five-factor model. By contrast, Asness, Frazzini, and Pedersen (2019) combines several measures of firm-level quality into a single quality factor and create a ‘Quality Minus Junk’ (QMJ) factor that is long high-quality stocks and short low-quality stocks. They show that the QMJ factor earns positive alpha in 24 developed markets against Fama and French (1993) three-factor model as also the Fama and French (2015) five-factor model. This is all the more impressive because Fama and French (2015) five-factor model has two factors, RMW (a proxy for the return difference between high and low profitability stocks), and CMA (captures the return wedge between firms with high and low capital investment levels), that can be regarded as proxies for quality.
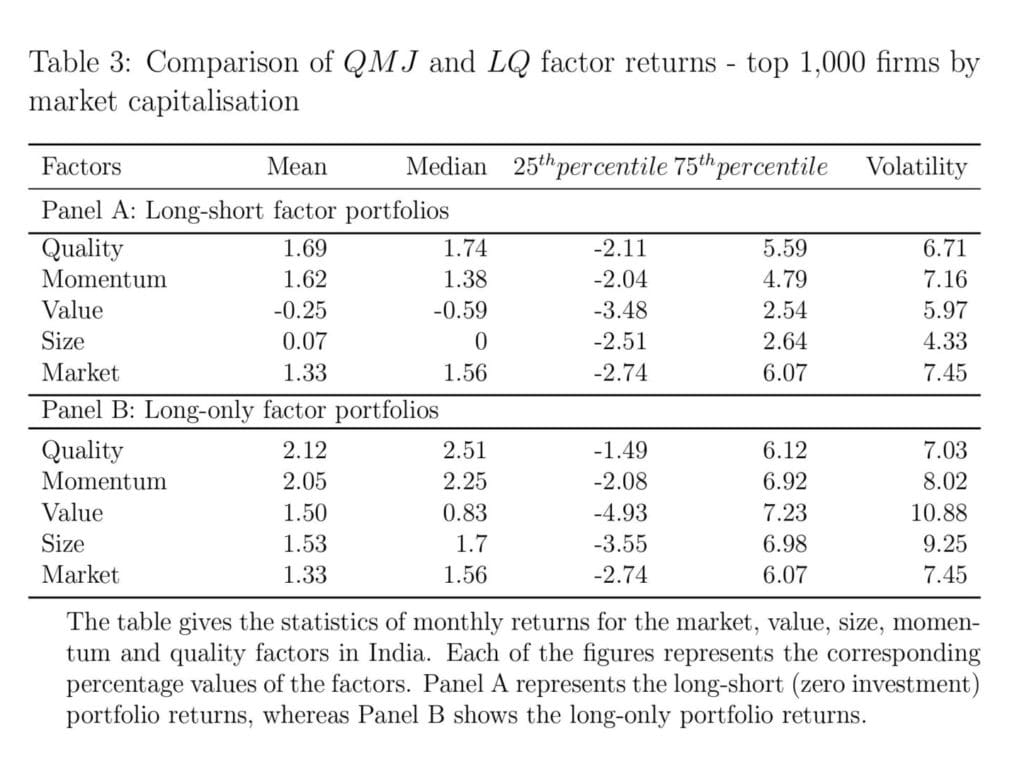
We find that among the different factors, QMJ has the highest average monthly returns. For instance, while the average returns on the market factor is 1.33%, the same for the QMJ factor is 1.69%. Both value and size factors earn significantly lower returns, with the value factor earning marginally negative returns. Only the momentum factor earns returns closest to the quality factor (1.62%). The quality factor returns also show lower volatility (6.71%) than the next best performer, the momentum factor (7.16%). Figure 2 shows the growth of INR 100 notional invested in long-short portfolios of the different factors over a 26-year period from April 1995 to March 2021. The figure shows that while the investment in QMJ factor portfolio would grow to INR 9,345, it only grew to INR 6,988 when invested in the momentum factor, and even lower for the other factors.
As indicated by the return of the LQ portfolio (as in Panel B), the performance of the quality factor is resilient to the exclusion of the short-leg of the portfolio. In fact, LQ outperforms long only versions of the other factors to a marginally higher degree than QMJ outperforms the long-short versions of those factors. For instance, the mean returns increases to 2.12%, an increase of 53 basis points, as compared to the long-short portfolio. Comparison based on the median shows a similar outperformance of the quality factor suggesting that its performance is not driven by a few months with extremely favourable returns.
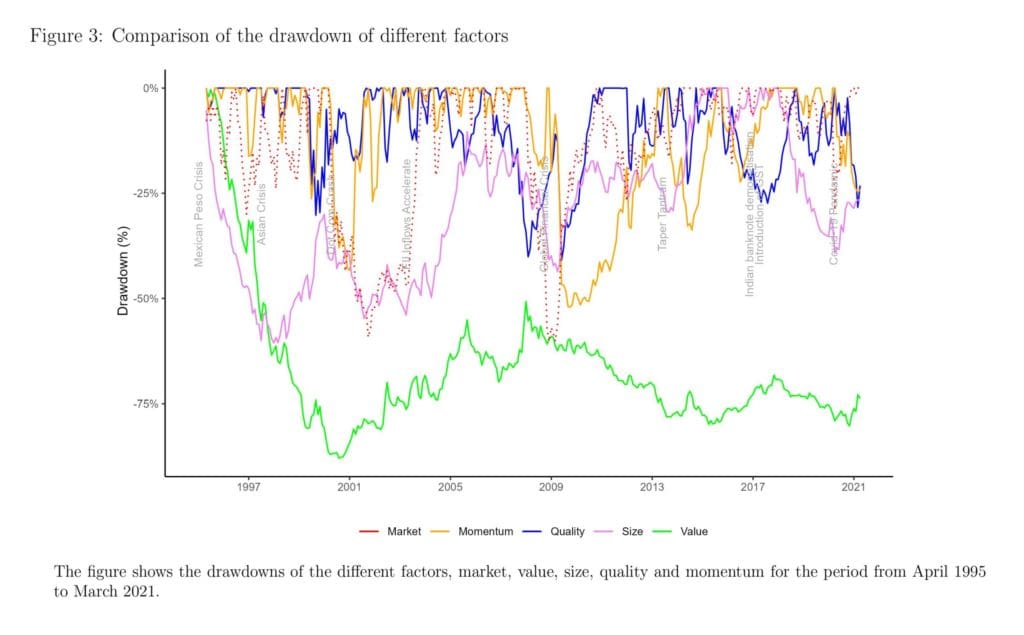
Evidently, portfolios constructed out of the quality factor have favourable drawdown characteristics. The average drawdown and the worst drawdown are the lowest for both the QMJ and LQ quality portfolios. For instance, the average drawdown for the QMJ (LQ) quality factor is only 9.76% (7.99%) as compared to 12.13% (14.52%) for the momentum factor. Comparison based on the drawdown period also suggests that the quality factor portfolios recover faster to relative to those based on other factors.
The monthly excess returns of the decile portfolios show an increasing trend with the quality rank of the portfolios. For instance, while the monthly value weighted excess return is 0.17% for the lowest quality decile, the corresponding figure for the highest decile (D10) is about 1.73%. The higher ranked quality deciles also show significant positive CAPM, three-factor and four-factor alphas. The results indicate that the quality factor earns excess returns even after accounting for the possible exposure to the other factors. For instance, the D10 portfolio earns a monthly four-factor alpha of about 0.69%. While the long-short portfolio involving extreme deciles (D10 – D1) earns significant positive three-factor alpha of 1.47% and four-factor alpha of 0.98%. The CAPM beta estimates of the quality deciles show that quality stocks tend to have lower betas, as could be expected. The significant alpha earned by the quality sorted portfolios suggests that investors can significantly improve the risk-return trade-off by optimizing stock portfolios based on their quality dimensions.
We examine the alpha of the quality factor, as defined in Equation 6 (QMJ), in Table 7. The first column gives the four-factor alpha of the quality factor. Columns (2) – (4) provide the alpha of analogous portfolios created by taking one of the quality dimensions, profitability, growth, safety and payout. We find that the QMJ factor generates a monthly four-factor alpha of 0.917% over the entire period. The alpha is economically significant given the market risk premium in India. The results also indicate that the QMJ factor has a positive exposure to the momentum factor, but has a negative exposure to both value and size. The coefficient of the market factor suggests that the quality factor delivers higher returns during relatively poor market conditions.”
Are you looking for more strategies to read about? Sign up for our newsletter or visit our Blog or Screener.
Do you want to learn more about Quantpedia Premium service? Check how Quantpedia works, our mission and Premium pricing offer.
Do you want to learn more about Quantpedia Pro service? Check its description, watch videos, review reporting capabilities and visit our pricing offer.
Do you want algorithmic access to the full Quantpedia database via the API? Subscribe to Quantpedia Pro, ask for an API key, and explore the in/out-of-sample statistics, source academic papers, and code snippets — ideal for quantitative research, systematic trading workflows, and AI model training.
Are you looking for historical data or backtesting platforms? Check our list of Algo Trading Discounts.
Or follow us on:
Facebook Group, Facebook Page, Telegram, Twitter, Linkedin, Medium or Youtube
Share onLinkedInTwitterFacebookRefer to a friend


