Pre-Election Drift in the Stock Market
Introduction
There are many calendar / seasonal anomalies by which we can enhance our overall investment strategy. One of the least frequent but still very interesting anomalies is for sure the Pre-Election Drift in the stock market in the United States. This year is the election year, and public discussion is getting more heated. The current president of the United States and candidate for re-election, Donald Trump, is a peculiar figure who split the population of the United States into two parts, ones who hate him and those who love him. We can probably expect volatile market moves as we will move closer to this year’s presidential election. But this post will not be about politics but about trading. In this post, we will try to uncover a pattern in historical data that shows significant market moves a few days before elections.
We will be focused on these few days in the analytics part of this paper, where we will discuss the pre-election drift. The reason why this anomaly is not so popular overall is that it’s affecting only a few days every even year. Therefore, it’s much less frequent than, for example, Turn of the Month or Option Expiration Week seasonality, which occurs every month or other calendar anomalies, which we discussed earlier at Quantpedia in this and this case study.
Elections in the United States
We will not be speaking about political parties, candidates, or process of the vote, but only shortly about election dates that we need to know before we start to analyze them.
In the United States, there are two elections for federal offices – elections for the United States Congress, which are held every second (even) year and presidential elections, which occur every fourth year. However, we don’t distinguish between these two elections, so we analyze them as one same event. Election’s day is specially set by United States law. The Congress defined occurrence of the election day as “the Tuesday next after the first Monday in the month of November”. This implies that the election day has to be between November 2 and November 8 of every even year.
Pre-Election Drift
We assume that the election will have a more significant impact on the more volatile stock market compared to the less risky fixed-income market. Due to the infrequent occurrence of this event, we selected a database of S&P 500 in the range from 1950 to 2018 in which an election’s day occurs only 35 times; however, it’s enough to perform and show the conclusion for our analysis. We analyze stock market action five days before an election day and five days after it.
Performing the analysis, we found that market action during days after elections is not statistically significant; therefore, we focused only on the days before elections with an election’s day included. Mentioned days are showing us positive drift of 0.39 % on average per day and 0.41 % with election day added. The performance of all single days is presented in Figure 1.
Figure 1 Pre/post and election’s day (D0) S&P 500 performance, 1950-2018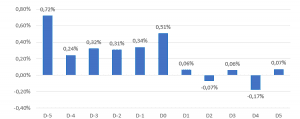
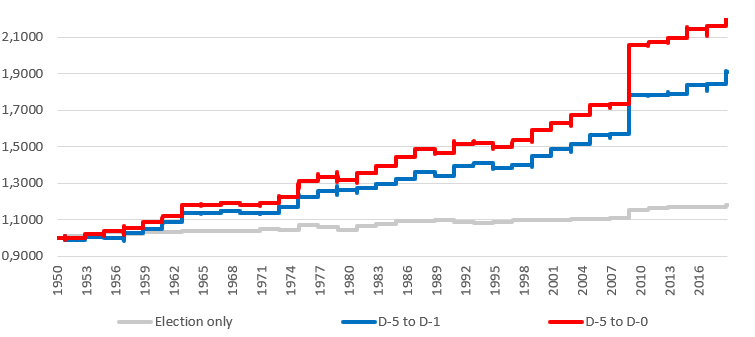
Based on this knowledge, we built three strategies:
- Pre-election’s days (D-5 – D-1),
- Election’s day (D-0),
- Combined (D-5 – D-0).
We didn’t include days after elections because of their low statistical significance, as we can see in Figure 1. They show no positive nor negative trend, and also their performance values have no statistical significance. On the contrary, the stock market on days before elections performed very well with a notable positive drift. The simple trading strategy consists of buying the S&P 500 (in whichever form: ETF, CFD …) at the market close before starting day and hold until the close of ending day. The results of the mentioned strategies are visible in Figure 2.
Figure 2 US Pre-Election Drift on S&P 500, 1950-2018
Performance of the strategy
The positive performance of all strategies is evident because of the positive effect of every day included; therefore, we will closely analyze only the best strategy. It is the strategy that contains six days from the fifth day before the election to the end of the election’s day that, on average, gives a performance of 2.46% per election. If we figuratively annualize this return for better representation of how strong this effect is, it gives us an annualized return of almost 180%, but the anomaly lasts only six days in every even year.
Figure 3 Strategy D-5 to D-0 performance
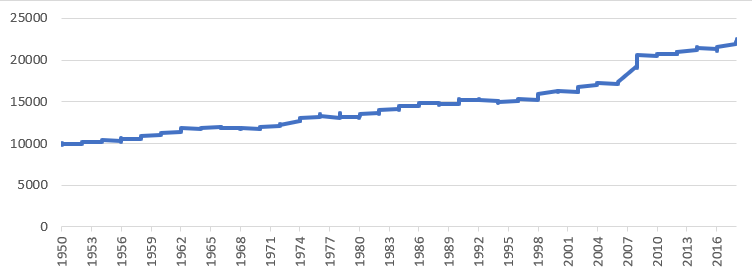
The strategy which holds the stock market from five days before the election until the election day (D-5 – D-0):
| Max decline | -2,47% |
| Max increase | 10,79% |
| Average return on one election | 2,46% |
| Average performance p.a. | 1,23% |
| Flat Performance since 1950 | 125,48% |
| Return to drawdown ratio | 0,50 |
In the analyzed period from 1950 to 2018, the initial amount that we could invest at the beginning more than doubled. From 10 000 USD invested in this strategy, we will end up after 210 days of record of this anomaly with more than 22 500 USD.
It’s sad that elections are not more often. Isn’t it 🙂
Conclusion
This anomaly, without any doubt, belongs to the more significant seasonal / calendar anomalies in the market of the United States. Though, one strong capability stands next to a big disability. The strategy needs its time, a lot of it, to generate interesting returns. In the last 68 years, the pre-election drift occurred only 35 times, which is in comparison to other calendar anomalies, not enough. That’s why Pre-Election Drift can only be a very small part of an investor’s overall strategy.
So, let us leave politics to politicians. Whoever the final two presidential candidates will be (if we are speaking about the upcoming presidential elections), the period before election would be hopefully positive for us, traders…
Authors:
Radovan Vojtko, CEO, Quantpedia.com
Dominik Cisar, Analyst, Quantpedia.com
Are you looking for strategies applicable in bear markets? Check Quantpedia’s Bear Market Strategies
Are you looking for more strategies to read about? Sign up for our newsletter or visit our Blog or Screener.
Do you want to learn more about Quantpedia Premium service? Check how Quantpedia works, our mission and Premium pricing offer.
Do you want to learn more about Quantpedia Pro service? Check its description, watch videos, review reporting capabilities and visit our pricing offer.
Do you want algorithmic access to the full Quantpedia database via the API? Subscribe to Quantpedia Pro, ask for an API key, and explore the in/out-of-sample statistics, source academic papers, and code snippets — ideal for quantitative research, systematic trading workflows, and AI model training.
Are you looking for historical data or backtesting platforms? Check our list of Algo Trading Discounts.
Or follow us on:
Facebook Group, Facebook Page, Telegram, Twitter, Linkedin, Medium or Youtube
Share onLinkedInTwitterFacebookRefer to a friend


