Private vs. Public Investment Strategies
Choosing the right investment strategy plays a crucial in portfolio allocation decisions, particularly when considering both private and public asset classes. While the reported performance of public assets typically matches their real-world performance, the same cannot be said for private assets due to the complexities of fund selection, commitment pacing, and return on uncalled and uncommitted capital. Fortunately, there are ways to incorporate public and private asset classes into one portfolio optimally. One example is the recent paper written by Xiang Xu, which introduces the Fair Comparison (FC) framework, which provides a methodology to measure the real-world performance of private investment strategies.
The framework involves four steps: Constructing a private investment strategy by allocating capital and making commitments to private funds while investing the remaining capital in a default public market index. Next, generating a terminal wealth distribution for private and public investment strategies, focusing on actual distributions and reinvestment. Subsequently, estimating the real-world mean and volatility of the private investment strategy based on the terminal wealth distribution. Finally, comparing risk-adjusted returns of private and public investment strategies by adding leverage to standardize risk levels and accounting for financing costs. The FC framework revealed that the real-world performance of private investment strategies significantly differs from reported values. CIOs can leverage this framework to make more informed asset allocation decisions based on the real-world performance of their private investment strategies.
Authors: Xiang Xu
Title: Private vs. Public Investment Strategies: Reported and Real-World Performance
Link: https://papers.ssrn.com/sol3/papers.cfm?abstract_id=4441449
Abstract:
Reported performance for a private asset class (e.g., private equity buyout funds) assumes an investor’s allocation is always fully invested in a highly diversified pool of private assets (e.g., funds). However, there are many real-world constraints that inhibit a CIO from experiencing this reported performance.
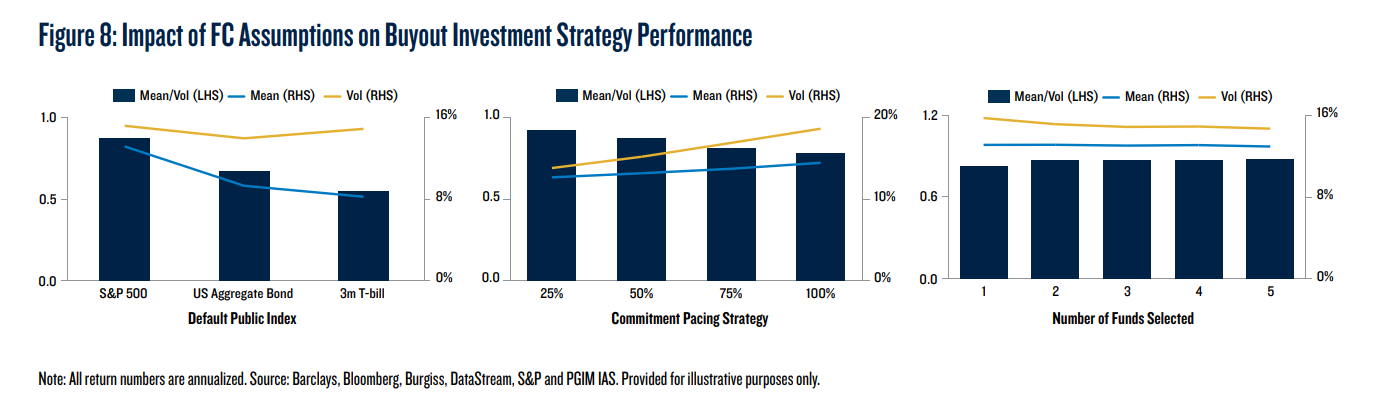
In practice, a CIO must follow an investment strategy to achieve a portfolio allocation to private assets. Such a strategy involves investing in only a subset of funds currently available (not the universe of funds), following a particular commitment pacing strategy, and temporarily holding uncalled and uncommitted capital in another asset class (say, a public market index or cash). Fund-selection uncertainty, commitment pacing, and the uncalled and uncommitted components are important contributors to a private investment strategy’s real-world performance. Consequently, a CIO’s private asset investment strategy is unlikely to experience the reported asset class performance.
In contrast, reported performance for a public asset class (e.g., publicly listed equities) closely matches its real-world performance since a CIO can, if desired, immediately and fully invest in the entire asset class. In other words, the performances of an allocation to public assets and of its associated public asset investment strategy are identical.
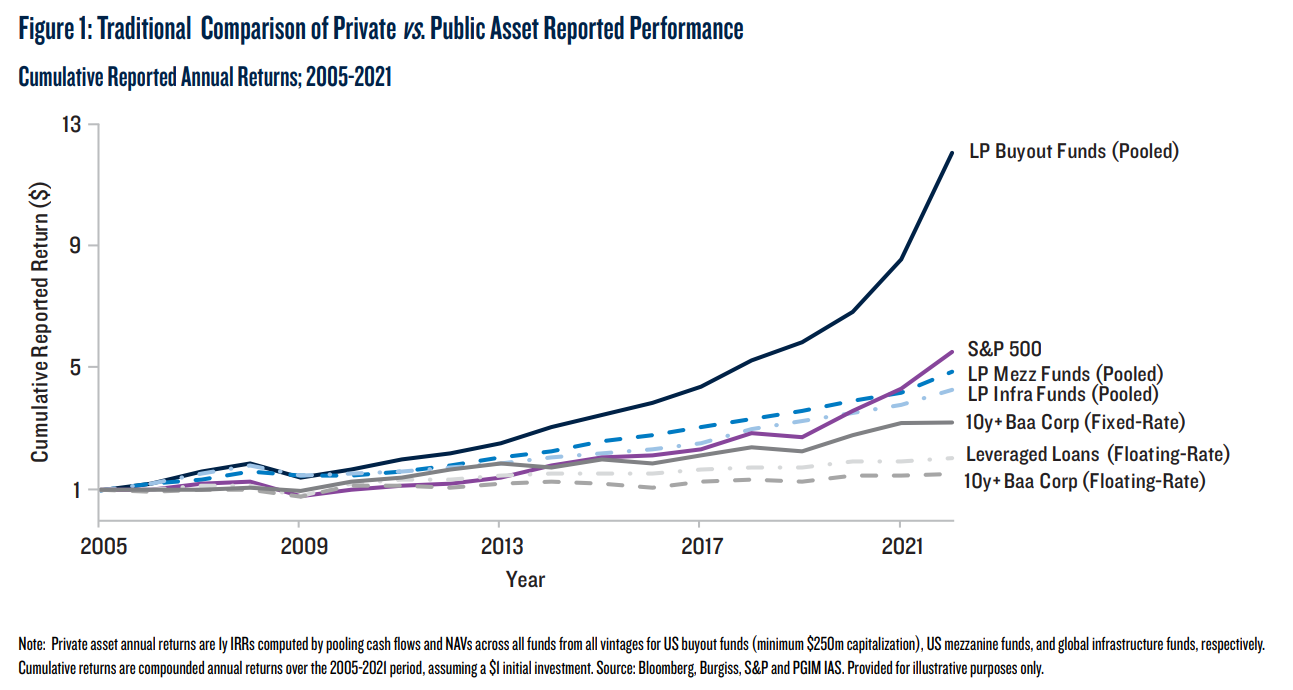
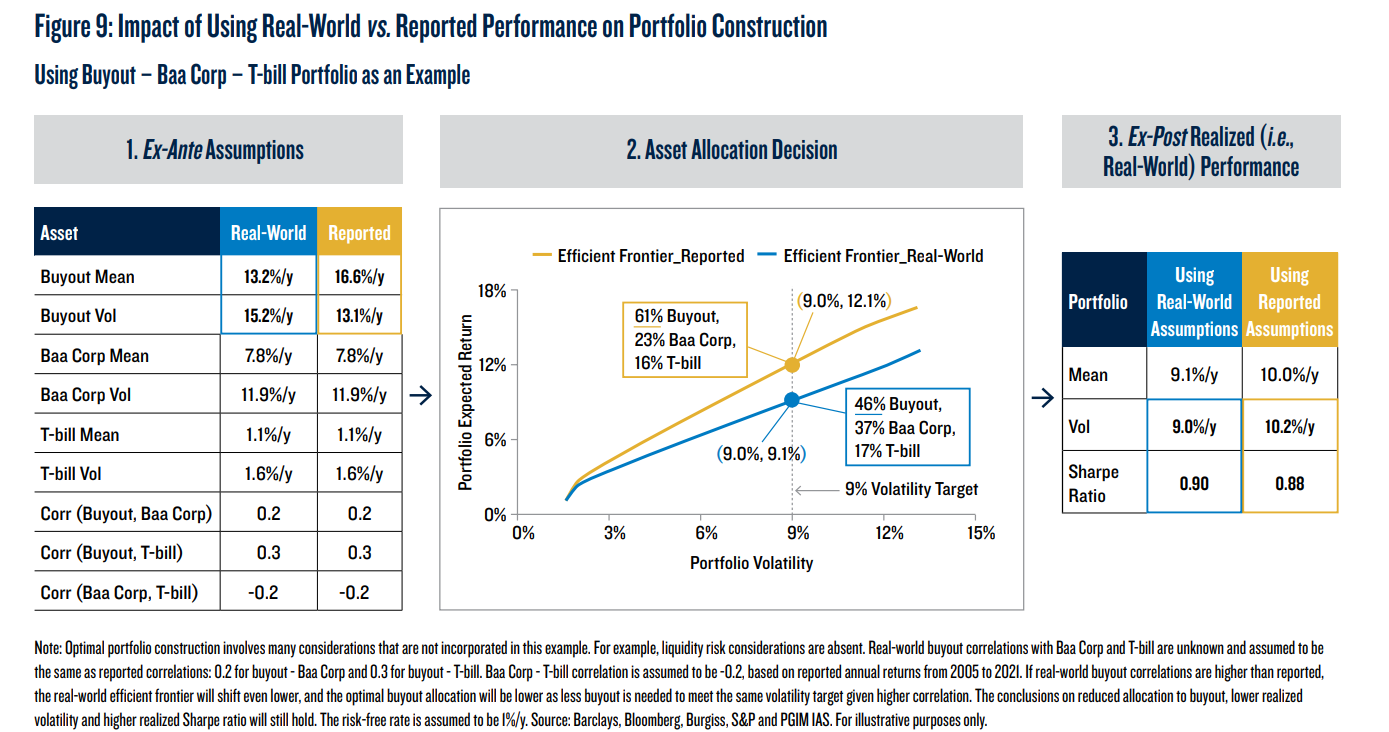
When making asset allocation decisions, CIOs often consult historical reported asset class performance. However, comparing private and public asset class reported performance can be misleading as it does not incorporate the constraints of achieving a private asset portfolio allocation. Instead, comparing private and public real-world asset class performance must be done at the investment strategy level.
As always we present several interesting figures:
Notable quotations from the academic research paper:
„To achieve an allocation to a private asset class, a CIO’s investment strategy will involve fund-selection uncertainty, commitment pacing, and the investment return on any uncalled and uncommitted capital. Consequently, the CIO’s real-world performance will not match the asset class’s reported performance.
CIOs must decide how to allocate between public and private investments. The first step in this decision-making process is usually an analysis of historical performance. Our FC framework is designed to measure performance that incorporates the real-world challenges and constraints involved with private investment strategies including private equity, private credit, and infrastructure LP fund investments (excluding hedge funds). CIOs can use the FC framework to fairly compare the historical performance of illiquid private and liquid public investment strategies.
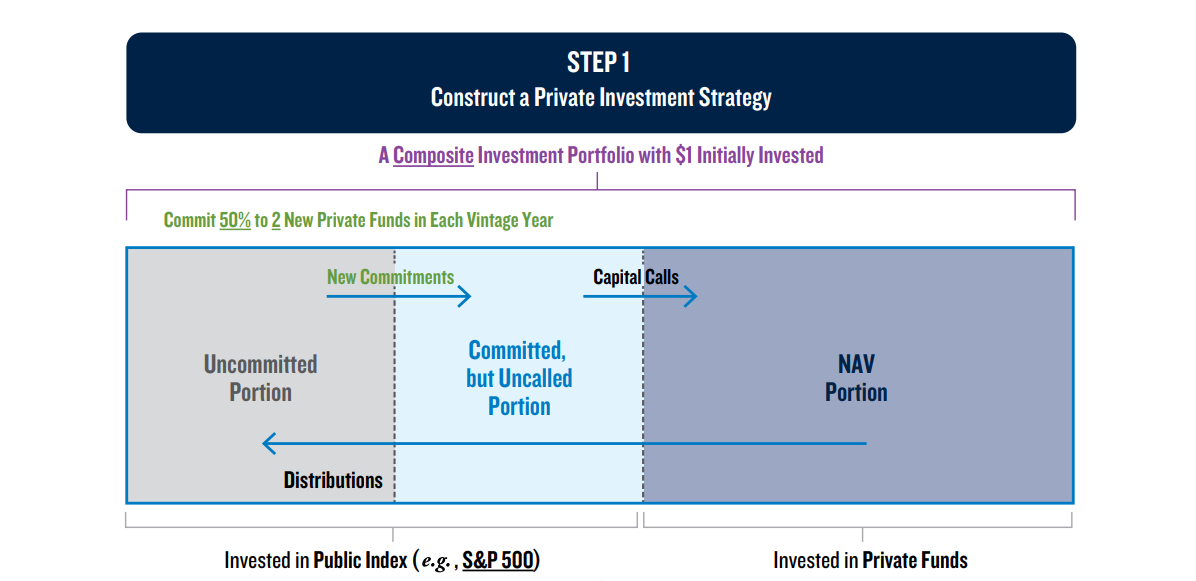
The first step of the framework is to construct a private investment strategy, represented by a composite private investment portfolio (Figure 2, Step 1). We assume investors start by allocating $1 to the strategy and make new commitments following a simple rule: commit, say, 50% of any uncommitted capital at the beginning of each vintage year, equally divided between two funds (irrespective of fund size) randomly selected from the vintage, and then wait for the GP’s capital calls. Any committed, but uncalled, capital and any uncommitted capital is invested in a default public market index (e.g., the S&P 500 Index).
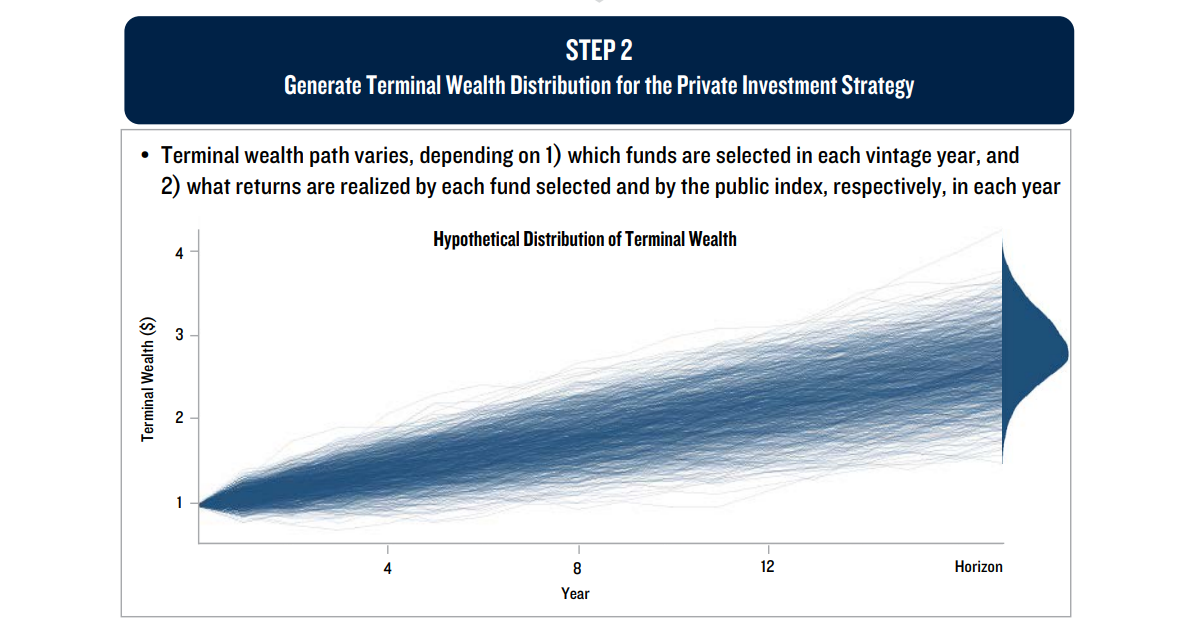
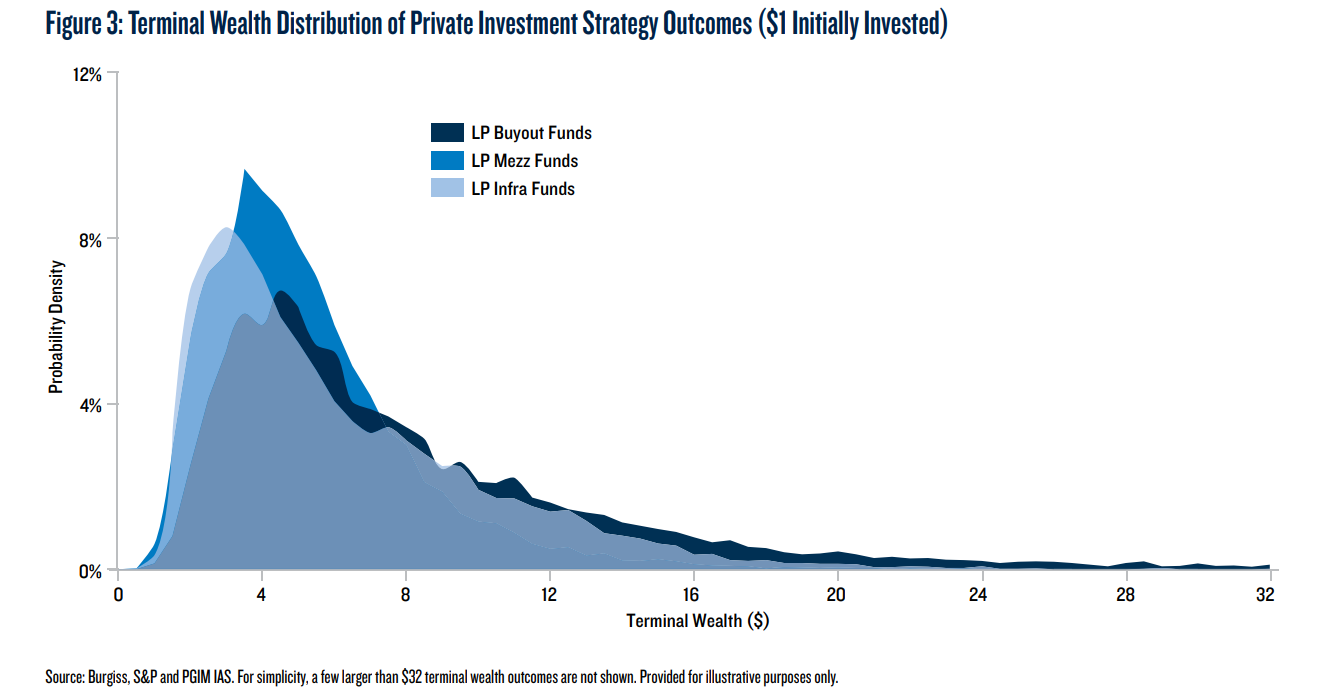
The second step in the FC framework is to generate a terminal wealth distribution for the private investment strategy. We rely on terminal wealth due to its reliability and relevance: first, terminal wealth measures the realized return based on actual distributions as well as reinvestment of the distributions, which are less sensitive to periodic GP valuations that can be subjective; second, since investors know their capital is inaccessible until returned by the GP, they are concerned with money received at the end of the investment, which is what terminal wealth measures.
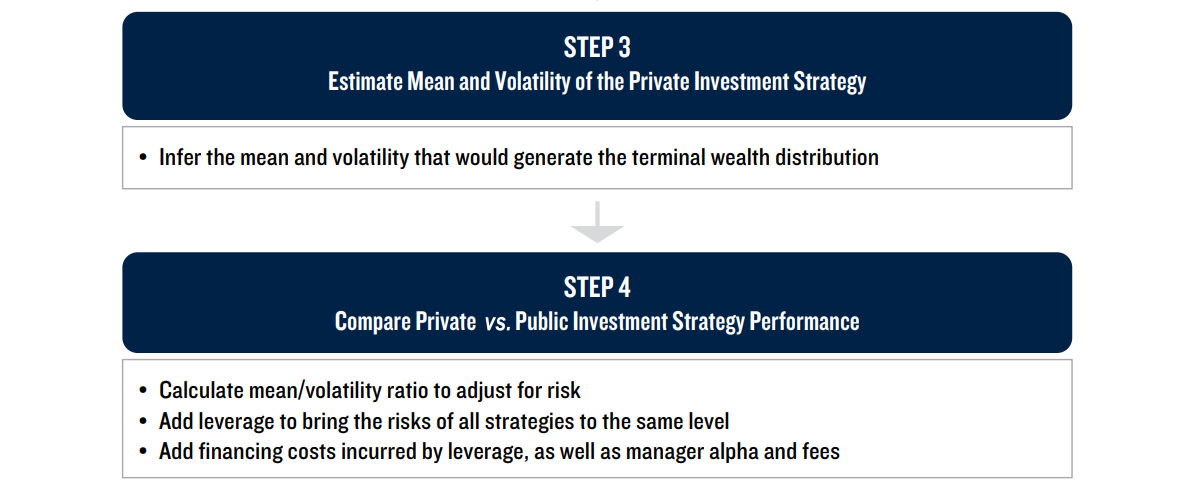
The third step in the FC framework is to work backwards from the terminal wealth distribution and estimate the real-world mean and volatility of the private investment strategy consistent with this terminal wealth distribution.
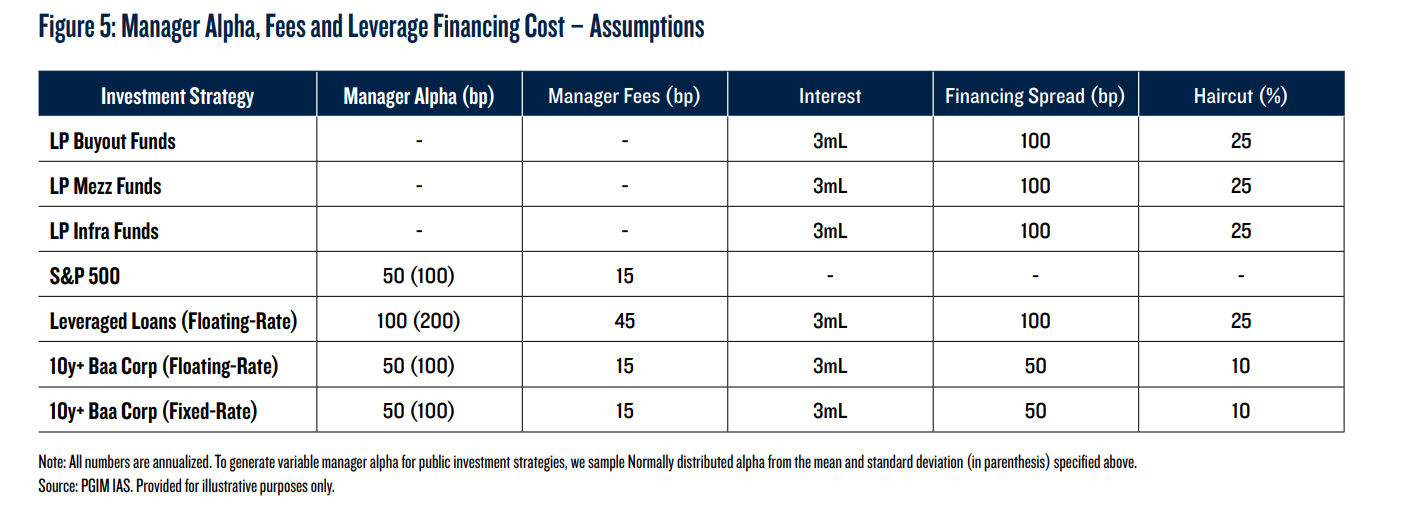
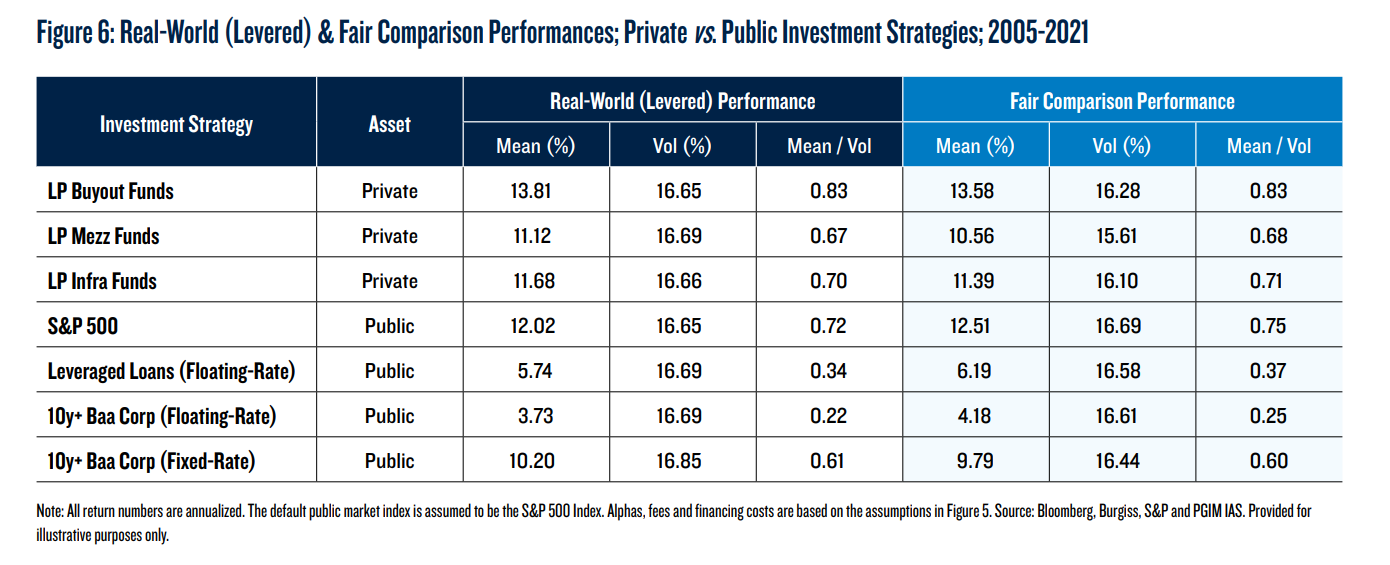
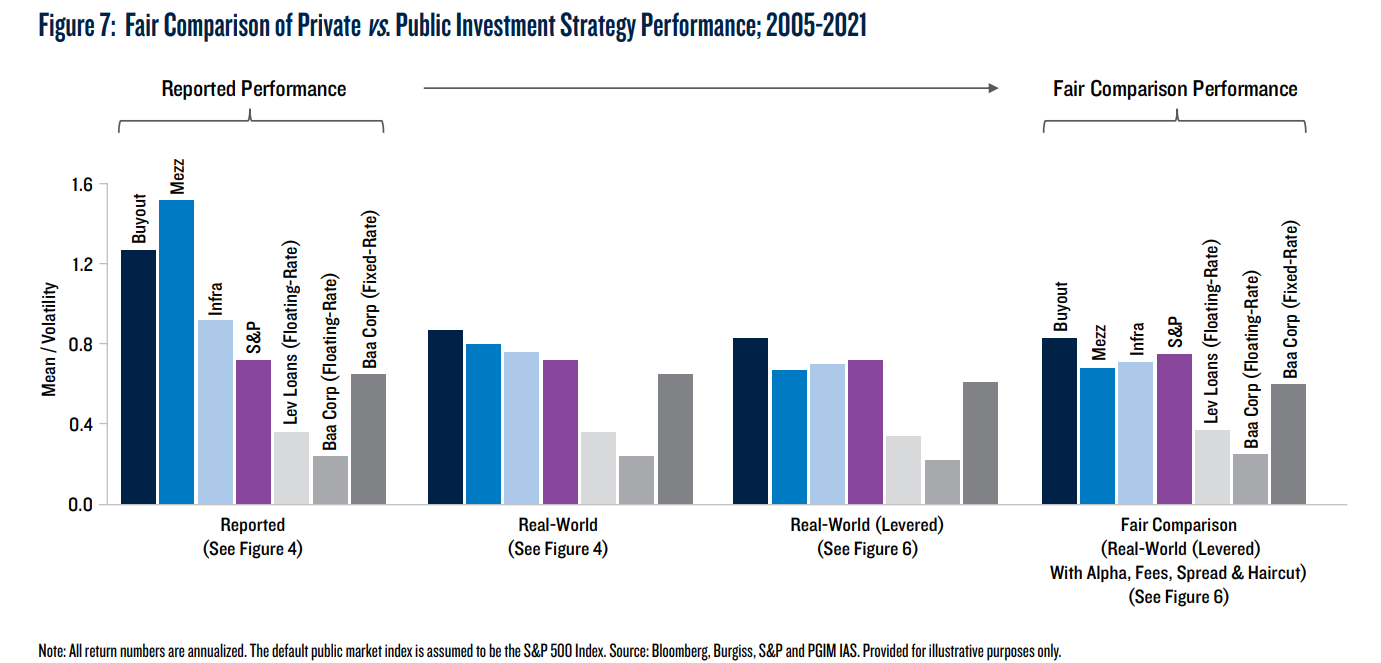
The fourth, and final, step in the FC framework is to compare risk-adjusted returns (i.e., mean/volatility ratios) of private and public investment strategies. To make volatilities comparable, the framework adds leverage to bring the risks of all strategies up to the same absolute level (to match the volatility of the highest volatility strategy), and accounts for financing costs incurred by leverage (interest, financing spread and haircut). Finally, the framework adds manager alpha and fees to public strategy returns as private strategy returns are active returns, net of fees.
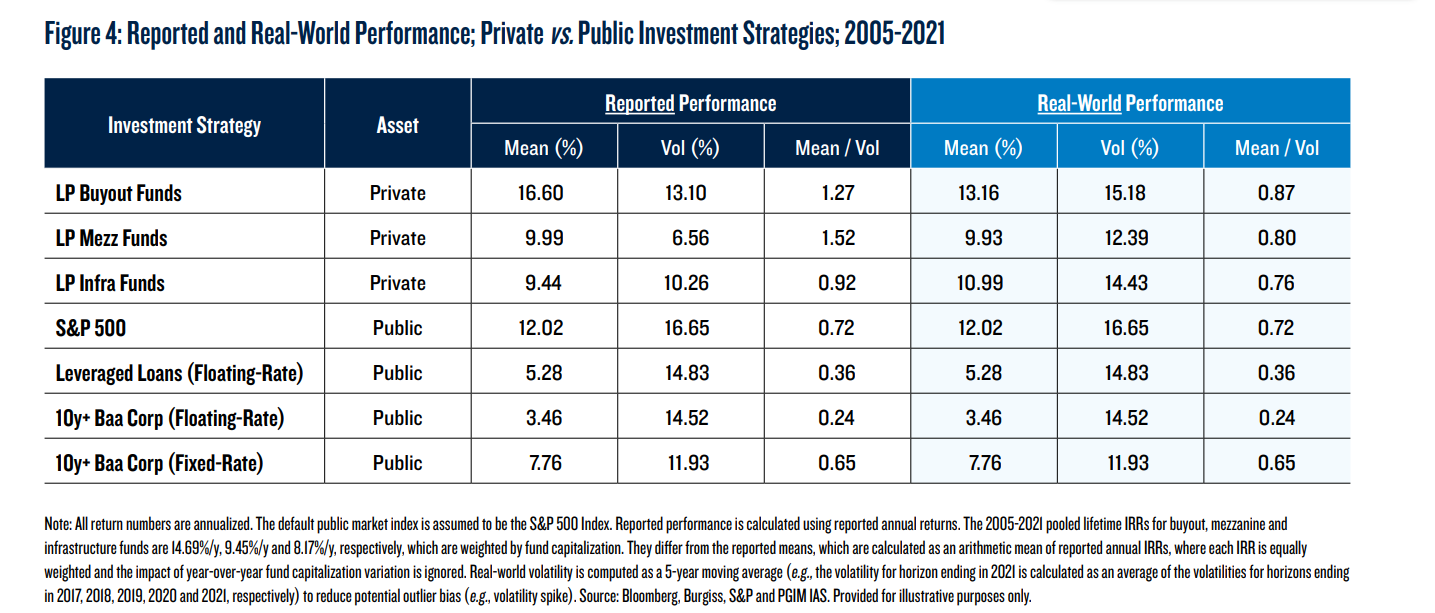
For 2005-2021, we find that real-world means and volatilities for private investment strategies are significantly different from their reported values. A buyout investment strategy outperformed mezzanine and infrastructure investment strategies, contrary to reported returns.
CIOs can use the FC framework, which can be customized based on their assumptions, to estimate the real-world performance of their private investment strategies and make better-informed asset allocation decisions.“
Are you looking for more strategies to read about? Sign up for our newsletter or visit our Blog or Screener.
Do you want to learn more about Quantpedia Premium service? Check how Quantpedia works, our mission and Premium pricing offer.
Do you want to learn more about Quantpedia Pro service? Check its description, watch videos, review reporting capabilities and visit our pricing offer.
Are you looking for historical data or backtesting platforms? Check our list of Algo Trading Discounts.
Would you like free access to our services? Then, open an account with Lightspeed and enjoy one year of Quantpedia Premium at no cost.
Or follow us on:
Facebook Group, Facebook Page, Twitter, Linkedin, Medium or Youtube
Share onLinkedInTwitterFacebookRefer to a friend


