Probability Distributions of Bull and Bear Market States
Numerous academic papers have shown that the options markets are not only the place where the supply and demand for options meets. For example, they might point out to the smart money positioning, help to assess risk in the form of implied volatility, or be base of the well-known fear index VIX. Novel research of Bhansali and Holdom (2021), uses information embedded in options markets to construct a probability-weighted mixture of two distributions of bull and bear market states for the S&P 500 index. The results show that the implied return distribution drastically change switching from normal to stressed market states and vice versa. Moreover, the uncertainty in both distributions changes in the same fashion.
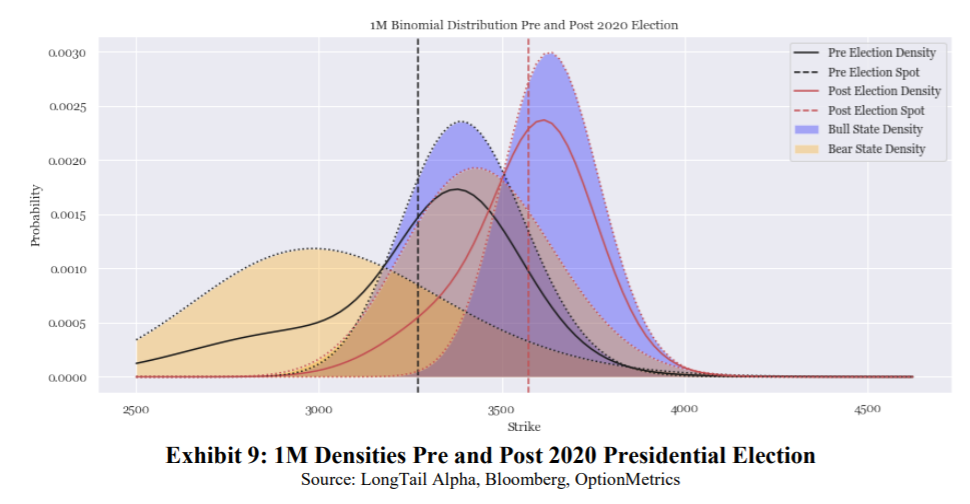
An excellent example is the shift of distribution before and after the recent US presidential election, which can be found below. Many have feared that if the democrat candidate Biden wins the elections, it would be a bad signal for the markets. However, after the uncertainty has passed, the fear has seemed to disappear. Additionally, the paper also shows how to use the bimodality in return distributions for the asset allocation using various utility functions. Allocations are made using a risky asset, risk-free and even options. Indeed, this research is worth reading.
Authors: Vineer Bhansali and Jeremie Holdom
Title: Good States, Bad States: What Do Options Tell Us About Schizophrenic Behavior of Mr. Market and What Can We Do About It?
Link: https://papers.ssrn.com/sol3/papers.cfm?abstract_id=3737144
Abstract:
Option prices theoretically encapsulate participants’ expectations about good state (bullish) and bad state (bearish) market outcomes. By using a mixture of distributions and reasonable assumptions, the authors extract time series of expected returns, volatilities and mixture probabilities of these outcomes surrounding the current US elections. The bimodality of asset return distributions suggests important modifications for asset allocation and risk management.
As always the results are best presented through charts and tables:
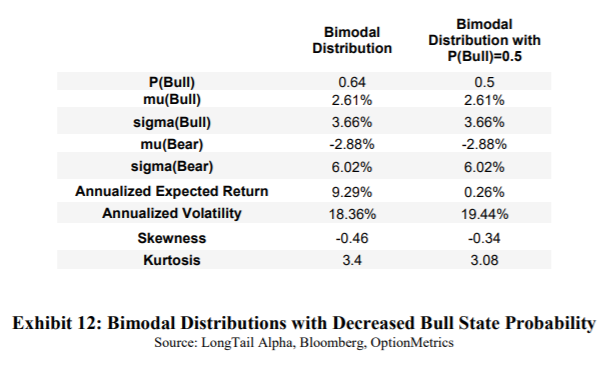
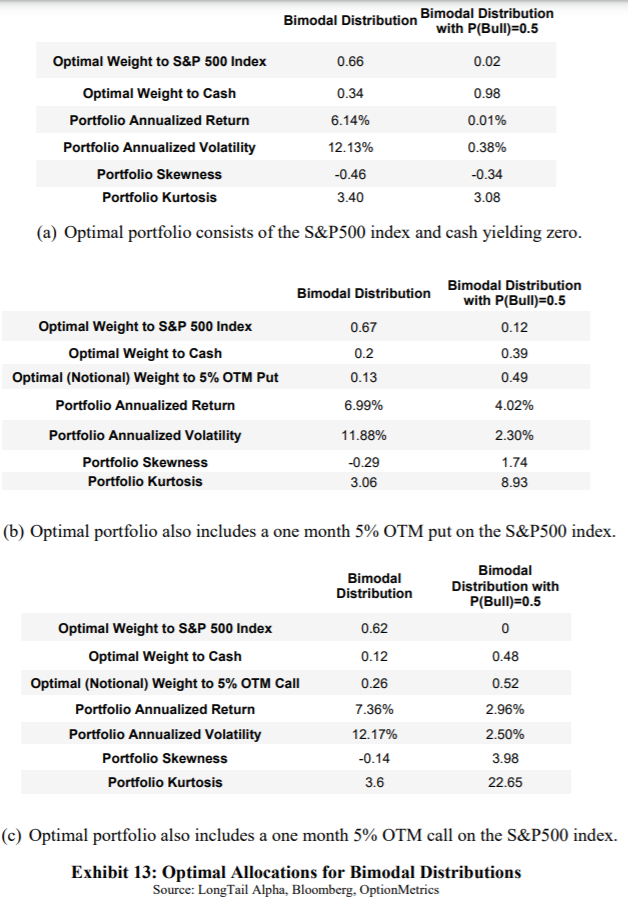
What if the bull probability changes? Quoting the paper: “Another way portfolio construction is impacted is if we believe that some of the market implied distribution estimates are inaccurate. For example, suppose the risk-neutral estimate of 64% probability of being in the good state over the next month was too high, and that the true probability was closer to 50%. Further, let us assume that the outcomes in the good state and bad state were unchanged from what is shown in Exhibit 10, i.e. the expected returns and volatilities were accurate. How would we implement this view? A reduction in the probability reduces the weighted average expected return since the bad state expected return is lower.”
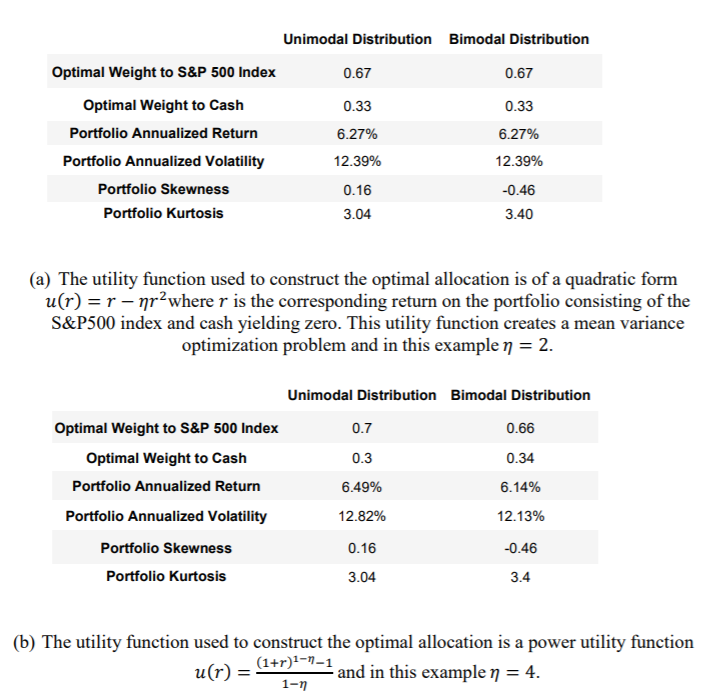
But how does the asset allocation, return and volatility changes?
Notable quotations from the academic research paper:
“What do the component distributions tell us about the expectations of risk and return in “good” (bull market), and “bad” (bear market) states? How do these expectations evolve with time as a function of major market events?
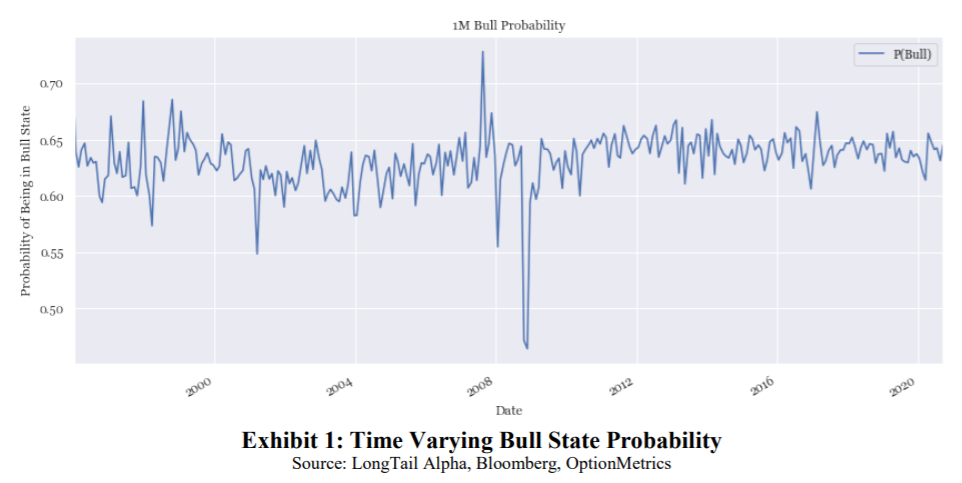
Does the probability of being in bull or bear states change significantly over time, especially during market crises and other significant market events?
Does the knowledge gained about the mixtures forming the actual implied distribution change optimal asset allocation and risk management techniques?
Our main findings regarding the first question are that the shape of the implied return distributions change significantly during normal and stressed market situations, and in particular the uncertainty in both distributions changes significantly during market stresses. Regarding the second question, we find that the probability of being in bull states and bear states during the period that our options data covers is relatively stable, which was a somewhat surprising result given the general belief both in the practitioner and behavioral finance literature that variation of subjective probabilities play the dominant role in shaping perceptions of risk and return. Our answer to the third question is that armed with the changing shape and mixture of the bull and bear states, investors can dynamically improve their risk management posture. Our purpose is to use this simple framework to explain the risk perception of market participants corresponding to two very distinct states. As discussed elsewhere, the possibility of bimodality in asset returns can significantly impact both the optimal asset allocation of investors, and the need for hedging (Bhansali [2013]). We have also found that when the probability of one type of event (good or bad) starts to approach unity as implied by the options markets, it can imply overconfidence in aggregate, and the market as a whole is unprepared for a reversal in the consensus.
| Algo Trading Promo Codes are available exclusively for Quantpedia’s readers. |
In our model, the expected value of an asset,𝑆𝑆, is the probability weighted average of its future payoffs at 𝑇 discounted back to the present time. The probability density function 𝑓 is estimated from option prices by taking the second derivative of call option prices with respect to strike (Breeden and Litzenberger [1978]). To capture potential bimodality of the distribution, a mixture of lognormals can be used to model 𝑓 (Melick and Thomas [1997]). In order to split the probability distribution into two distinct states, i.e. “good” and “bad”, or “bull” and “bear”, we force 𝑓 to be a mixture of two lognormals with mixing probability p [see the equation on page 5]. The fitting process proceeds as follows. Similar to Shimko [1993], we first use traded options prices to derive Black-Scholes implied volatilities and fit them to a quartic polynomial. This continuous function of the implied volatility curve is next used in the Black-Scholes formula to generate a continuous curve of option call prices. Finally, finite differencing is applied twice to the call prices to locally approximate the second derivative around the strikes of the original traded options. To fit the parameters of the mixture, we use standard nonlinear least squares.
At the time of this writing, Presidential elections in the U.S. for the 2020 were just concluded, but the results were not officially accepted by the incumbent, Donald Trump. The general perception in the markets is that the Democratic candidate, Joe Biden, is less business and market friendly. Muddying the analysis is the fact that as of this writing (mid November 2020), Congressional elections are also somewhat undetermined. The general consensus in the markets is that if both the House and the Senate turn Democrat, the Trump tax friendly initiatives will be swiftly overturned, and this would be negative for the companies who have benefited from lower taxes. On the other hand, a split Congress would make any tax changes much harder to implement, so “status quo”, i.e. not large changes, would be more market friendly. The parameter estimates are displayed in Exhibit 8. As we can see the probability of being in the bull and bear states has not changed. This could be partly due to the status quo described above, or could be due to the fact that the stock market is increasingly reliant on the aid from the Federal Reserve. Looking at the volatility estimates, we see that both bull and bear state volatilities have collapsed in the aftermath of the election, but the bear state volatility has seen a larger percentage decline than the bull state volatility. The conditional negative expected bear state return has also fallen by over half, accompanied by a fall in the bear state uncertainty. This suggests to us that the passing of the election has taken out the election event risk, with the markets left generally comfortable that the stimulus action from the Fed, and potential future fiscal action is on balance good for the stock market.
Finally, as displayed in exhibit 9 [see above], we can see that both state densities have both shifted to the right and narrowed substantially. The very significant compression of the bear state density shows again that the possibility of a large fat left tail event has been truncated as the election day has passed. While there is still uncertainty on the final outcome of the election, as of this writing, it seems that the markets are implying little further uncertainty or unexpected events over the next month. It is not the place for us to express our own views on the matter, but to the extent that market participants have the opposite view on the possibility of more uncertainty, we hope the quantification in this section is helpful in creating better portfolio postures if indeed the market consensus turns out to be wrong.
Our practical conclusions are intuitive and logical: investors faced with highly unpredictable states can manage their portfolios more effectively by dynamically allocating between risky and riskless assets and also by using options. This illustrates that when Mr. Market is behaving erratically, smart investors can avail of the tools from quantitative finance and derivatives markets to create attractive asymmetries in their portfolio.”
Are you looking for more strategies to read about? Sign up for our newsletter or visit our Blog or Screener.
Do you want to learn more about Quantpedia Premium service? Check how Quantpedia works, our mission and Premium pricing offer.
Do you want to learn more about Quantpedia Pro service? Check its description, watch videos, review reporting capabilities and visit our pricing offer.
Do you want algorithmic access to the full Quantpedia database via the API? Subscribe to Quantpedia Pro, ask for an API key, and explore the in/out-of-sample statistics, source academic papers, and code snippets — ideal for quantitative research, systematic trading workflows, and AI model training.
Are you looking for historical data or backtesting platforms? Check our list of Algo Trading Discounts.
Or follow us on:
Facebook Group, Facebook Page, Telegram, Twitter, Linkedin, Medium or Youtube
Share onLinkedInTwitterFacebookRefer to a friend


