Quantpedia API for Peer Group Strategy Analysis
Introduction
A single backtest can show that strategy was profitable, but it does not always show whether the strategy was competitive. This is especially true for systematic futures strategies. A trend-following strategy can have a positive Sharpe ratio, a long live-like performance history, and a reasonable drawdown, but those numbers are difficult to interpret without a relevant comparison group.
A broad equity index is often not the right benchmark for this type of strategy. A monthly rebalanced multi-asset futures strategy has a different objective, different risk profile, and different return drivers than a long-only stock index. A more useful question is whether the strategy performs well compared with other systematic trend-following futures strategies.
This case study shows how the Quantpedia API can be used to build a custom peer group benchmark for strategy evaluation. The workflow has two steps. First, Quantpedia strategy metadata is used to screen and define a comparable peer group. Second, the historical equity curves of the selected strategies are downloaded, converted into daily returns, and aggregated into an equal-weighted peer group benchmark.

,
Why Peer Group Analysis Matters
Strategy evaluation is usually stronger when the benchmark reflects the strategy’s own investment universe. A trend-following futures strategy should not be judged only against equities, because its expected behavior is different. It may benefit from persistent trends across bonds, currencies, commodities, or equity index futures. It may also experience losses during trend reversals or periods when several futures markets move without clear direction.
Peer group analysis solves this problem by comparing like with like. Instead of asking whether a strategy outperformed an unrelated market index, the researcher asks whether it performed well relative to similar systematic strategies. This makes the analysis more practical for due diligence, research validation, and portfolio construction.
The goal is not only to calculate one benchmark line. The goal is to understand where a strategy stands within a relevant universe. A researcher can compare CAGR, Sharpe ratio, volatility, maximum drawdown, Calmar ratio, and percentile ranking. This creates a more informative view than a standalone backtest.
Peer Group Screening Criteria
The example peer group is focused on trend-following futures strategies with monthly rebalancing and multi-asset coverage. The intended universe includes strategies connected to currencies, bonds, equities, and commodities. This keeps the comparison relevant for a systematic multi-asset futures strategy rather than a single-market model.
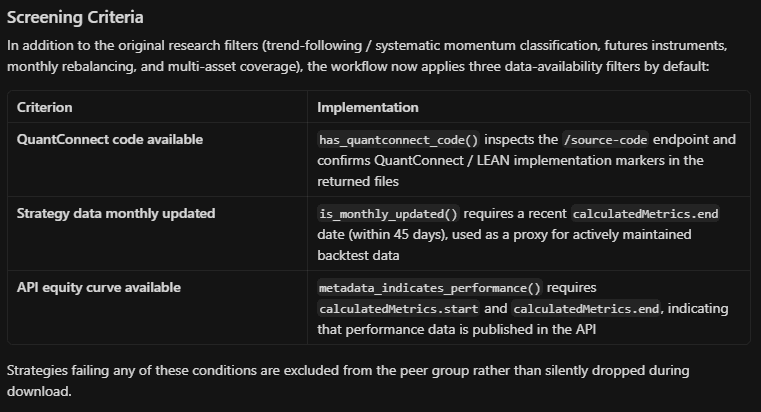
The workflow also applies data and implementation filters. Each final strategy must have QuantConnect code available, monthly updated performance metadata, and a downloadable equity curve through the Quantpedia API. These filters are important because the benchmark should be based on strategies that are not only conceptually comparable, but also usable in an empirical research workflow.
,
This separation between research screening and data validation is important. Some strategies may match the broad qualitative idea, but if they do not have the necessary downloadable return series, they cannot be used in the benchmark calculation. The final peer group therefore includes only strategies that satisfy both the research definition and the data availability requirements.
Final Peer Group
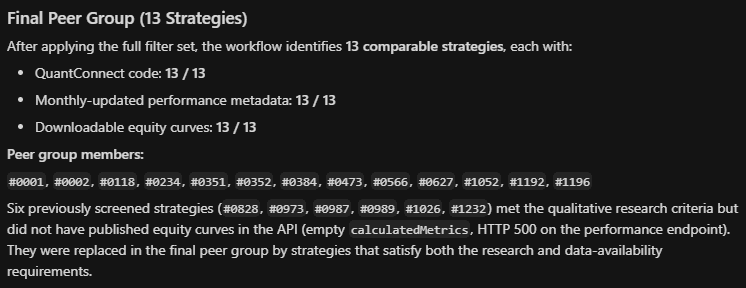
After applying the full screening and data-availability filters, the workflow identifies 13 comparable strategies. Each strategy in the final peer group has QuantConnect code available, monthly updated performance metadata, and an accessible historical equity curve through the Quantpedia API.
,
The final peer group contains the following 13 strategy IDs: #0001, #0002, #0118, #0234, #0351, #0352, #0384, #0473, #0566, #0627, #1052, #1192, and #1196.
This is the key point of the case study. The benchmark is not constructed from a partial or incomplete group. It is built from all 13 selected peer group members. The screening step creates the comparable universe, and the data validation step ensures that every selected strategy can contribute to the benchmark.
Benchmark Construction
Once the peer group is defined, the workflow downloads the historical performance series for each strategy. Each equity curve is converted into daily returns. These return series are then aligned on a common date index, while preserving missing values where a strategy does not have data for a specific date.
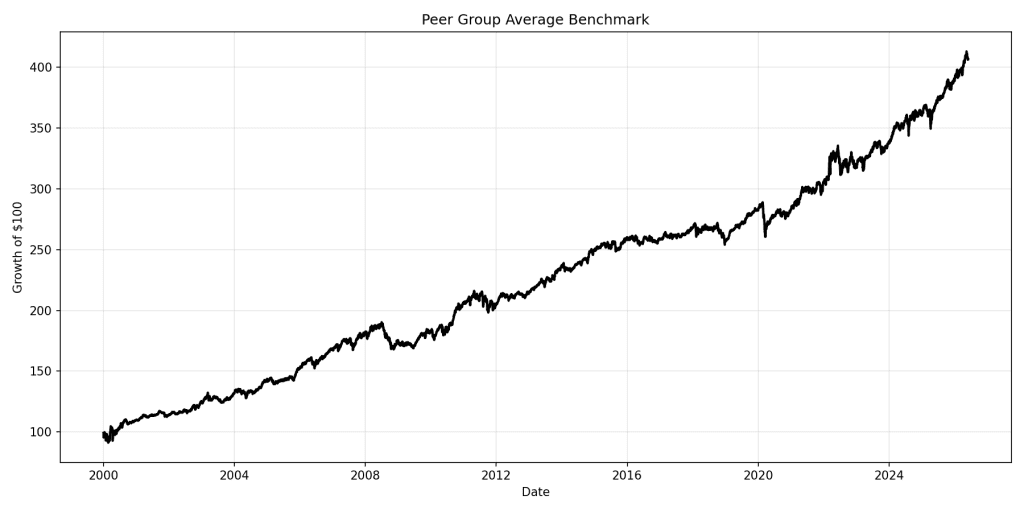
The peer group benchmark is calculated as an equal-weighted average of the aligned daily return series from all 13 peer group members. This creates a daily peer group average return series. The benchmark equity curve is then reconstructed by compounding this average daily return through time.
This approach gives the researcher a clean and intuitive benchmark. It is not a generic market index and it is not a single selected strategy. It represents the average daily performance of the selected group of comparable trend-following, multi-asset futures strategies.
,
Benchmark Results
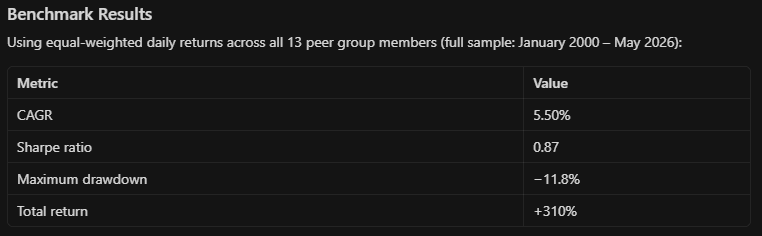
Using equal-weighted daily returns across all 13 peer group members, the benchmark covers the period from January 2000 to May 2026. Over the full sample, the peer group benchmark achieved a CAGR of 5.50%, a Sharpe ratio of 0.87, a maximum drawdown of –11.8%, and a total return of +310%.
,
These numbers should be interpreted as a research benchmark, not as a standalone investment recommendation. The value is in the context. If a new trend-following futures strategy produces similar returns but with a lower drawdown, that may be meaningful. If it has a higher CAGR but much higher volatility, the comparison becomes more nuanced. If it ranks below the peer group average on most metrics, the strategy may require further improvement before it can be considered competitive.
Peer Group Dispersion
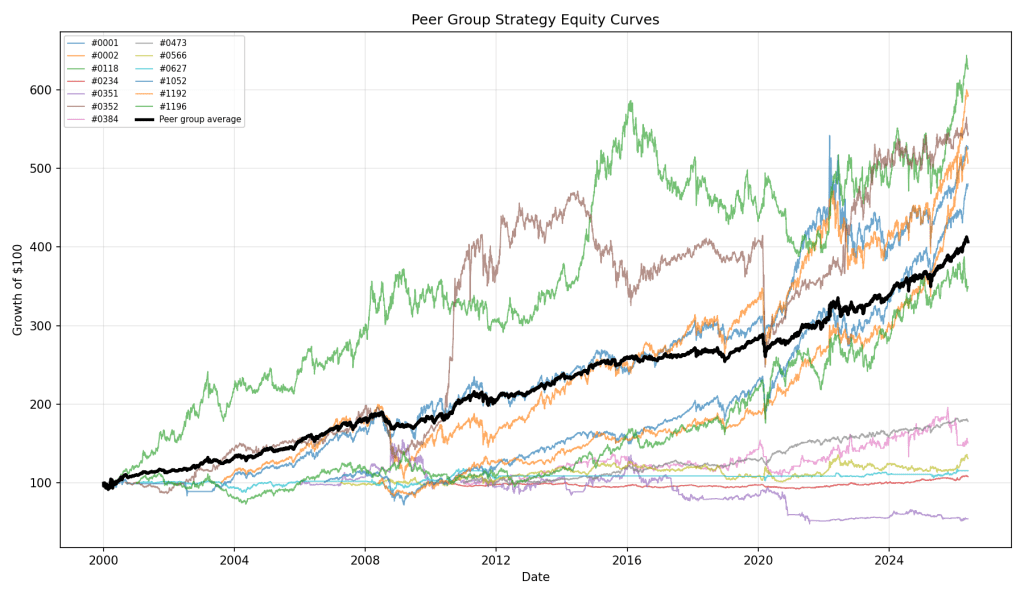
The peer group average is useful, but it does not show the full distribution of outcomes. Individual strategy equity curves reveal how different strategies behaved through time. Some strategies compound more aggressively, while others remain flatter. Some experience deeper drawdowns, while others are more defensive. This dispersion is exactly why peer group analysis is useful.
,
The individual curves also help the researcher check whether the benchmark is dominated by one outlier or whether it represents a broader central tendency. In this example, the peer group includes a range of performance paths, but the average benchmark remains relatively stable and interpretable over the full sample.
External Strategy Comparison
The workflow can also compare an external strategy against the peer group benchmark. The external strategy can come from a proprietary backtest, a QuantConnect implementation, a Python research notebook, or any other source that can export an equity curve or daily return series to CSV.
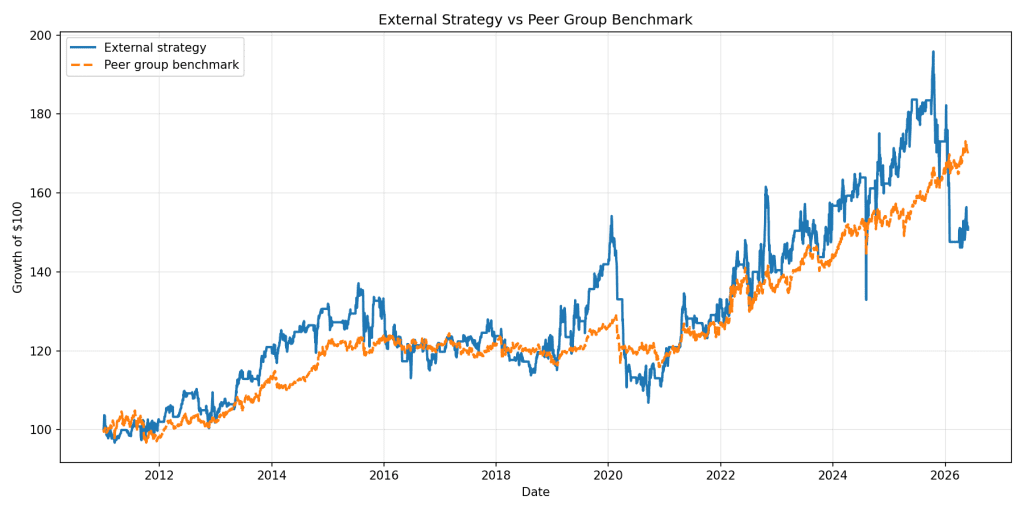
The external strategy is aligned with the peer group benchmark over the overlapping sample period. The same statistics are then calculated for both series. This allows the researcher to evaluate whether the external strategy improves on the peer group average or simply behaves like a weaker version of strategies already available in the research universe.
,
In the example, the external strategy follows a broadly similar long-term path, but with higher fluctuations during several periods. The peer group benchmark provides a practical reference point, because it shows what the average comparable strategy achieved over the same period.
Percentile Ranking
The next layer of analysis is percentile ranking. Instead of comparing the external strategy only against the peer group average, the workflow ranks it against the distribution of individual peer group strategies.
This answers a more specific research question: where does the strategy stand inside the peer group? A strategy may beat the average but still not rank near the top of the group. Another strategy may have only average returns but much better drawdown control. Percentile ranking helps separate these cases.
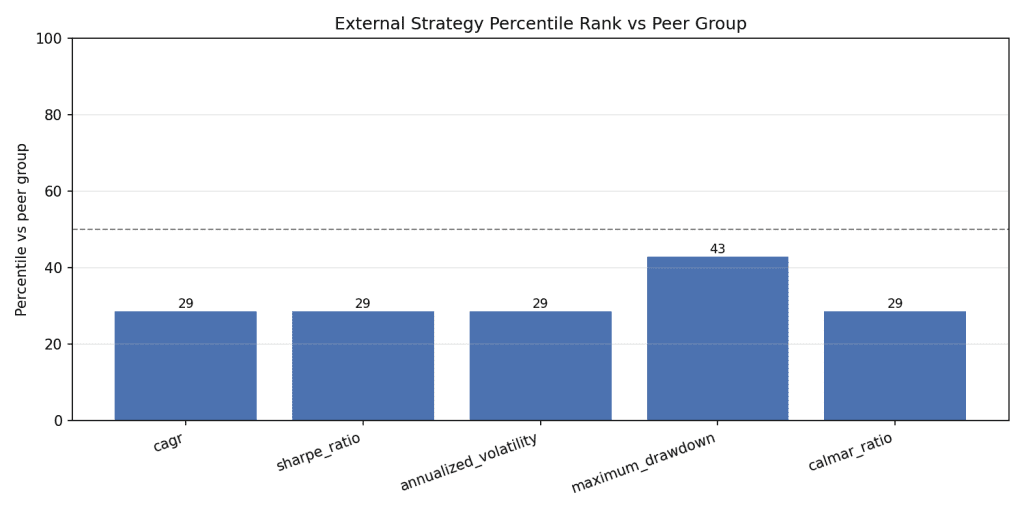
The workflow calculates percentile ranks for CAGR, Sharpe ratio, annualized volatility, maximum drawdown, and Calmar ratio. The interpretation depends on the metric. For return, Sharpe ratio, and Calmar ratio, higher values are generally better. For volatility and drawdown, the ranking logic must account for the fact that lower risk is usually preferable.
,
In the displayed example, the external strategy ranks below the peer group median on most selected metrics. This does not automatically mean that the strategy is unusable, but it gives a clear diagnostic signal. The strategy does not obviously outperform the comparable Quantpedia peer group and may require further research, rule refinement, or additional robustness checks.
Reproducibility and Outputs
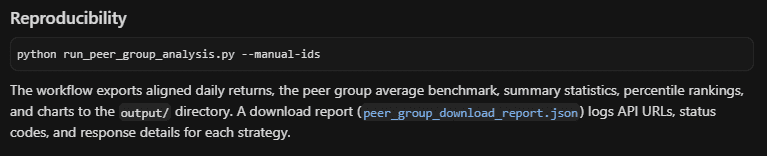
The workflow is organized as a small reproducible Python project rather than a single isolated script. The folder contains separate modules for API access, peer group screening, analytics, visualization, configuration, and the main execution file. This makes the workflow easier to inspect, rerun, and adapt to another strategy family.

The workflow is designed as a reproducible research process. It exports aligned peer group daily returns, the peer group average benchmark, summary statistics, percentile rankings, and external strategy comparison results when an external CSV file is provided. It also generates charts for the peer group benchmark, individual strategy equity curves, external strategy comparison, and percentile ranking.
,
Research Interpretation
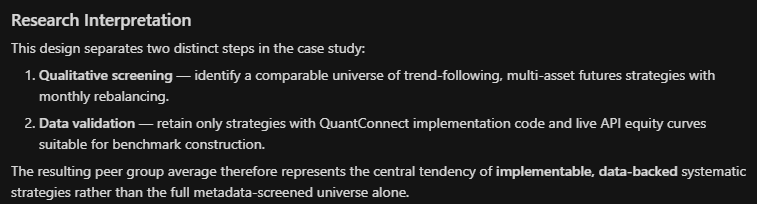
The main research value of the workflow is the separation between screening and benchmark construction. First, the researcher defines the peer group using Quantpedia API metadata. Then the researcher validates the data availability, downloads the performance series, and builds a benchmark from actual daily returns.
,
This two-step method avoids a common problem in strategy analysis. It does not assume that every strategy in a broad category is automatically suitable for comparison. The peer group must be both conceptually relevant and empirically usable. Only then does it become a reliable benchmark for strategy evaluation.
The same method can be extended to different research categories. For arbitrage strategies, the peer group can focus on market-neutral or spread-based systems. For value stock-picking strategies, the benchmark can be built from equity strategies with value-based selection rules. For growth stock-picking strategies, the peer group can focus on earnings growth, quality-growth, or momentum-growth concepts. For crypto strategies, the workflow can identify comparable digital asset strategies with similar rebalancing rules and data availability.
,
Conclusion
Quantpedia API can be used not only to retrieve individual strategy data, but also to build custom peer group benchmarks for strategy evaluation. This is useful because many systematic strategies do not have an obvious benchmark. A trend-following futures strategy should be compared with other trend-following futures strategies, not only with a broad equity index.
In this case study, the workflow identifies 13 comparable trend-following, multi-asset futures strategies with monthly rebalancing, QuantConnect code availability, monthly updated performance metadata, and downloadable equity curves. Their daily returns are aggregated into an equal-weighted peer group benchmark covering January 2000 to May 2026. The resulting benchmark achieved a CAGR of 5.50%, a Sharpe ratio of 0.87, a maximum drawdown of –11.8%, and a total return of +310%.
The workflow also supports external strategy comparison and percentile ranking. This gives researchers a practical way to evaluate whether a new strategy is genuinely competitive within its own category. The core idea is simple: first build a relevant peer group through Quantpedia API screening, then download the performance data and turn that peer group into a benchmark for research diagnostics.
Author: David Mesicek, Junior Quant Analyst, Quantpedia
Are you looking for more strategies to read about? Sign up for our newsletter or visit our Blog or Screener.
Do you want to learn more about Quantpedia Premium service? Check how Quantpedia works, our mission and Premium pricing offer.
Do you want to learn more about Quantpedia Pro service? Check its description, watch videos, review reporting capabilities and visit our pricing offer.
Do you want algorithmic access to the full Quantpedia database via the API? Subscribe to Quantpedia Pro, ask for an API key, and explore the in/out-of-sample statistics, source academic papers, and code snippets — ideal for quantitative research, systematic trading workflows, and AI model training.
Are you looking for historical data or backtesting platforms? Check our list of Algo Trading Discounts.
Or follow us on:
Facebook Group, Facebook Page, Telegram, Twitter, Linkedin, Medium or Youtube
Share onLinkedInTwitterFacebookRefer to a friend